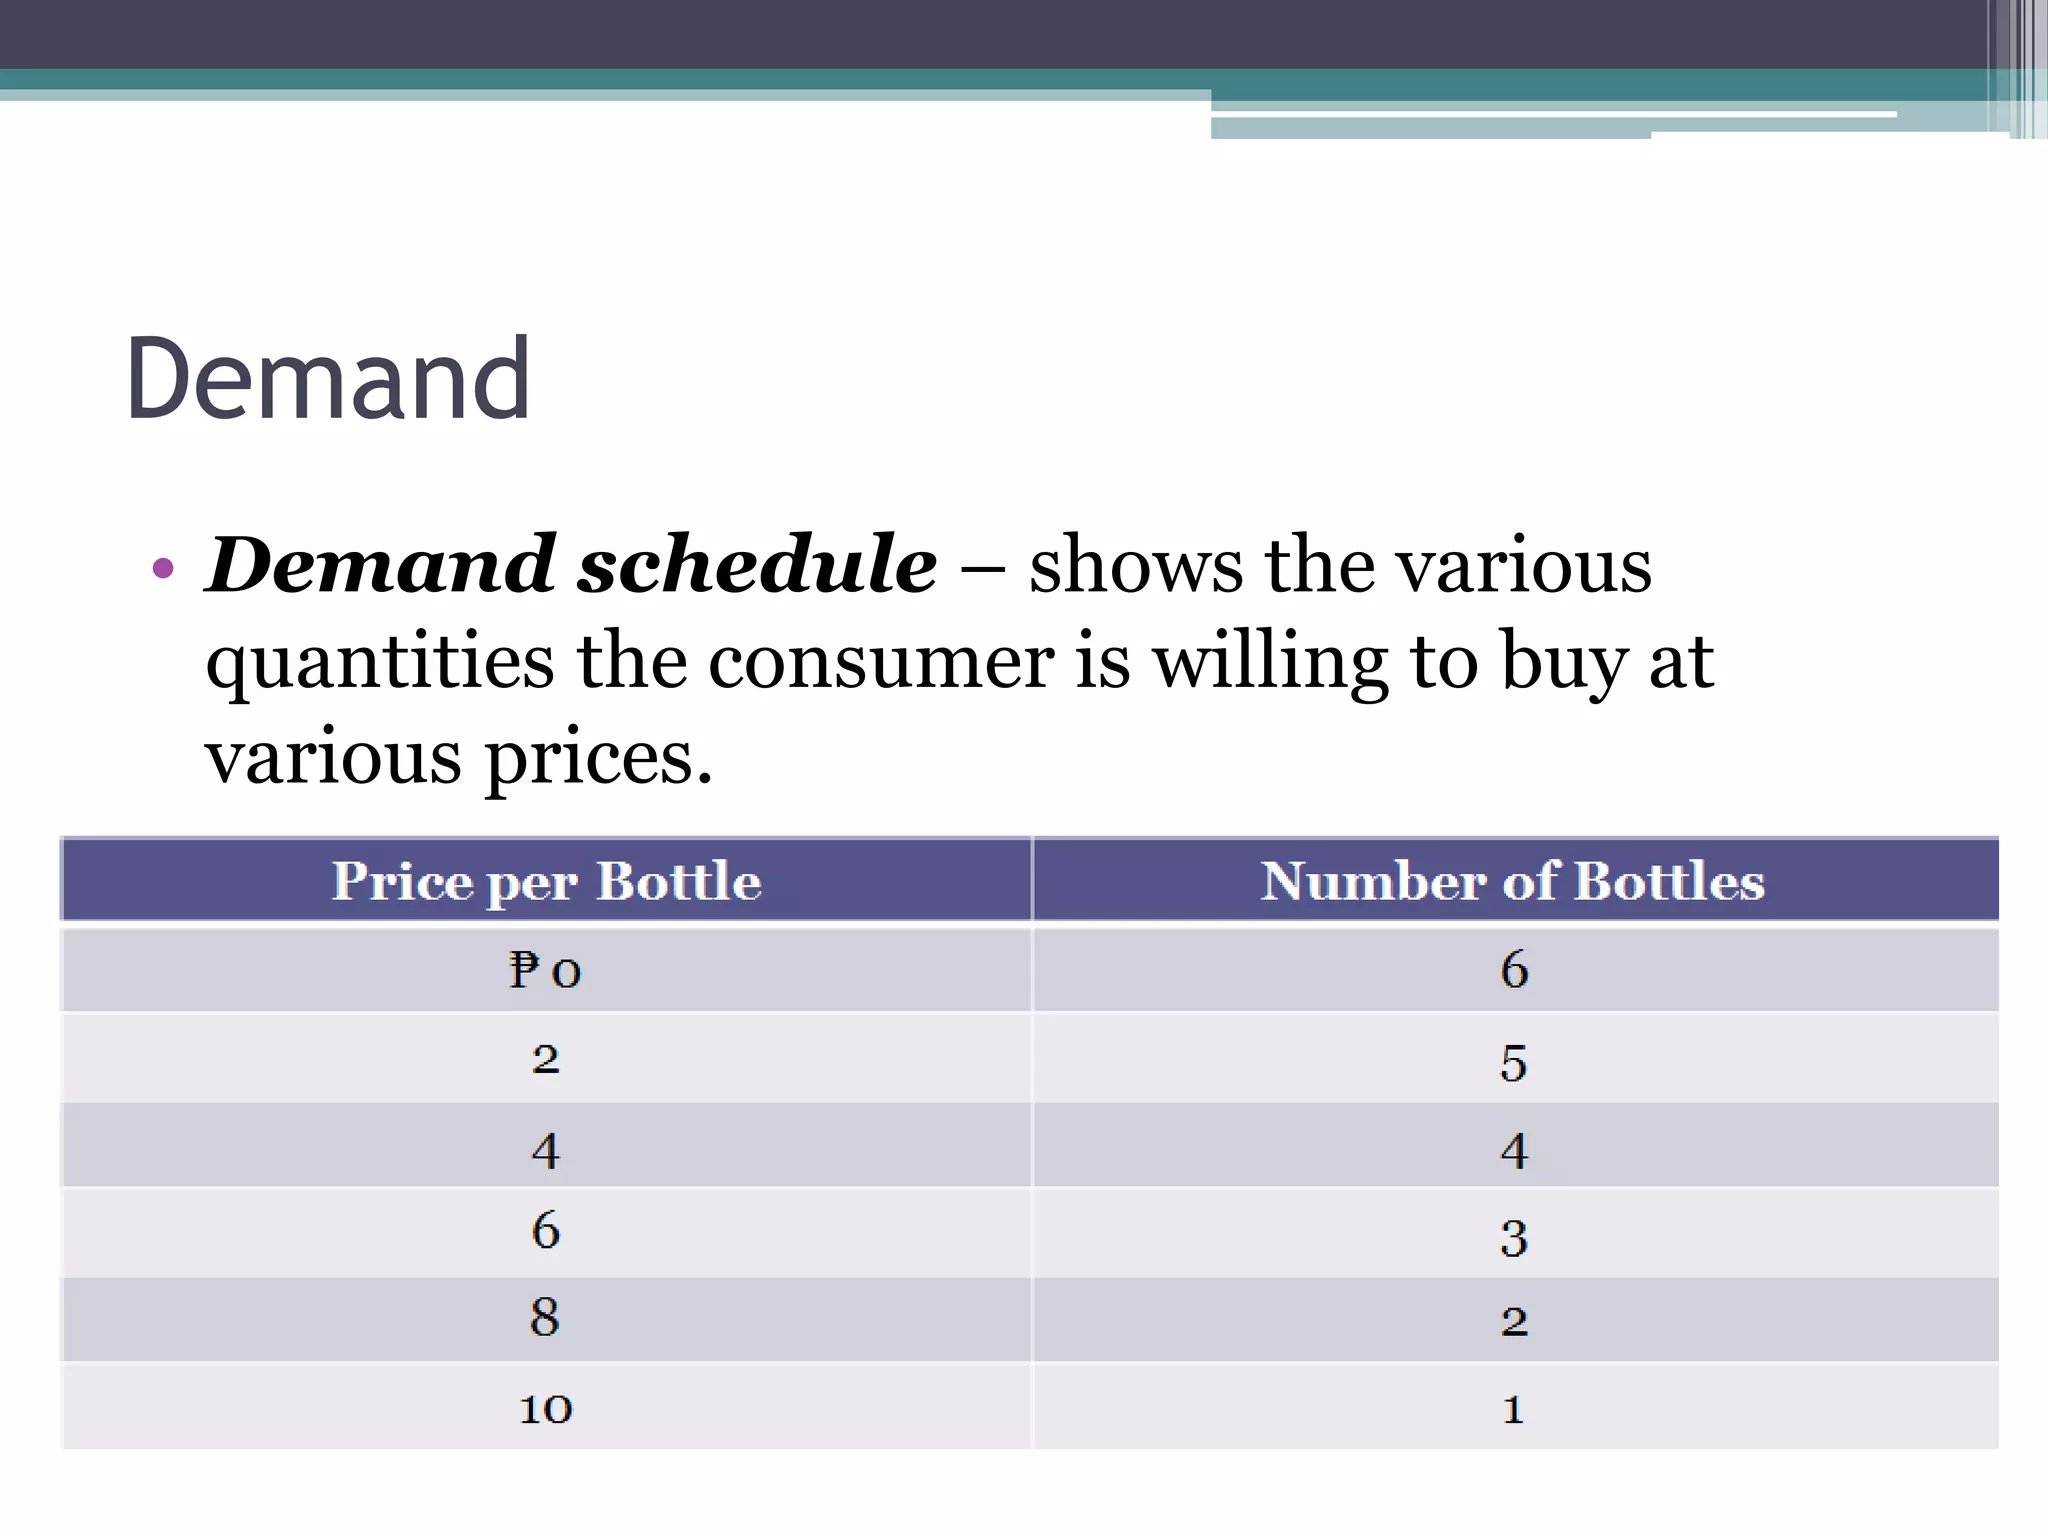
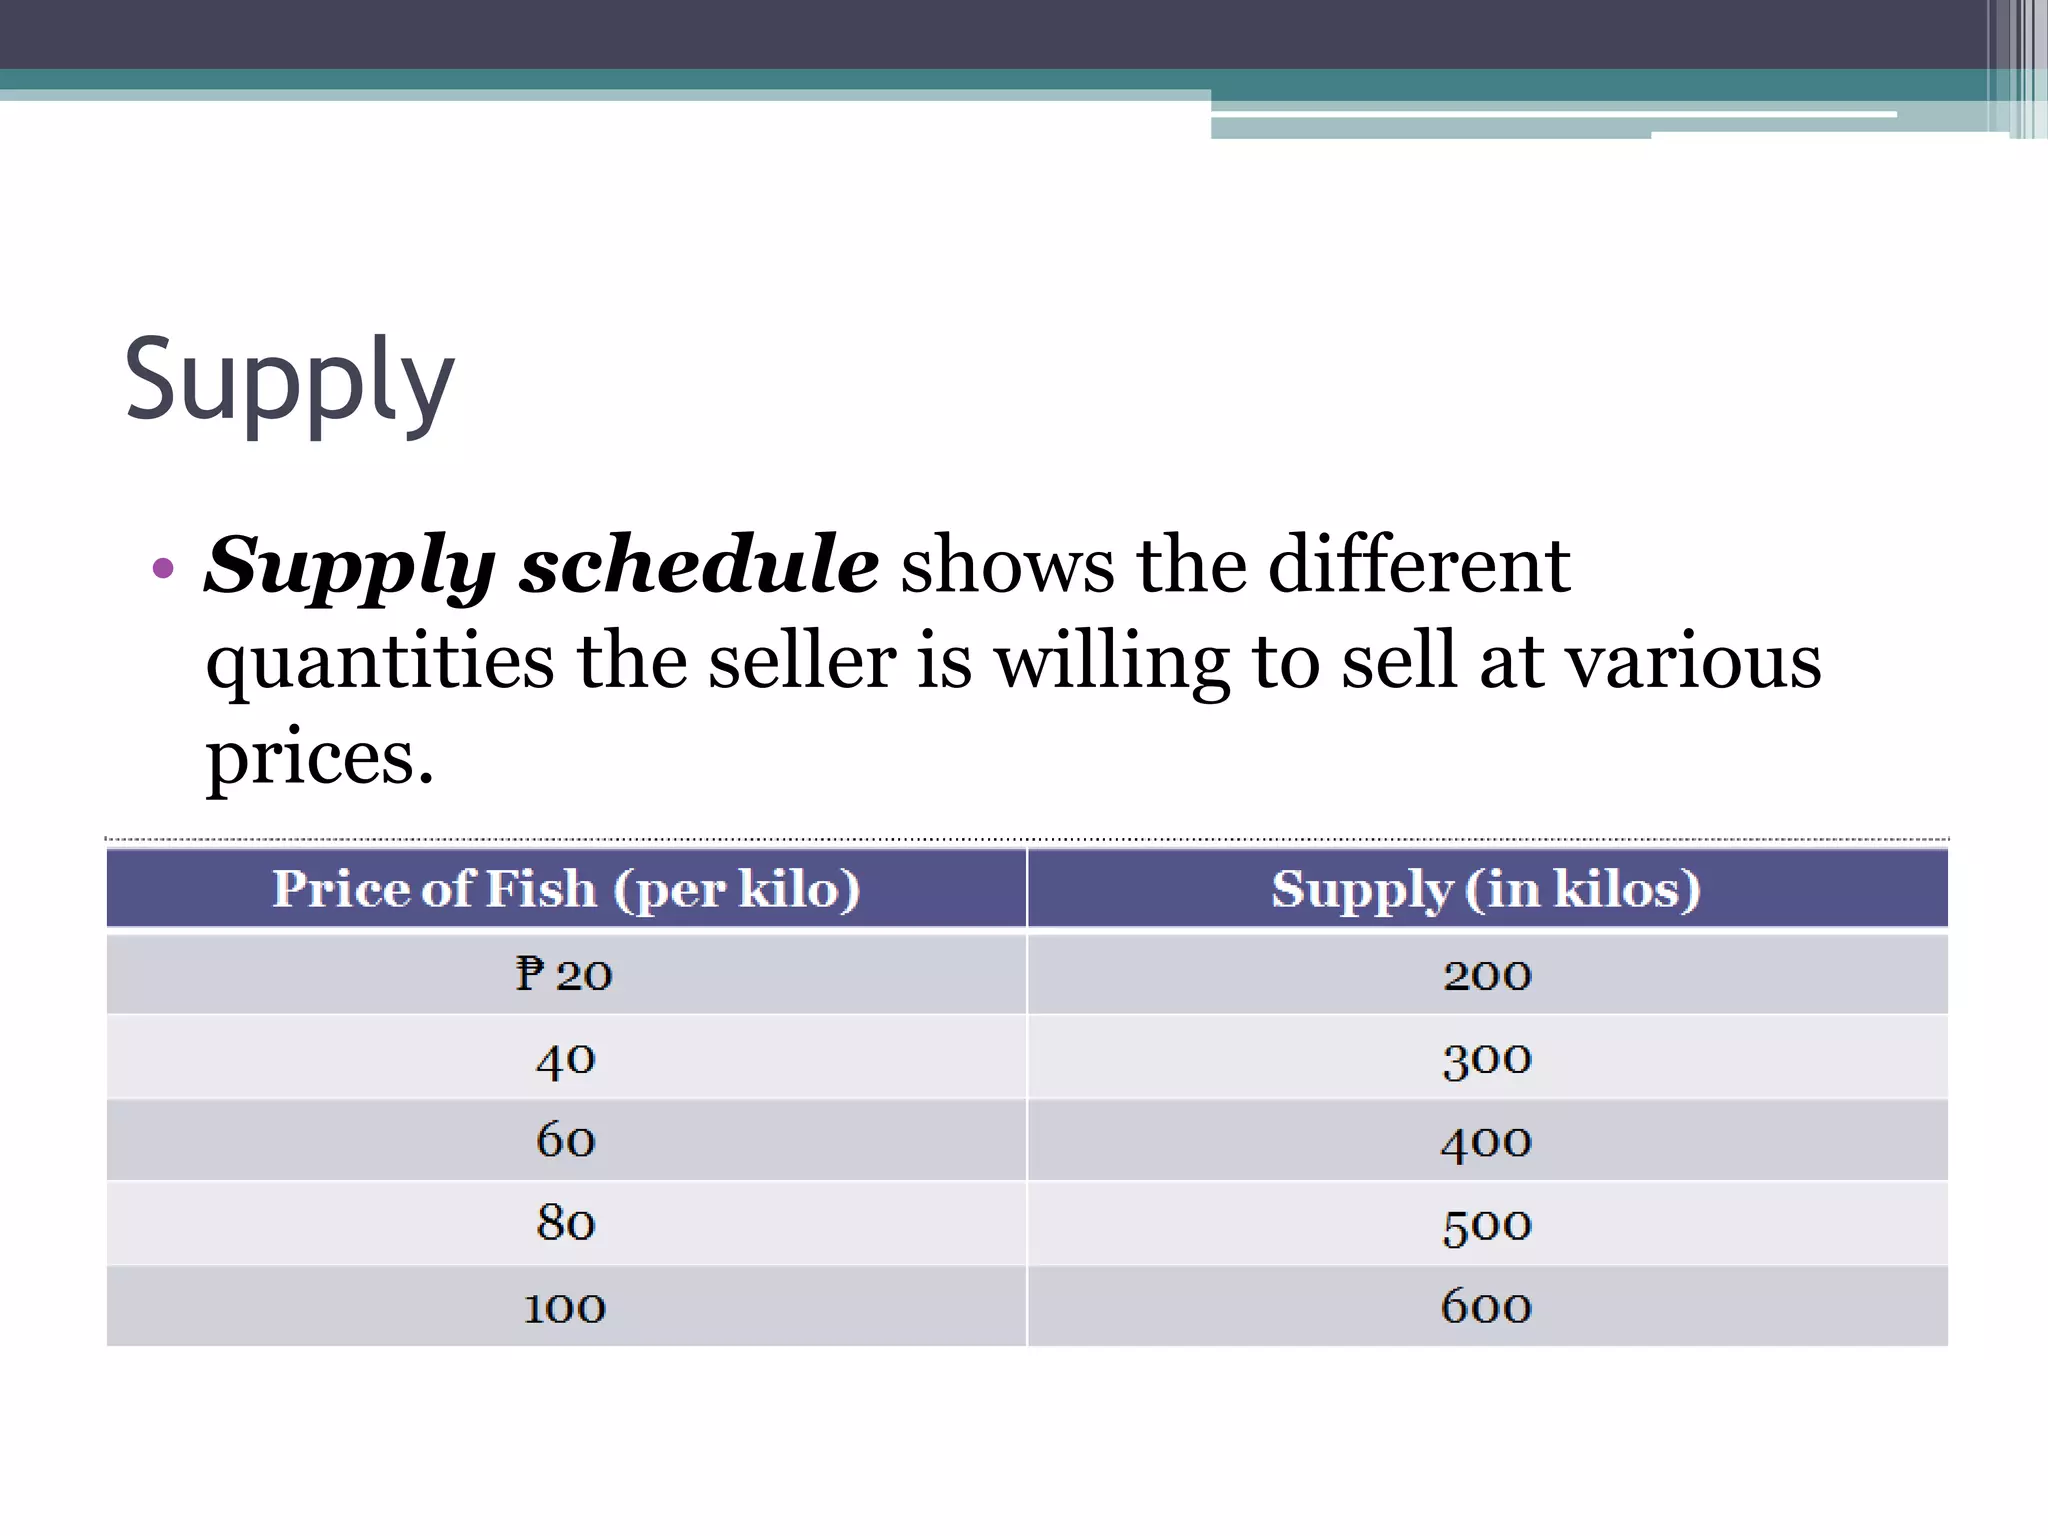
Basic Principles of Demand and
Supply
The Market
• A market is an interaction between buyers and
sellers of trading or exchange.
• It is where the consumer buys and the seller
sells.
▫ Goods market – it is where we buy consumer
goods
▫ Labor market – it is where workers offer
services and look for jobs and where employers
look for workers to hire.
▫ Financial market – includes stock market
where securities of corporations are traded
The Market
• The market is important because it is where a
person who has excess goods can dispose them
to those who need them.
• This interaction should lead to an implicit
agreement between buyers and sellers on
volume and price.
Demand
• Demand is the willingness of a consumer to
buy a commodity at a given price.
Demand
• Demand schedule – shows the various
quantities the consumer is willing to buy at
various prices.
Demand
• Demand function – shows how the quantity
demanded of a good depends on its
determinants, the most important of which is the
price of the good itself, thus the equation:
Qd = f(P)
Demand
• Demand curve – is a graphical illustration of
the demand schedule, with the price measured
on the vertical axis (Y) and the quantity
demanded measured on the horizontal axis (X).
▫ The values are plotted on the graph and are
represented as connected dots to derive the
demand curve.
Demand
Demand
• The downward slope of the curve indicates that
as price increases, the demand for this good
decreases.
• The negative slope of the demand curve is due to
the income and substitution effects.
Demand
• Income effect – it is felt when a change in the
price of a good changes consumer’s real income
or purchasing power, which is the capacity to
buy with a given income.
▫ If a good becomes more expensive, the real
income decreases and the consumer can only buy
less goods and services with the same amount of
money income.
▫ The opposite holds with a decrease in price of a
good and increase in real income.
Demand
• Substitution effect – it is felt when a change
in the price of a good changes the demand due to
alternative consumption of substitute goods.
▫ Lower price encourages consumption away from
higher-priced substitutes on top of buying more
with the budget.
▫ Higher price of a product encourages the
consumption of cheaper substitute further
discouraging demand for the former already
limited by less purchasing power.
The Law of Demand
• Using the assumption “ceteris paribus”
which means all other related variables except
those that are being studied at the moment are
held constant, there is an inverse
relationship between the price of a good
and the quantity demanded for that
good.
The Law of Demand
Non-Price Determinants of Demand
• If the ceteris paribus assumption is dropped,
non-price variables that also affect demand are
now allowed to influence demand.
D = f(P, T, Y, E, PR, NC)
• Factors other than price (P) of the product are
non-price factors of demand.
Non-Price Determinants of Demand
• If consumer income (Y) decreases, the
capacity to buy decreases and the demand will
also decrease even when the price does remain
the same.
▫ The opposite will happen when income increases.
Non-Price Determinants of Demand
• Improved taste (T) for a product will cause a
consumer to buy more of that good even if the
price does not change.
Non-Price Determinants of Demand
• Another non-price determinant is consumer’s
expectation (E) of future price and income.
Consumers tend to anticipate changes in the
price of a good.
Non-Price Determinants of Demand
• Prices of related goods (PR) as substitutes
or complements also determine demand.
▫ Substitute goods are those used in place of each
other like, butter and margarine, and sugar and
artificial sweeteners.
▫ Complements are goods that are used together,
such as cellphone and a sim card, a car and car
tires, and coffee and creamer.
Non-Price Determinants of Demand
• The number of consumers (NC) is also an
important determinant that will affect market
demand of a good.
▫ The higher the population the more consumers
and the higher will be the demand for the good,
and vice versa.
Supply
• Supply refers to the quantity of goods a seller is
willing to offer for sale.
Supply
• Supply schedule shows the different
quantities the seller is willing to sell at various
prices.
Supply
• Supply function shows the dependence of
supply on the various determinants that affect it.
Qs = f(P)
Supply
• Supply curve – graphical representation of the
relationship between the price of the good and
the quantity a seller is willing to sell.
The Law of Supply
• Using the assumption “ceteris paribus” there
is a direct relationship between the price of a
good and the quantity supplied of that good.
Non-price Determinants of Supply
• If the ceteris paribus assumption is dropped,
non-price variables are allowed to influence
supply.
S = f(P, C, T, AR)
• Factors other than price (P) of the product are
non-price factors of supply.
Non-price Determinants of Supply
• The cost of production (C) refers to the
expenses incurred to produce a good.
▫ An increase in cost will normally result in a lower
supply of good even when price will not change
since the producer has to shell out more money to
come up with the same amount of output.
Non-price Determinants of Supply
• The use of improved technology (T) in the
production of a good will result in the increased
supply of that good.
▫ On the other hand, the use of obsolete technology
in production will result in a decrease of supply of
that good.
Non-price Determinants of Supply
• Another possible non-price determinant of
supply that can cause a shift in the supply curve
is through improved availability of raw
materials and resources (AR).
▫ Since more resources can be used to produce a
bigger output of the good, then supply increases.
Questions???
29

2. BASIC PRINCIPLES OF DEMAND AND SUPPLY.pptx

  • 1.
    Basic Principles ofDemand and Supply
  • 2.
    The Market • Amarket is an interaction between buyers and sellers of trading or exchange. • It is where the consumer buys and the seller sells. ▫ Goods market – it is where we buy consumer goods ▫ Labor market – it is where workers offer services and look for jobs and where employers look for workers to hire. ▫ Financial market – includes stock market where securities of corporations are traded
  • 3.
    The Market • Themarket is important because it is where a person who has excess goods can dispose them to those who need them. • This interaction should lead to an implicit agreement between buyers and sellers on volume and price.
  • 4.
    Demand • Demand isthe willingness of a consumer to buy a commodity at a given price.
  • 5.
    Demand • Demand schedule– shows the various quantities the consumer is willing to buy at various prices.
  • 6.
    Demand • Demand function– shows how the quantity demanded of a good depends on its determinants, the most important of which is the price of the good itself, thus the equation: Qd = f(P)
  • 7.
    Demand • Demand curve– is a graphical illustration of the demand schedule, with the price measured on the vertical axis (Y) and the quantity demanded measured on the horizontal axis (X). ▫ The values are plotted on the graph and are represented as connected dots to derive the demand curve.
  • 8.
  • 9.
    Demand • The downwardslope of the curve indicates that as price increases, the demand for this good decreases. • The negative slope of the demand curve is due to the income and substitution effects.
  • 10.
    Demand • Income effect– it is felt when a change in the price of a good changes consumer’s real income or purchasing power, which is the capacity to buy with a given income. ▫ If a good becomes more expensive, the real income decreases and the consumer can only buy less goods and services with the same amount of money income. ▫ The opposite holds with a decrease in price of a good and increase in real income.
  • 11.
    Demand • Substitution effect– it is felt when a change in the price of a good changes the demand due to alternative consumption of substitute goods. ▫ Lower price encourages consumption away from higher-priced substitutes on top of buying more with the budget. ▫ Higher price of a product encourages the consumption of cheaper substitute further discouraging demand for the former already limited by less purchasing power.
  • 12.
    The Law ofDemand • Using the assumption “ceteris paribus” which means all other related variables except those that are being studied at the moment are held constant, there is an inverse relationship between the price of a good and the quantity demanded for that good.
  • 13.
    The Law ofDemand
  • 14.
    Non-Price Determinants ofDemand • If the ceteris paribus assumption is dropped, non-price variables that also affect demand are now allowed to influence demand. D = f(P, T, Y, E, PR, NC) • Factors other than price (P) of the product are non-price factors of demand.
  • 15.
    Non-Price Determinants ofDemand • If consumer income (Y) decreases, the capacity to buy decreases and the demand will also decrease even when the price does remain the same. ▫ The opposite will happen when income increases.
  • 16.
    Non-Price Determinants ofDemand • Improved taste (T) for a product will cause a consumer to buy more of that good even if the price does not change.
  • 17.
    Non-Price Determinants ofDemand • Another non-price determinant is consumer’s expectation (E) of future price and income. Consumers tend to anticipate changes in the price of a good.
  • 18.
    Non-Price Determinants ofDemand • Prices of related goods (PR) as substitutes or complements also determine demand. ▫ Substitute goods are those used in place of each other like, butter and margarine, and sugar and artificial sweeteners. ▫ Complements are goods that are used together, such as cellphone and a sim card, a car and car tires, and coffee and creamer.
  • 19.
    Non-Price Determinants ofDemand • The number of consumers (NC) is also an important determinant that will affect market demand of a good. ▫ The higher the population the more consumers and the higher will be the demand for the good, and vice versa.
  • 20.
    Supply • Supply refersto the quantity of goods a seller is willing to offer for sale.
  • 21.
    Supply • Supply scheduleshows the different quantities the seller is willing to sell at various prices.
  • 22.
    Supply • Supply functionshows the dependence of supply on the various determinants that affect it. Qs = f(P)
  • 23.
    Supply • Supply curve– graphical representation of the relationship between the price of the good and the quantity a seller is willing to sell.
  • 24.
    The Law ofSupply • Using the assumption “ceteris paribus” there is a direct relationship between the price of a good and the quantity supplied of that good.
  • 25.
    Non-price Determinants ofSupply • If the ceteris paribus assumption is dropped, non-price variables are allowed to influence supply. S = f(P, C, T, AR) • Factors other than price (P) of the product are non-price factors of supply.
  • 26.
    Non-price Determinants ofSupply • The cost of production (C) refers to the expenses incurred to produce a good. ▫ An increase in cost will normally result in a lower supply of good even when price will not change since the producer has to shell out more money to come up with the same amount of output.
  • 27.
    Non-price Determinants ofSupply • The use of improved technology (T) in the production of a good will result in the increased supply of that good. ▫ On the other hand, the use of obsolete technology in production will result in a decrease of supply of that good.
  • 28.
    Non-price Determinants ofSupply • Another possible non-price determinant of supply that can cause a shift in the supply curve is through improved availability of raw materials and resources (AR). ▫ Since more resources can be used to produce a bigger output of the good, then supply increases.
  • 29.