Downloaded 942 times
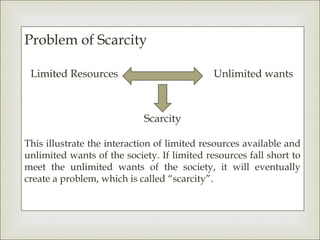
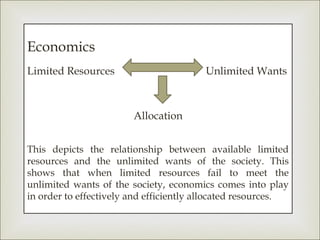


The document discusses the concept of scarcity in economics. It defines scarcity as limited resources being unable to meet unlimited wants, creating an economic problem. Economics is then presented as the study of allocating scarce resources efficiently to meet wants. The relationship between scarcity and economics is explored, with scarcity giving rise to the need for economics to address this issue through resource allocation. Key terms like demand, supply, and markets are also introduced in the summary.


