Applied economics uses economic theories and methods to analyze real-world issues and inform decision-making. It involves answering questions about economic problems, their causes, and potential solutions. Microeconomics analyzes the decisions of individuals and firms, while macroeconomics analyzes whole markets and the overall economy. Economists use both qualitative and quantitative analysis as well as models, theories, and assumptions to study economic phenomena.
APPLY IT INREAL LIFE
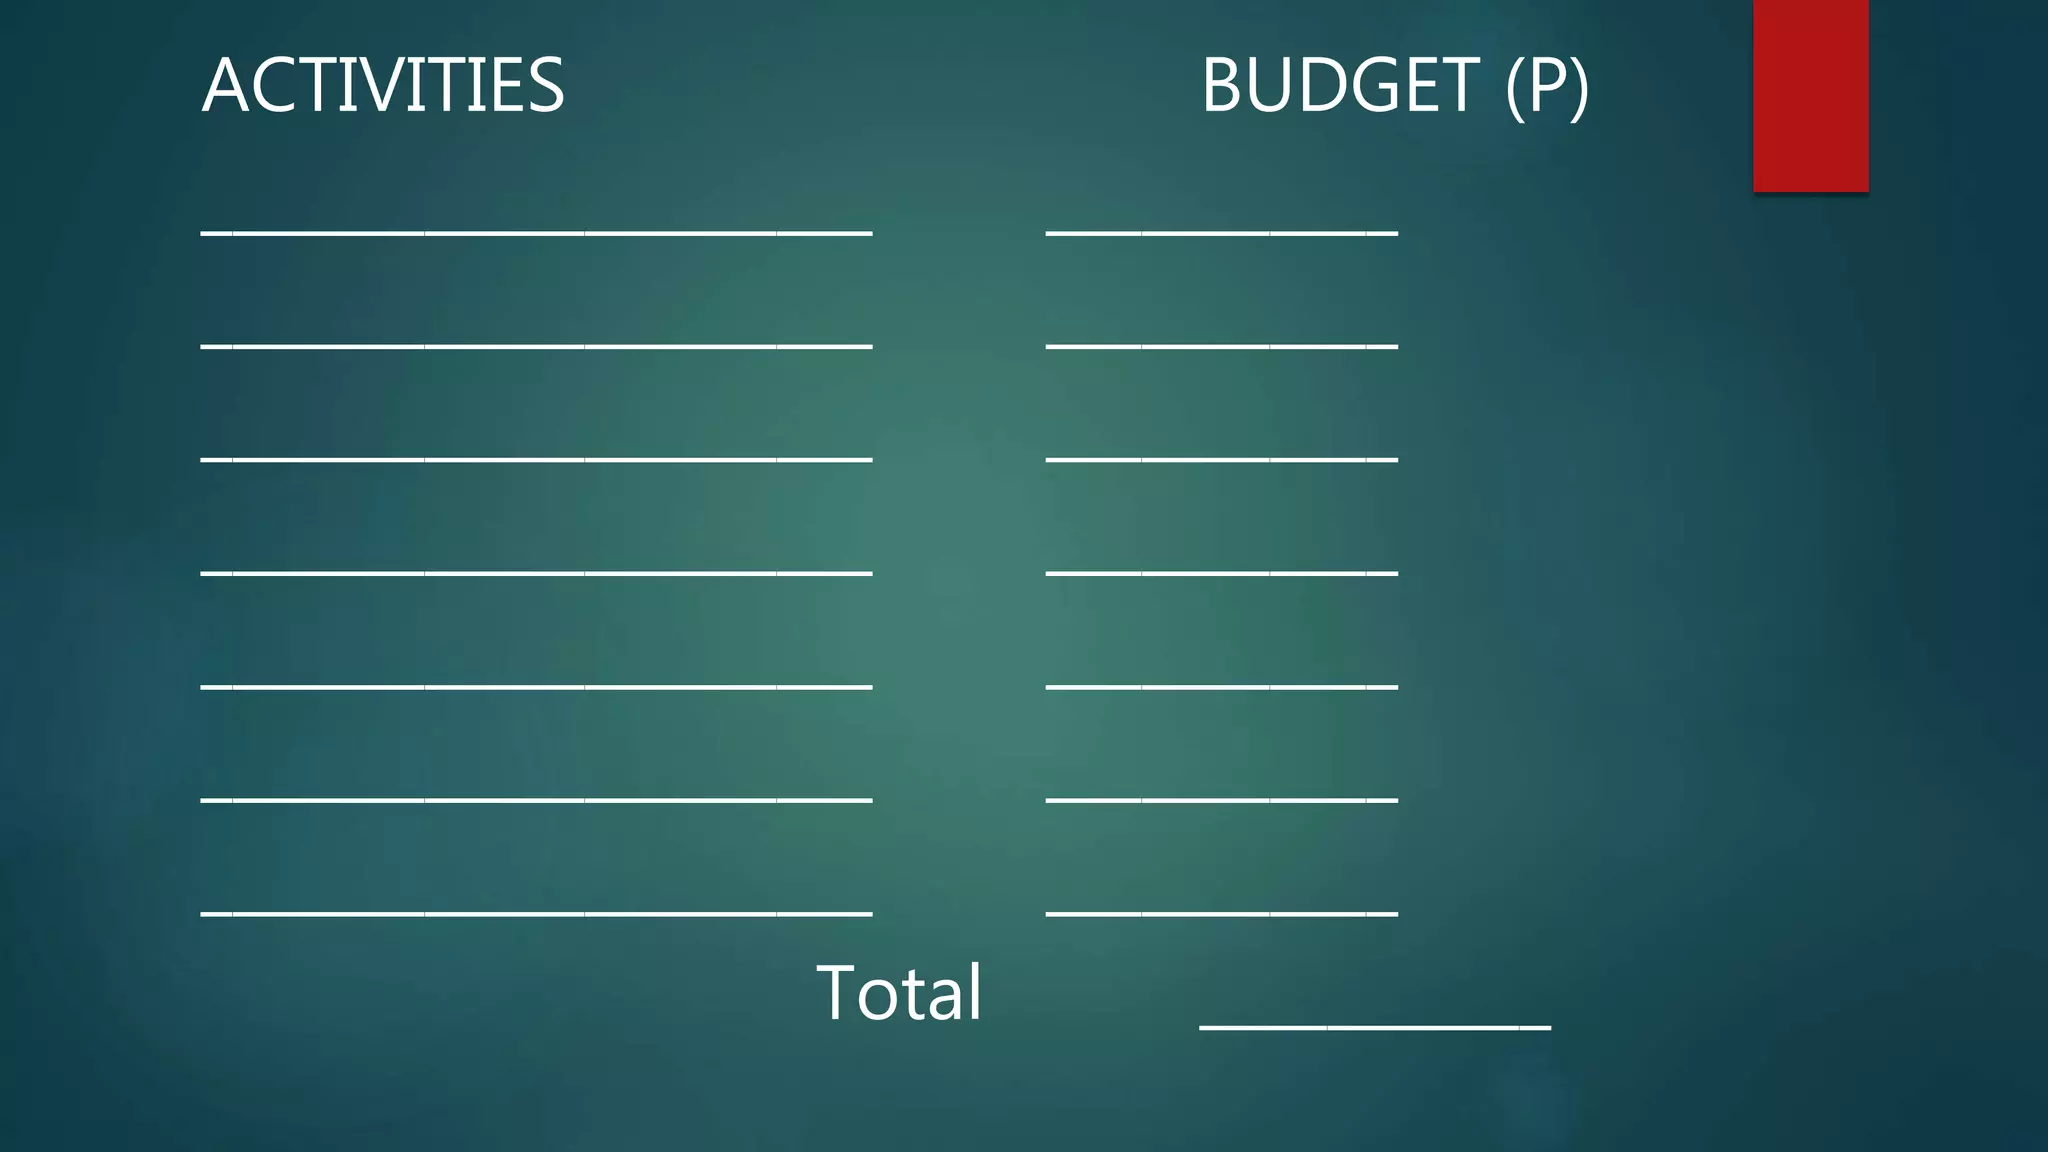
You are an event coordinator and your sister asked you to
organize your nephew’s upcoming 4th birthday party. You
were given a budget of P10,000.00. At least 30 friends and
family members are expected to attend the party. How are
you going to use the money? What food do you plan to
serve? What activities do you plan to include? List the
activities and the budget allocation on the next page. You will
present your plan to your sister for recommendation and
approval.
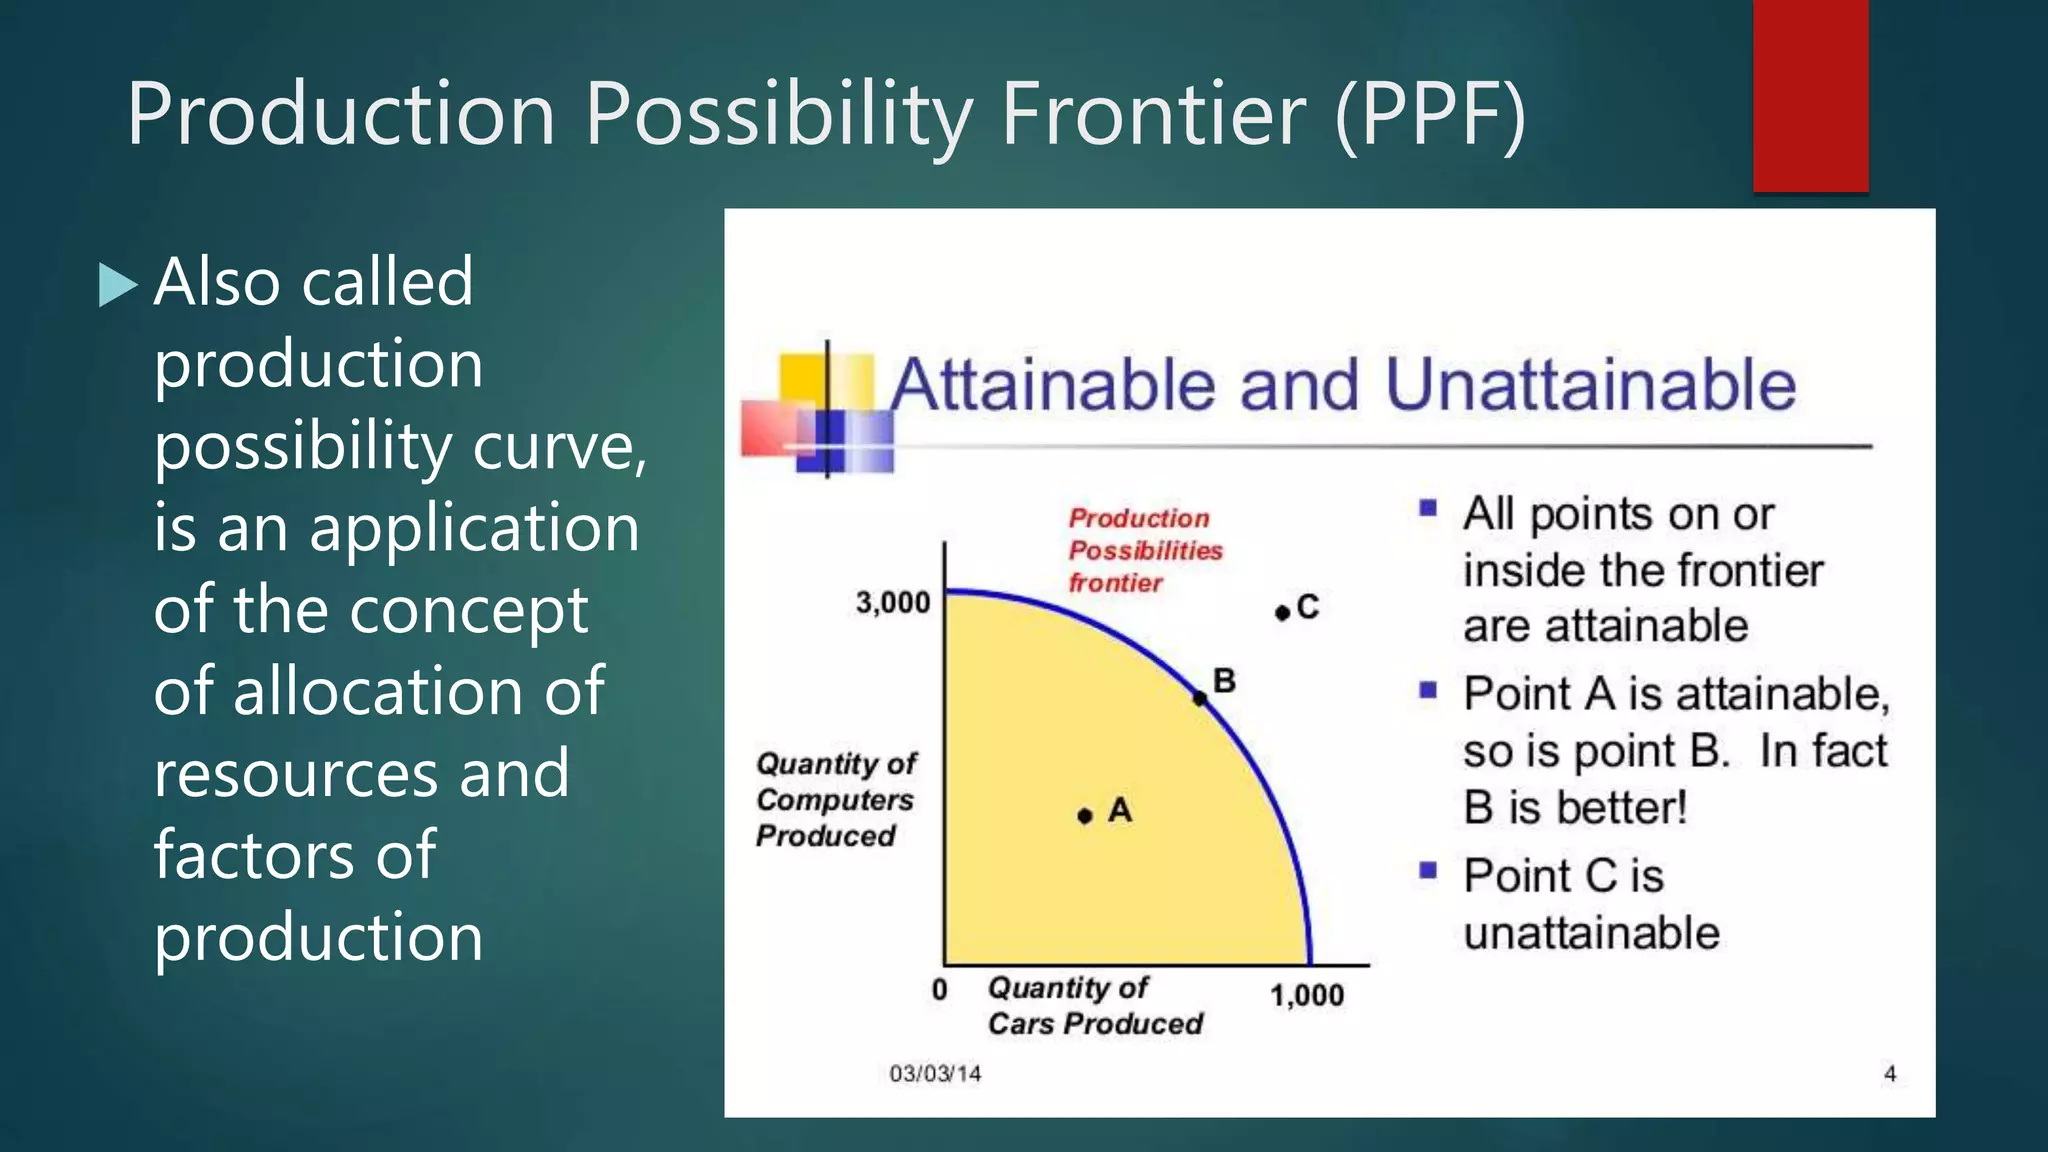
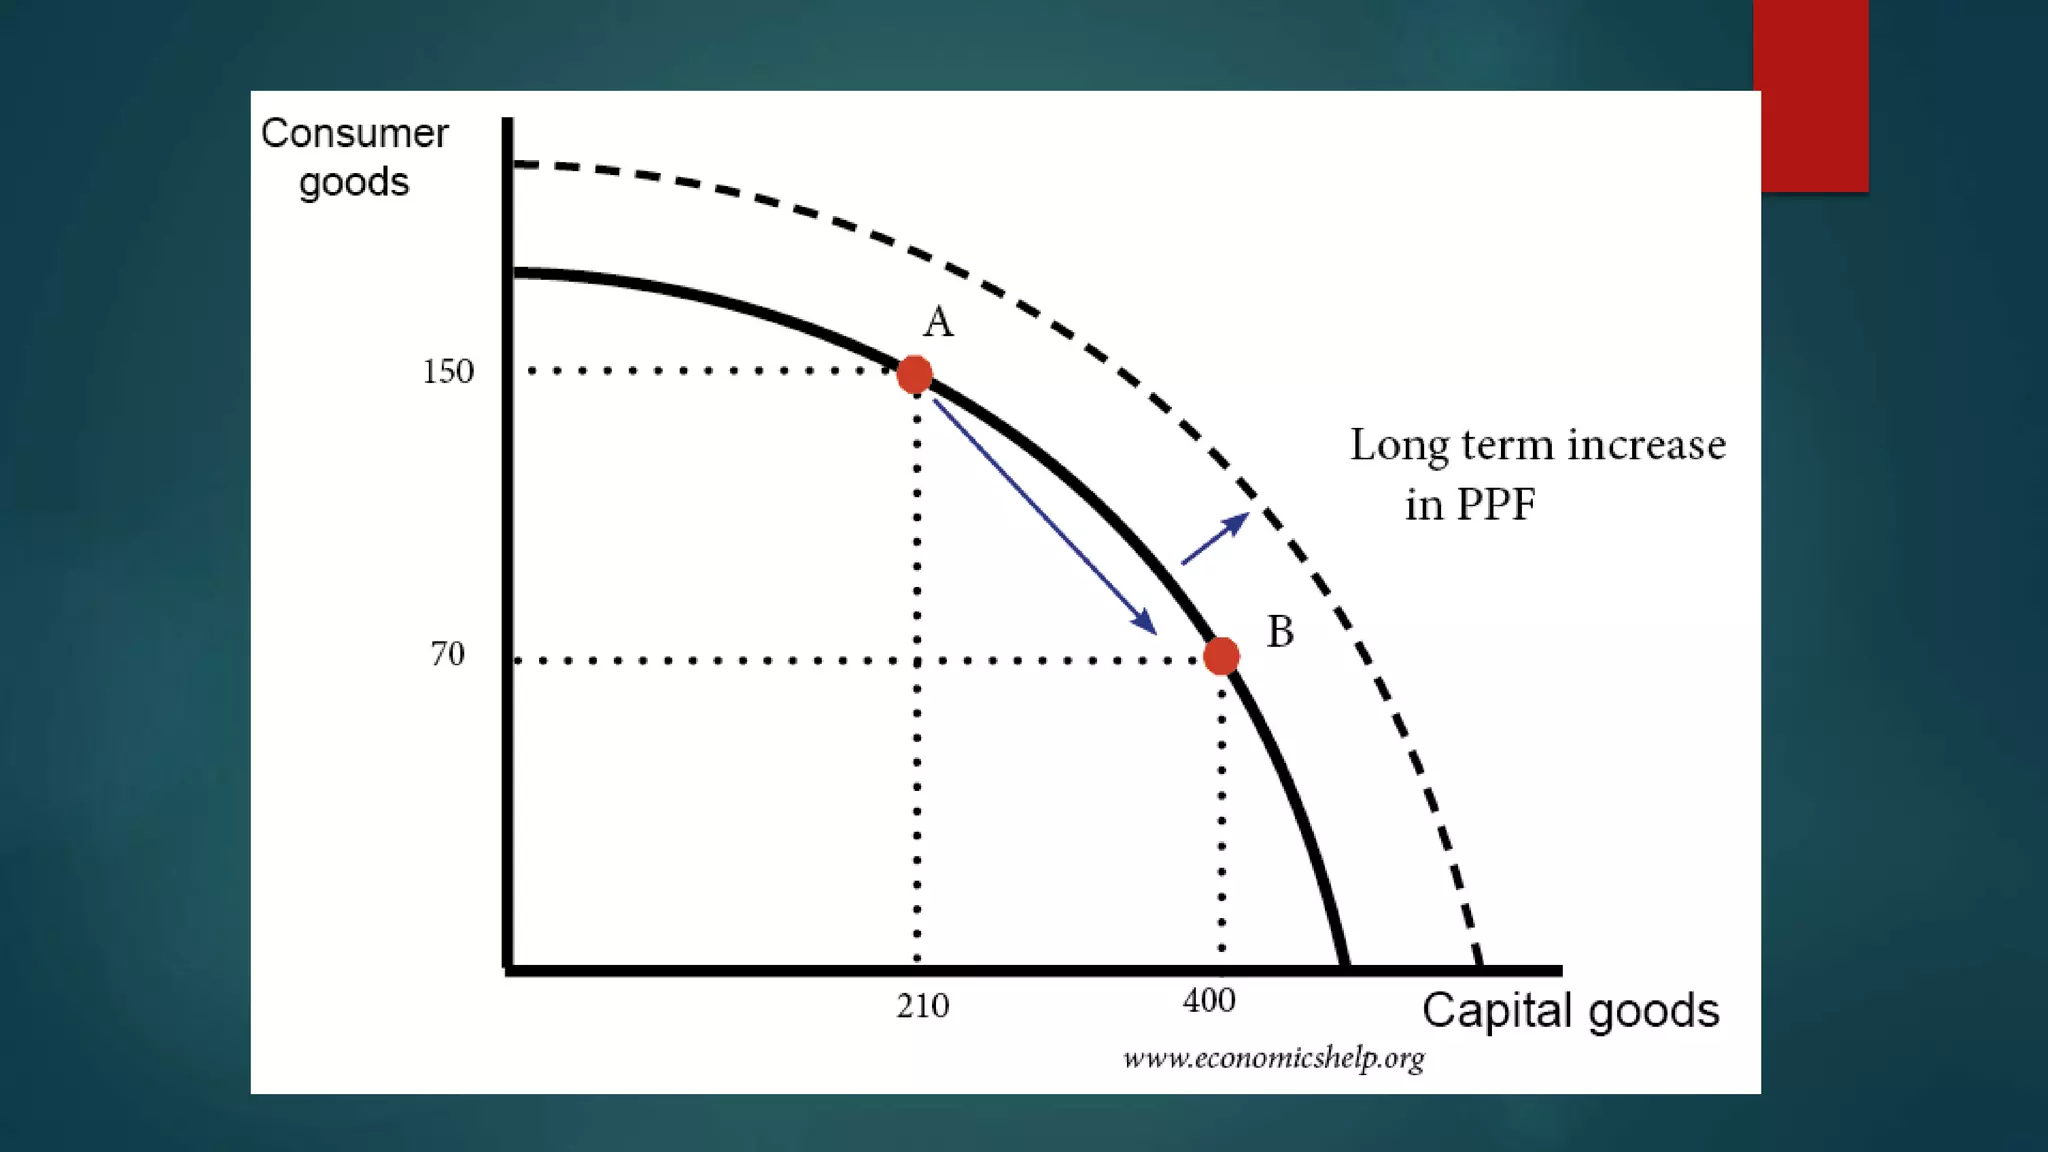
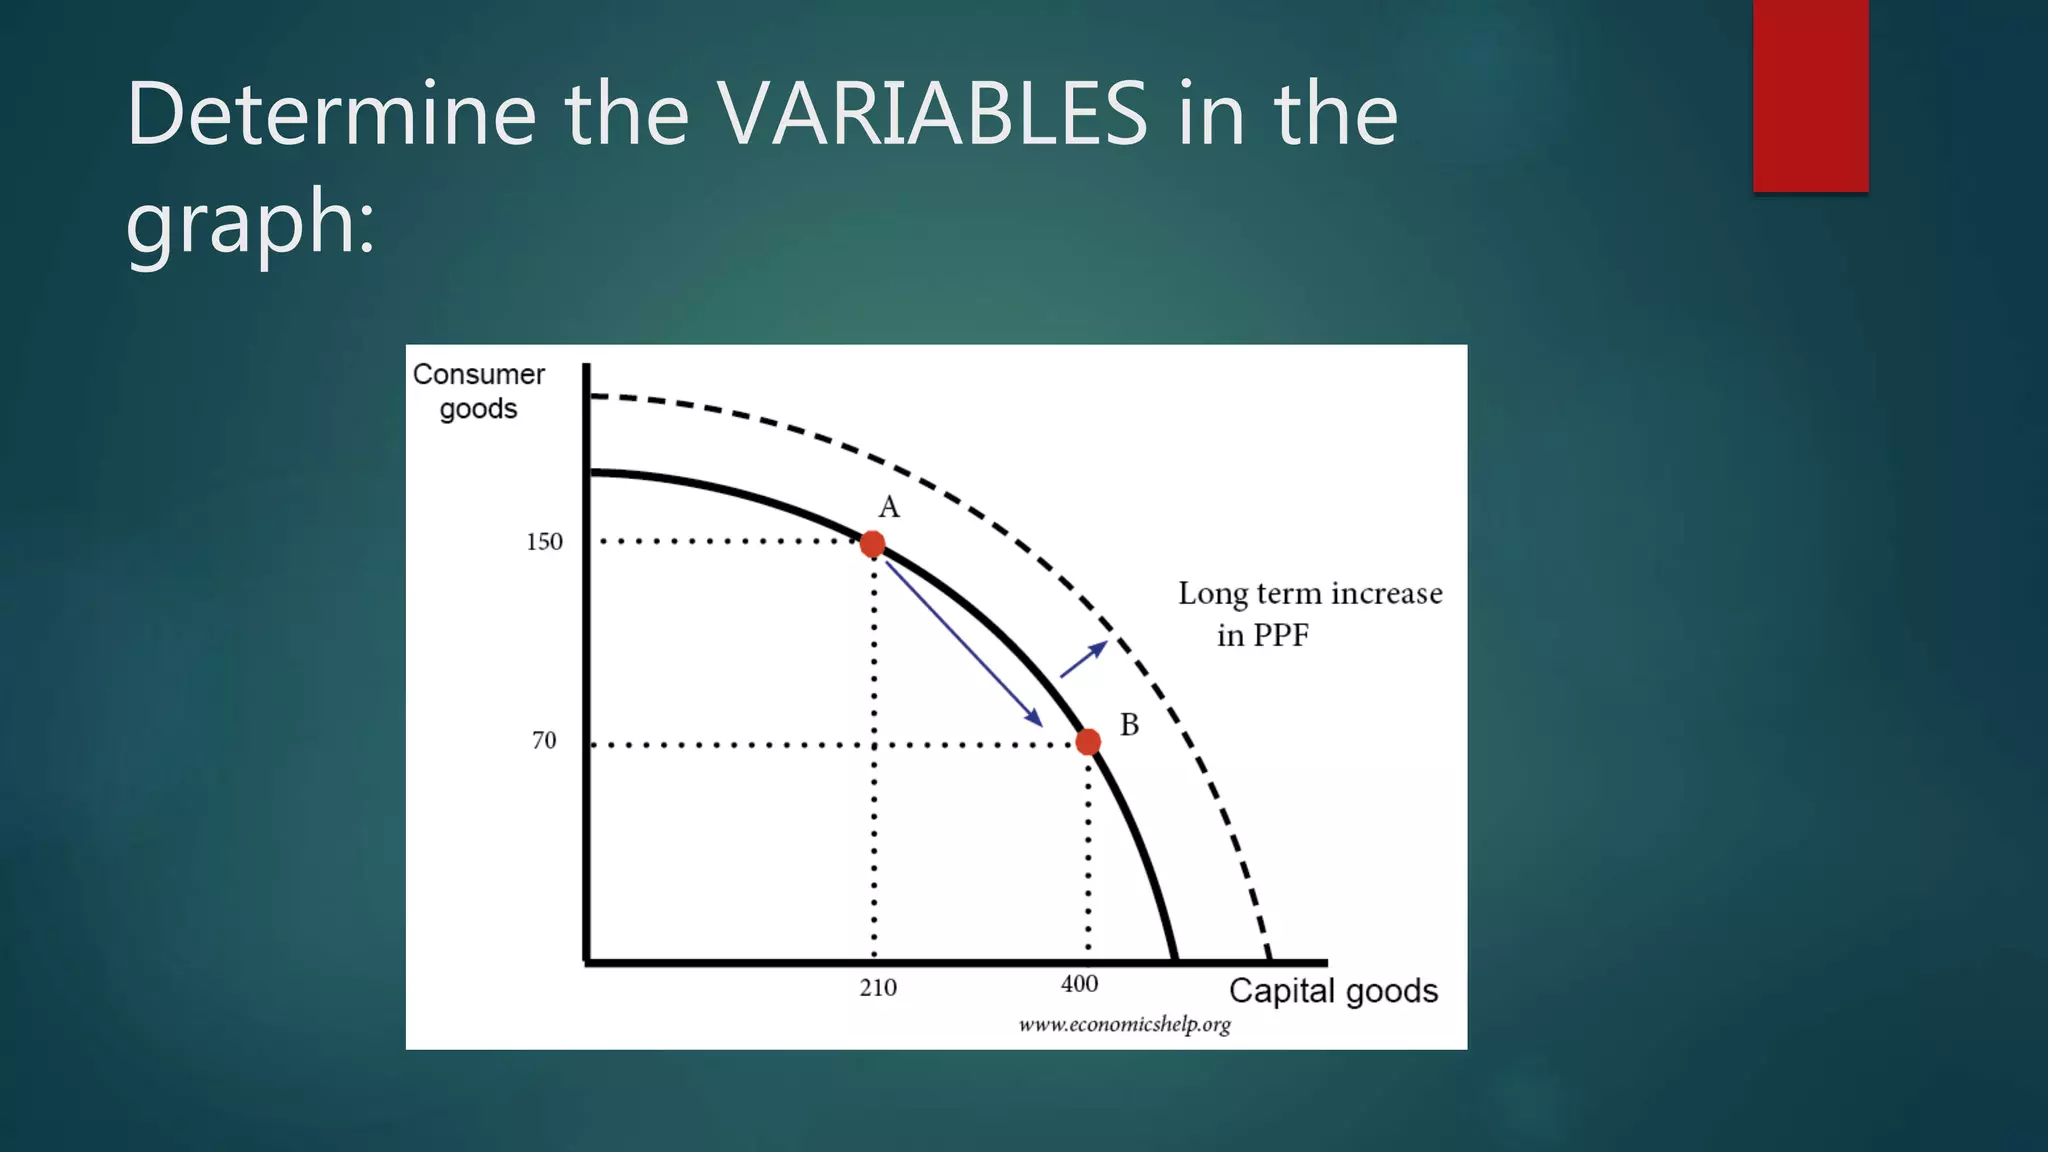
Production Possibility Frontier(PPF)
Also called
production
possibility curve,
is an application
of the concept
of allocation of
resources and
factors of
production
14.
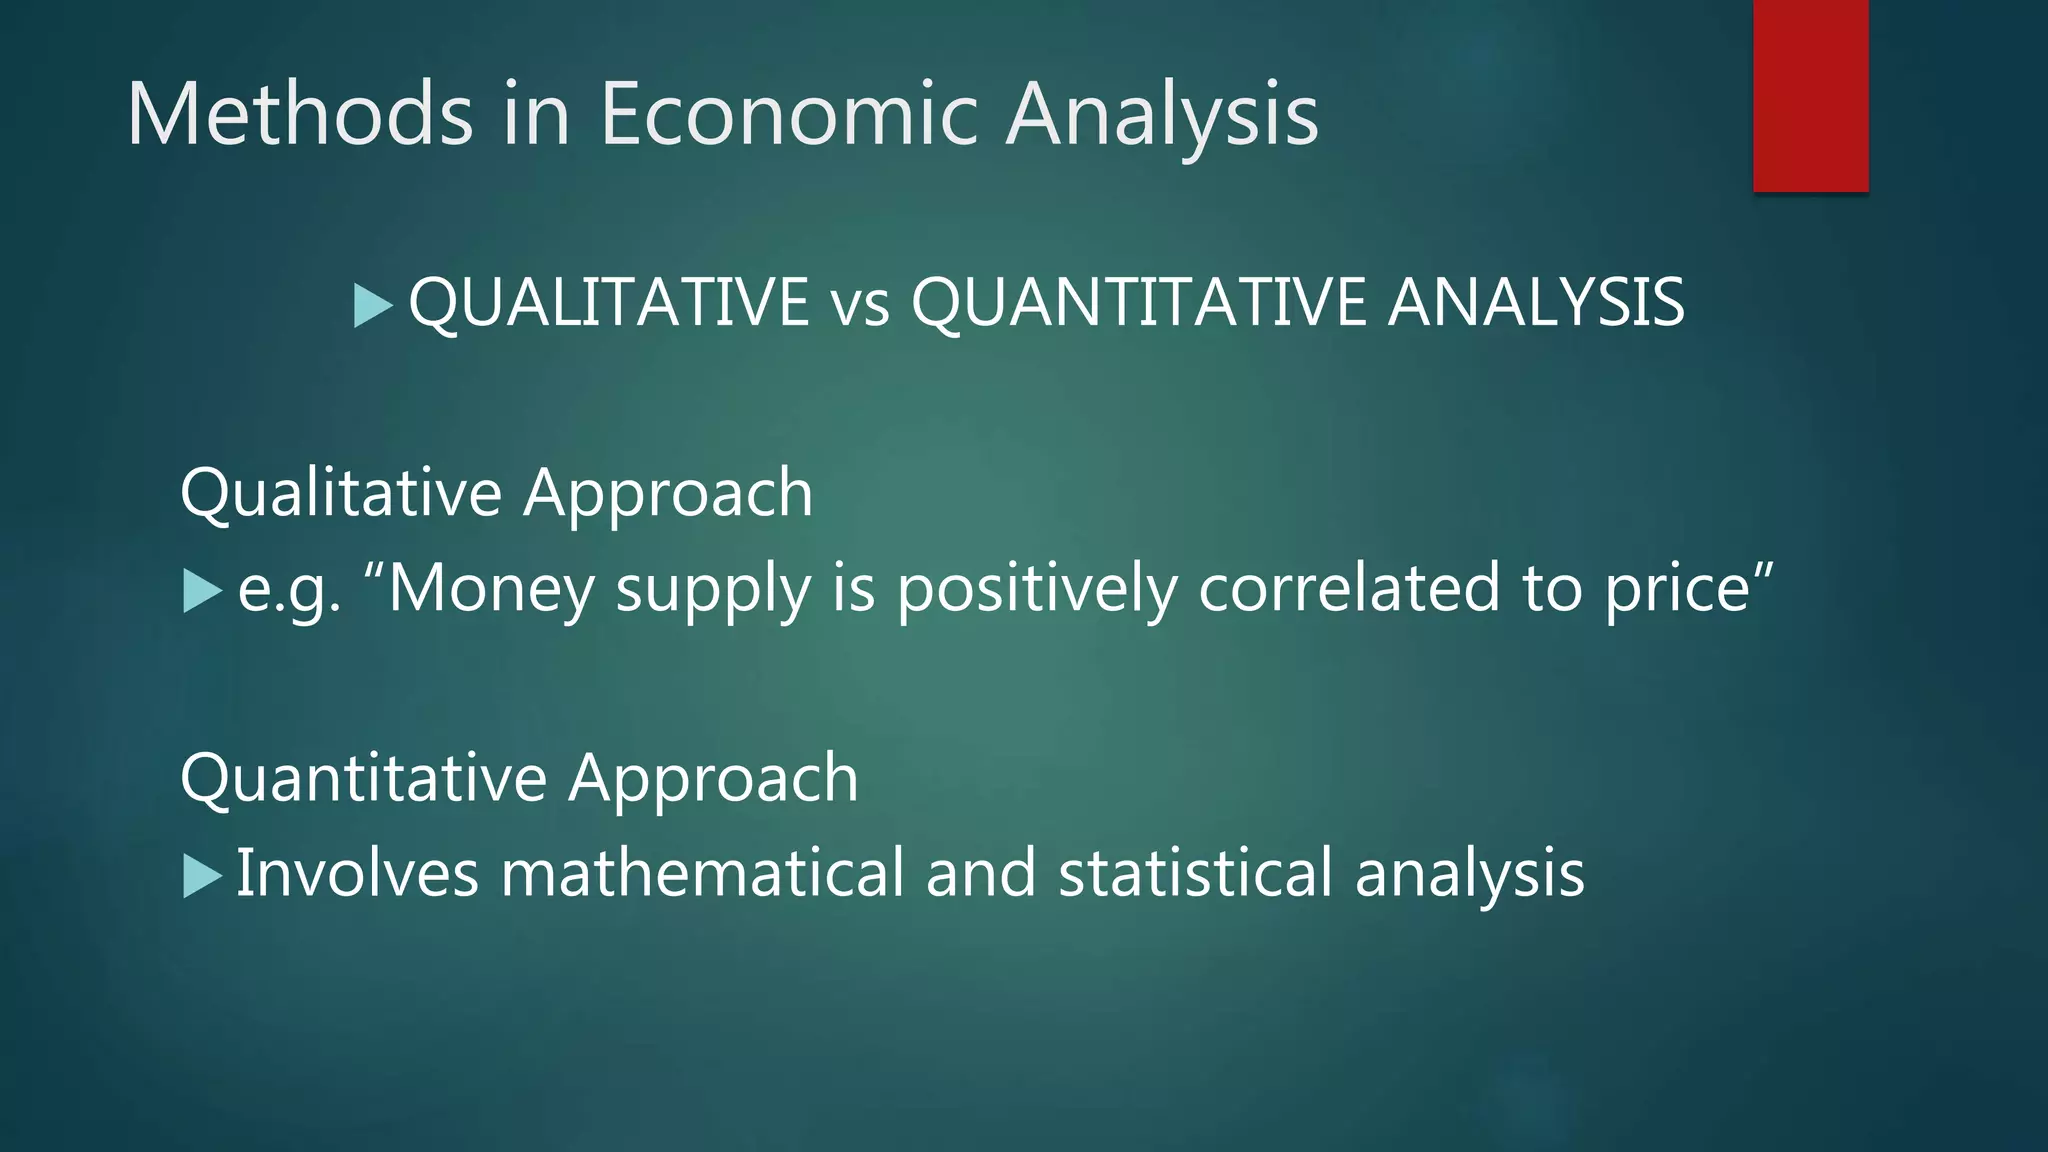
Methods in EconomicAnalysis
QUALITATIVE vs QUANTITATIVE ANALYSIS
Qualitative Approach
e.g. “Money supply is positively correlated to price”
Quantitative Approach
Involves mathematical and statistical analysis
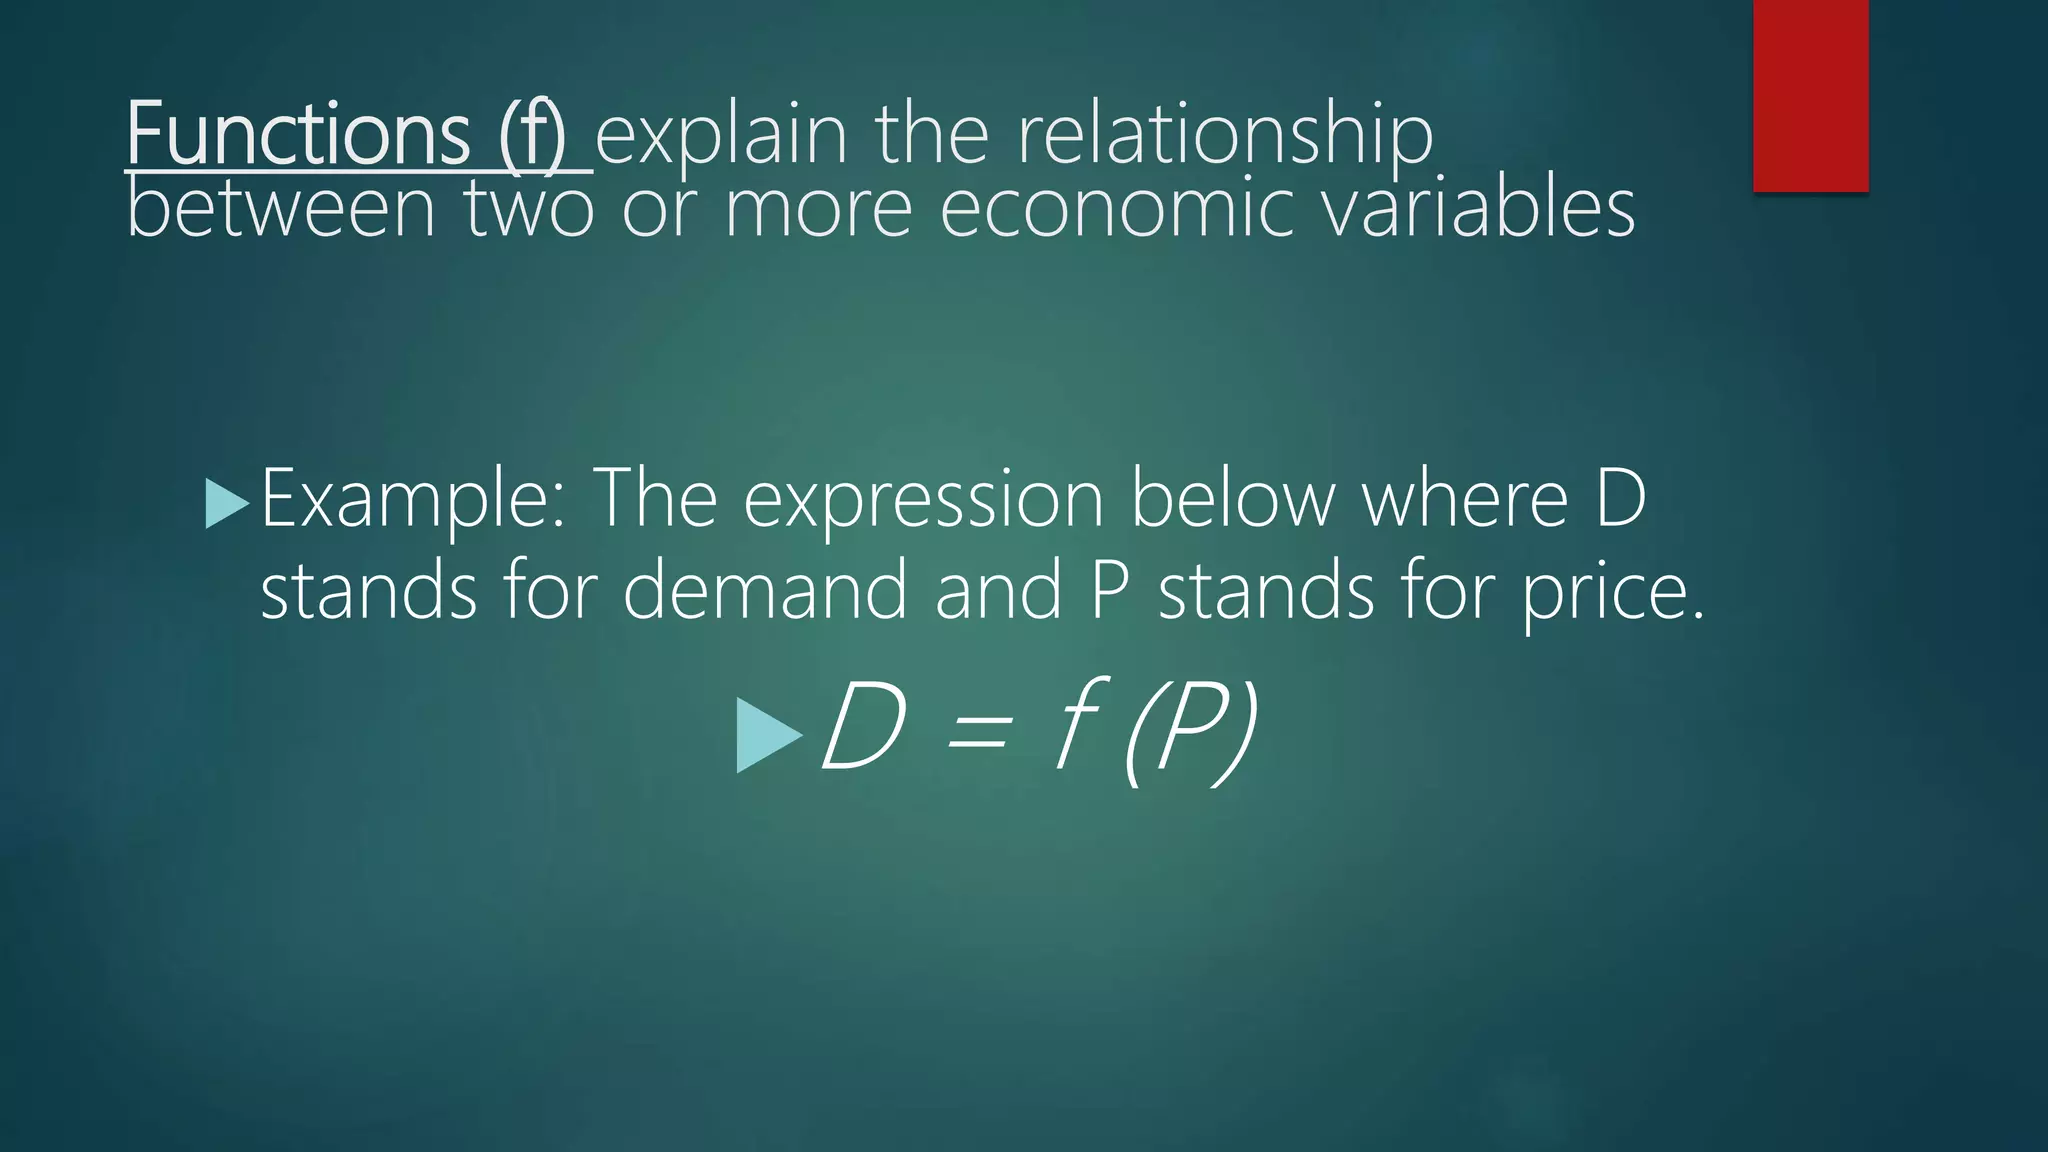
Functions (f) explainthe relationship
between two or more economic variables
Example: The expression below where D
stands for demand and P stands for price.
D = f (P)
17.
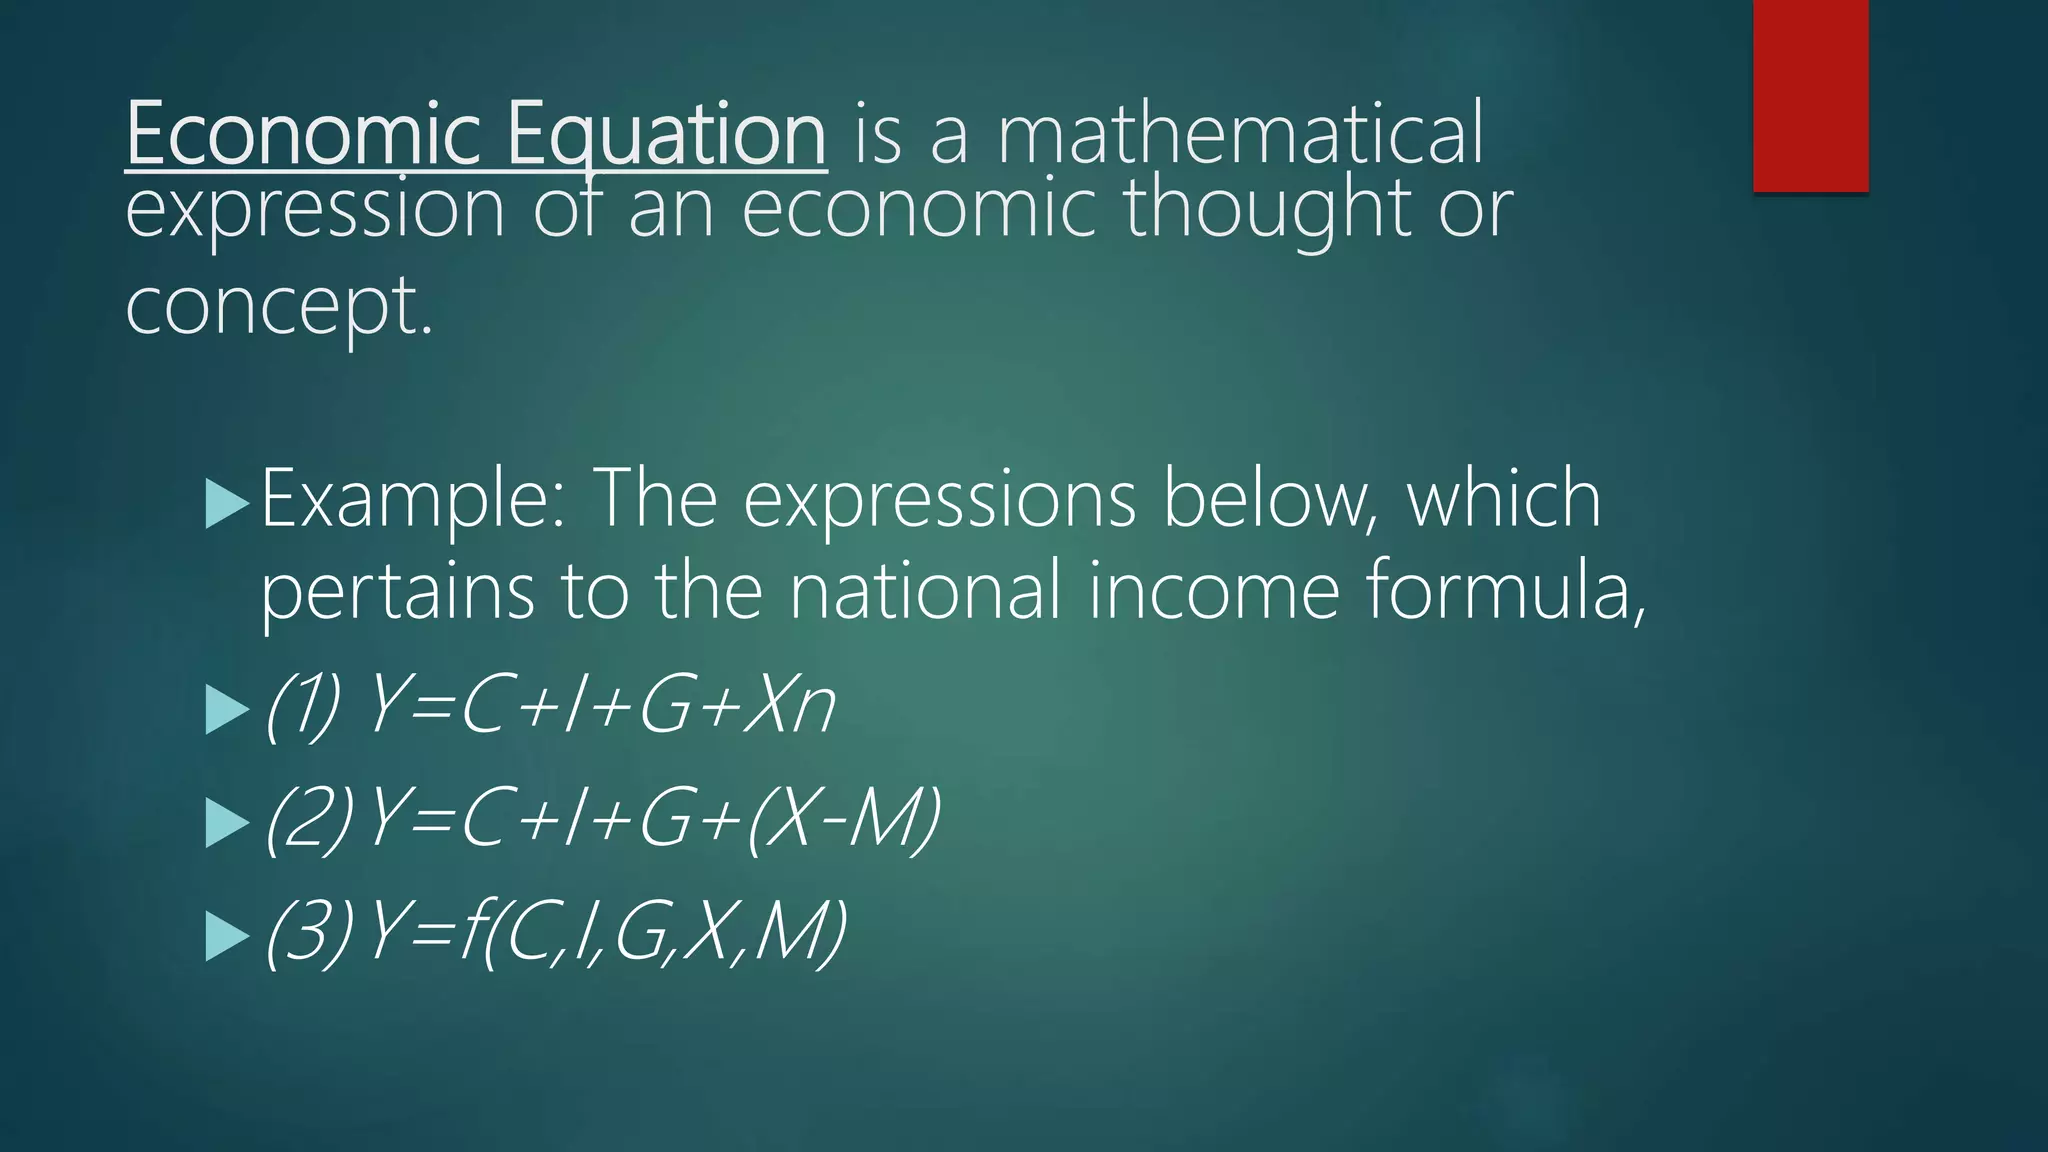
Economic Equation isa mathematical
expression of an economic thought or
concept.
Example: The expressions below, which
pertains to the national income formula,
(1) Y=C+I+G+Xn
(2)Y=C+I+G+(X-M)
(3)Y=f(C,I,G,X,M)
18.
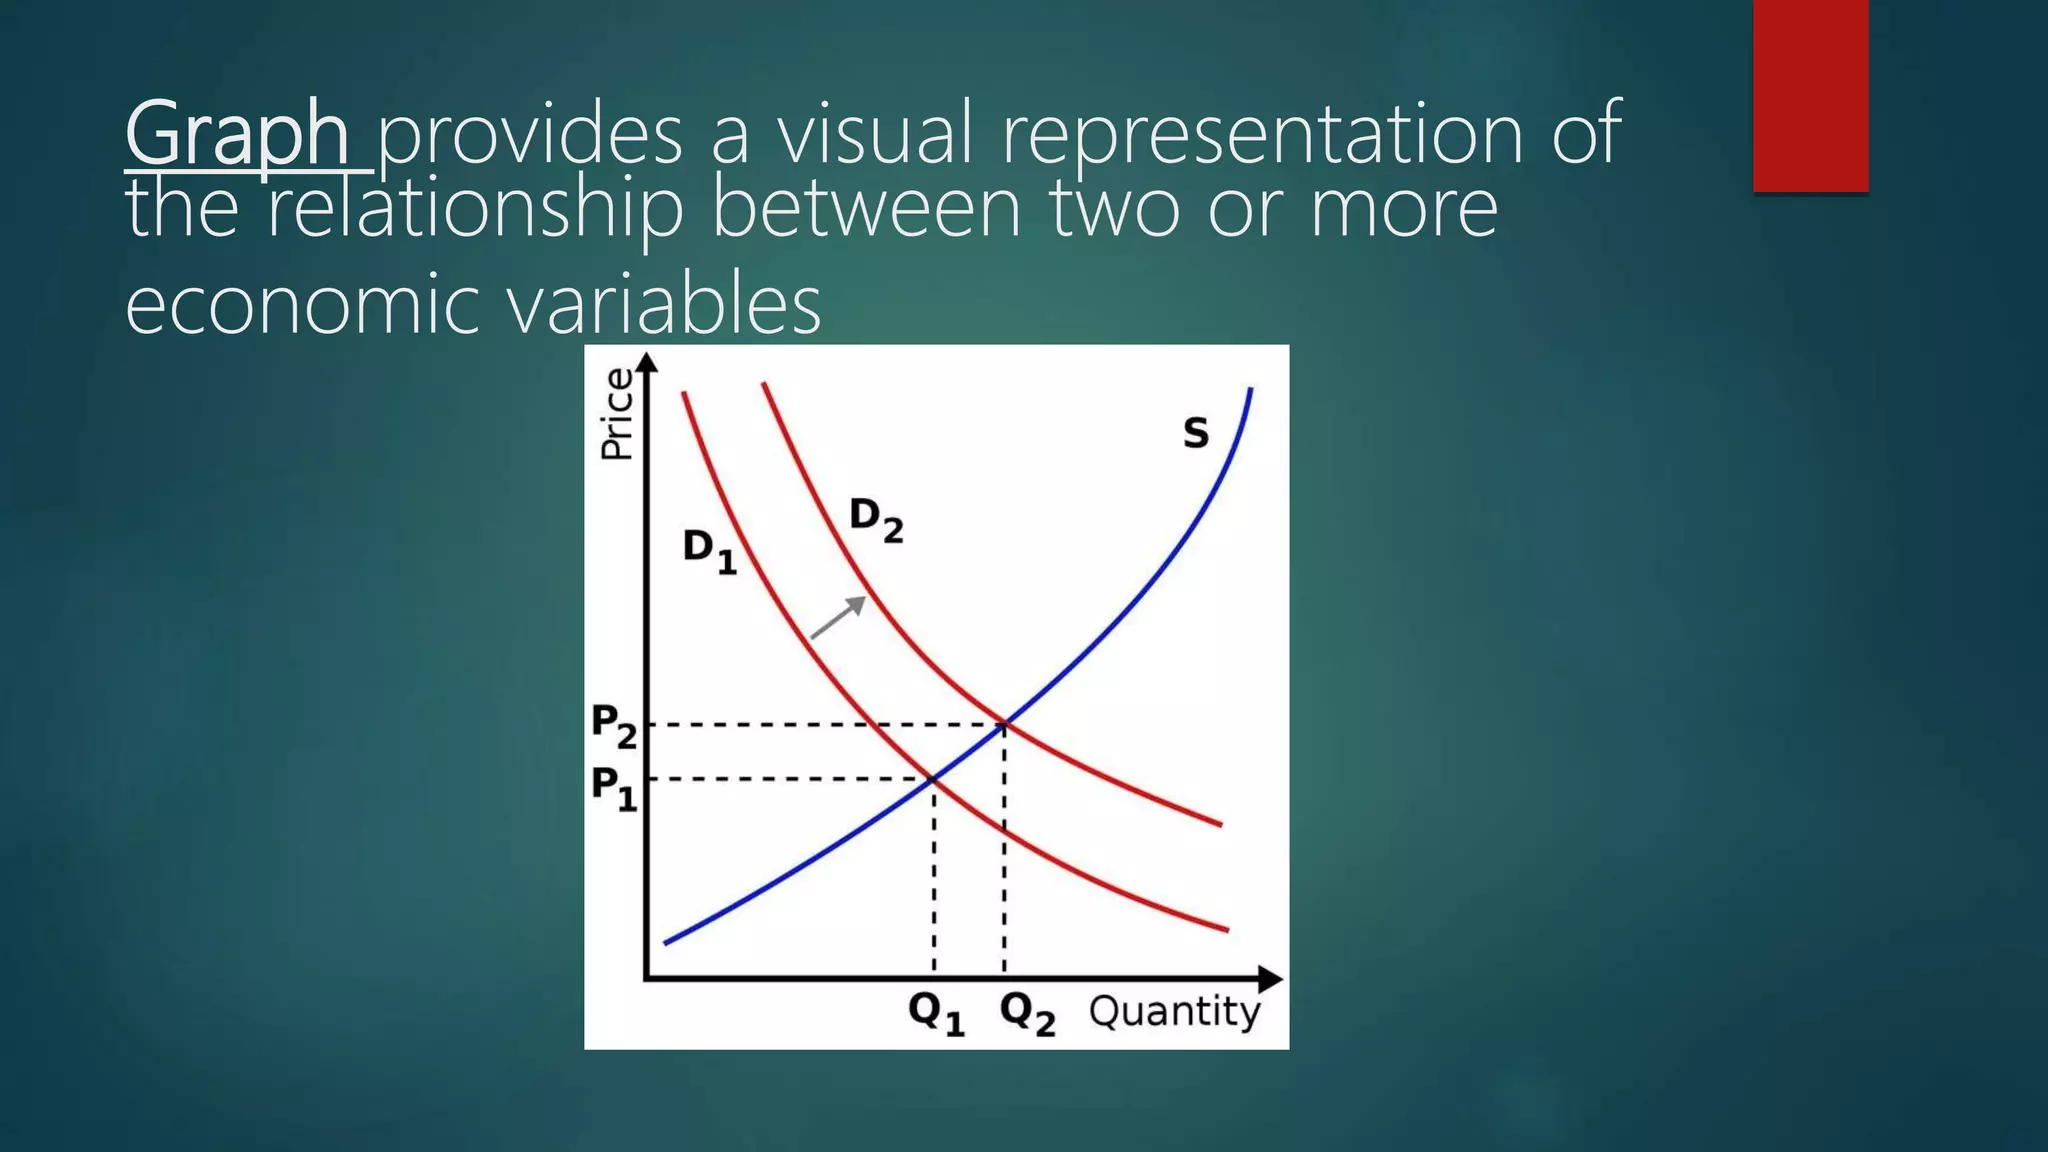
Graph provides avisual representation of
the relationship between two or more
economic variables
19.
Economic Theories andModels
Economic theories simplify economic phenomena.
E.g. Marginal Utility Theory
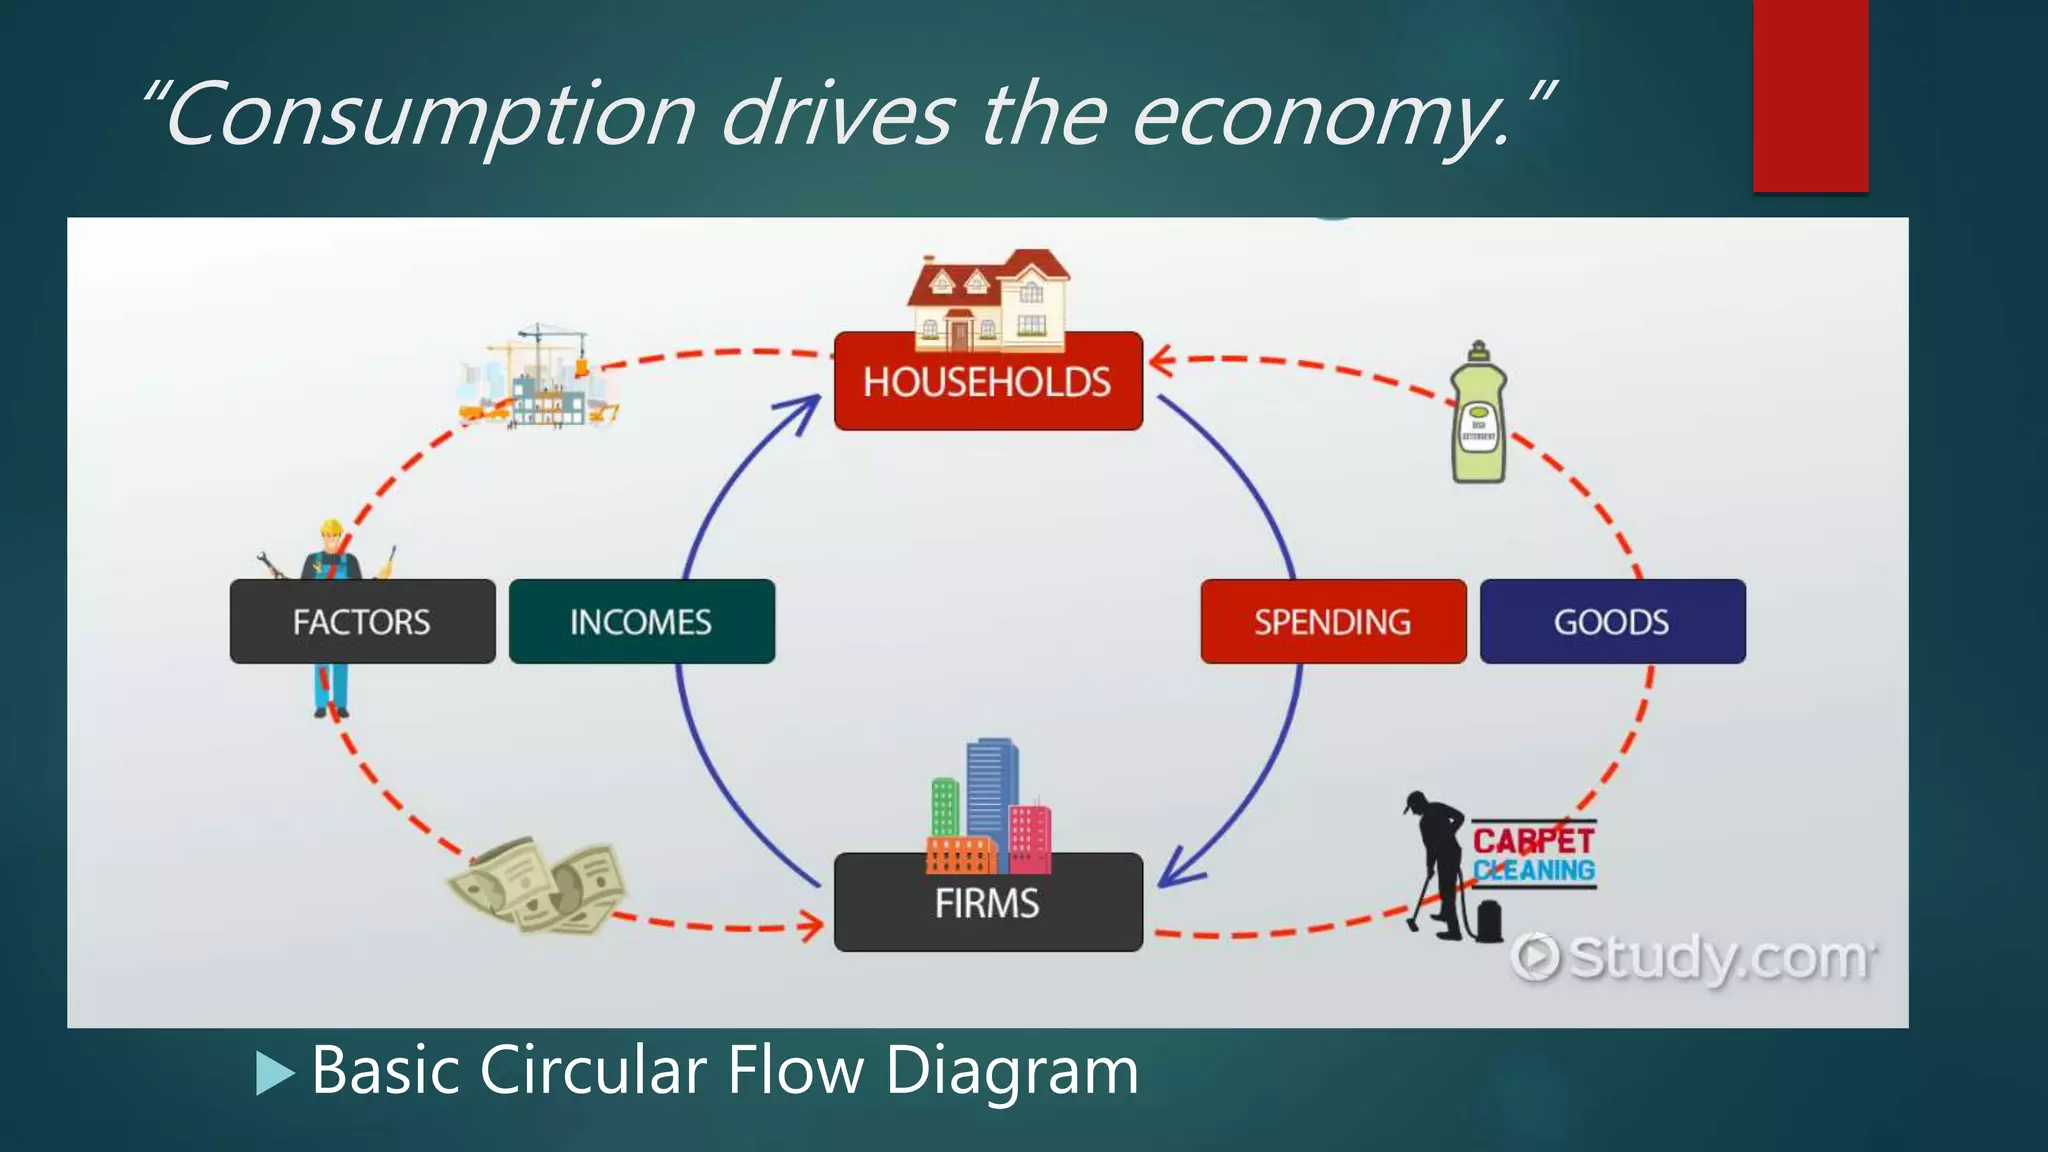
Economic models are the representations of economic and
social phenomena using research, observations, and testing.
E.g. Circular Flow Diagram
In formulating models and theories, economists often use
ASSUMPTIONS.
E.g. ceteris paribus assumption “all else being the same
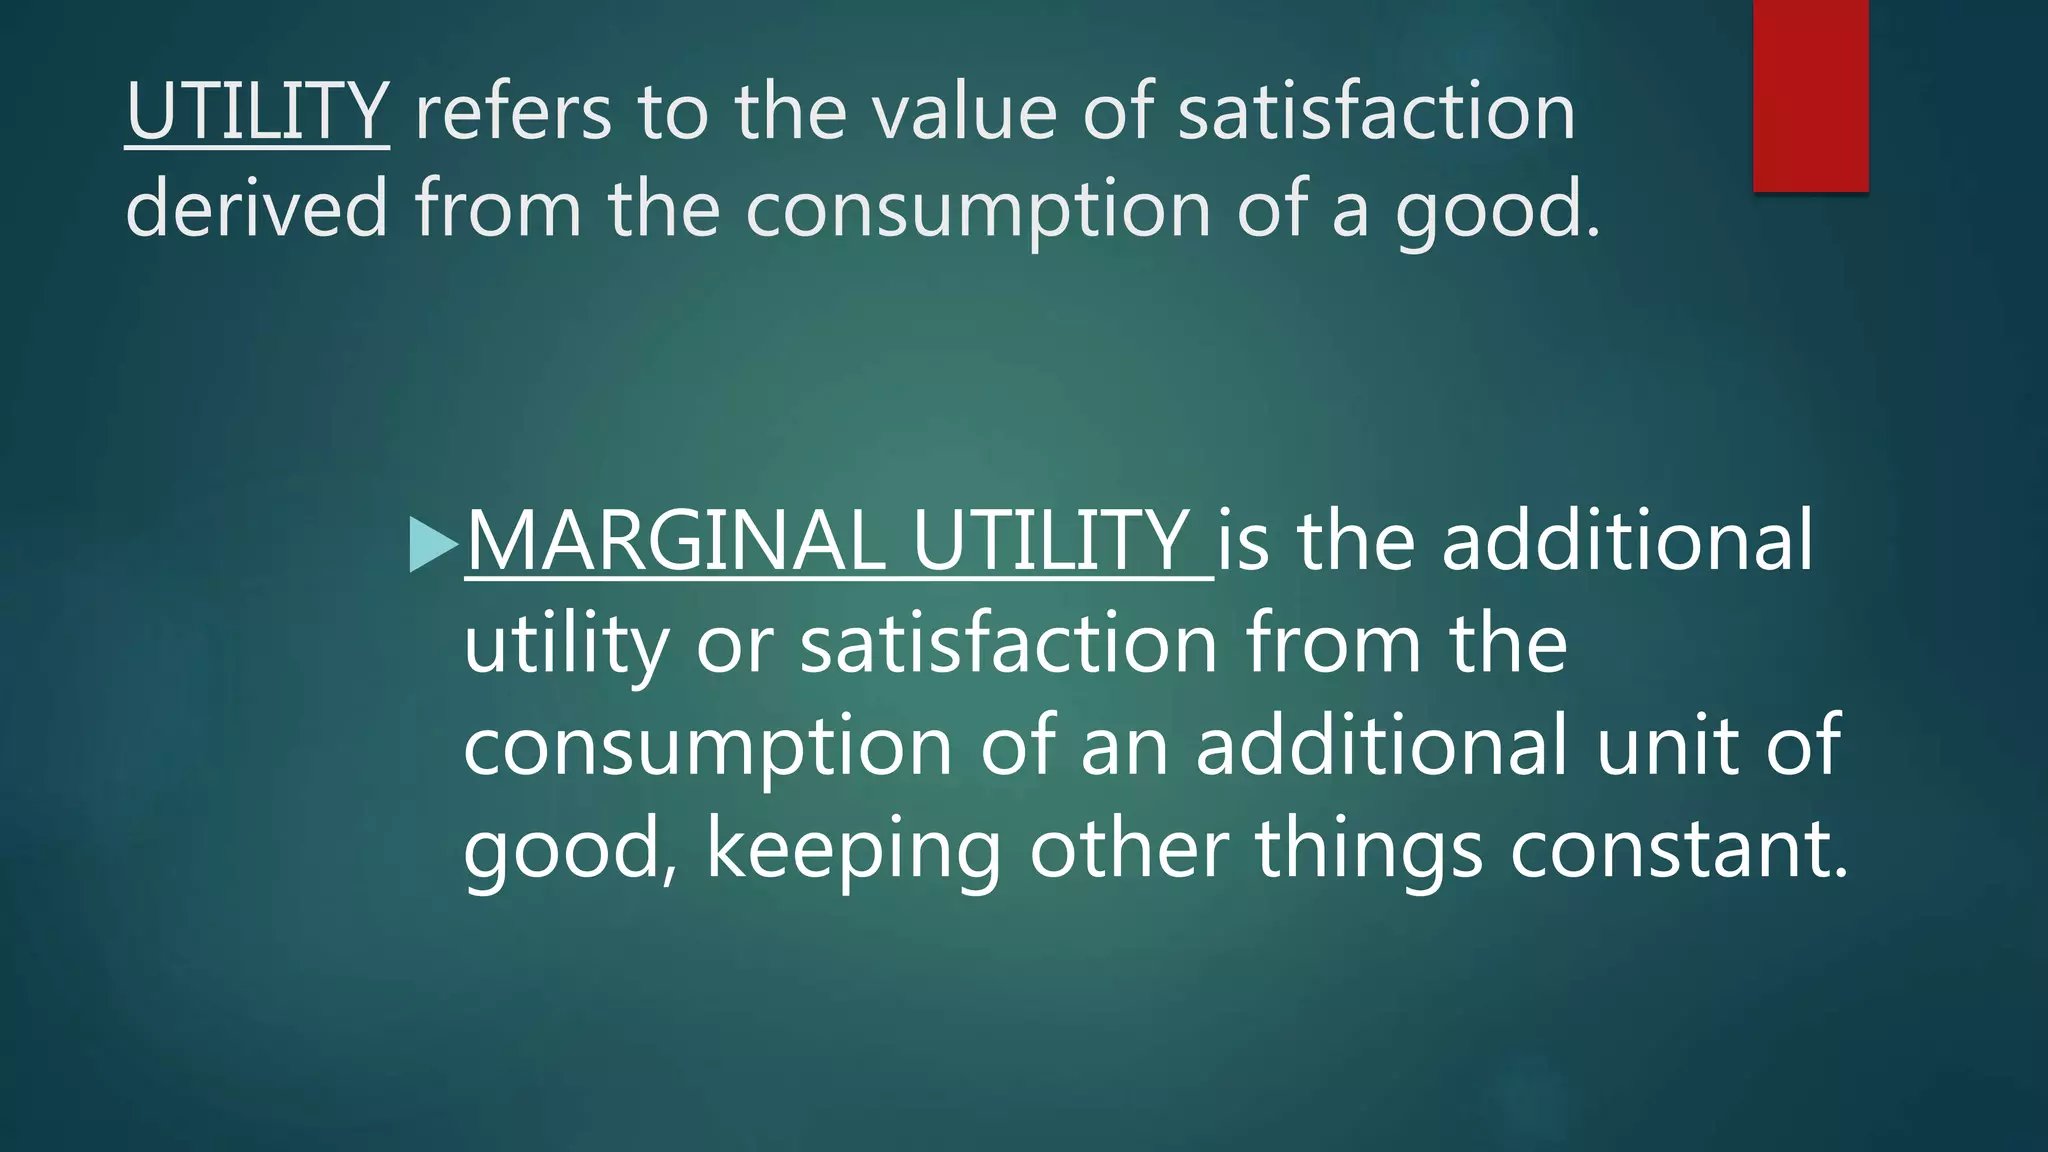
UTILITY refers tothe value of satisfaction
derived from the consumption of a good.
MARGINAL UTILITY is the additional
utility or satisfaction from the
consumption of an additional unit of
good, keeping other things constant.
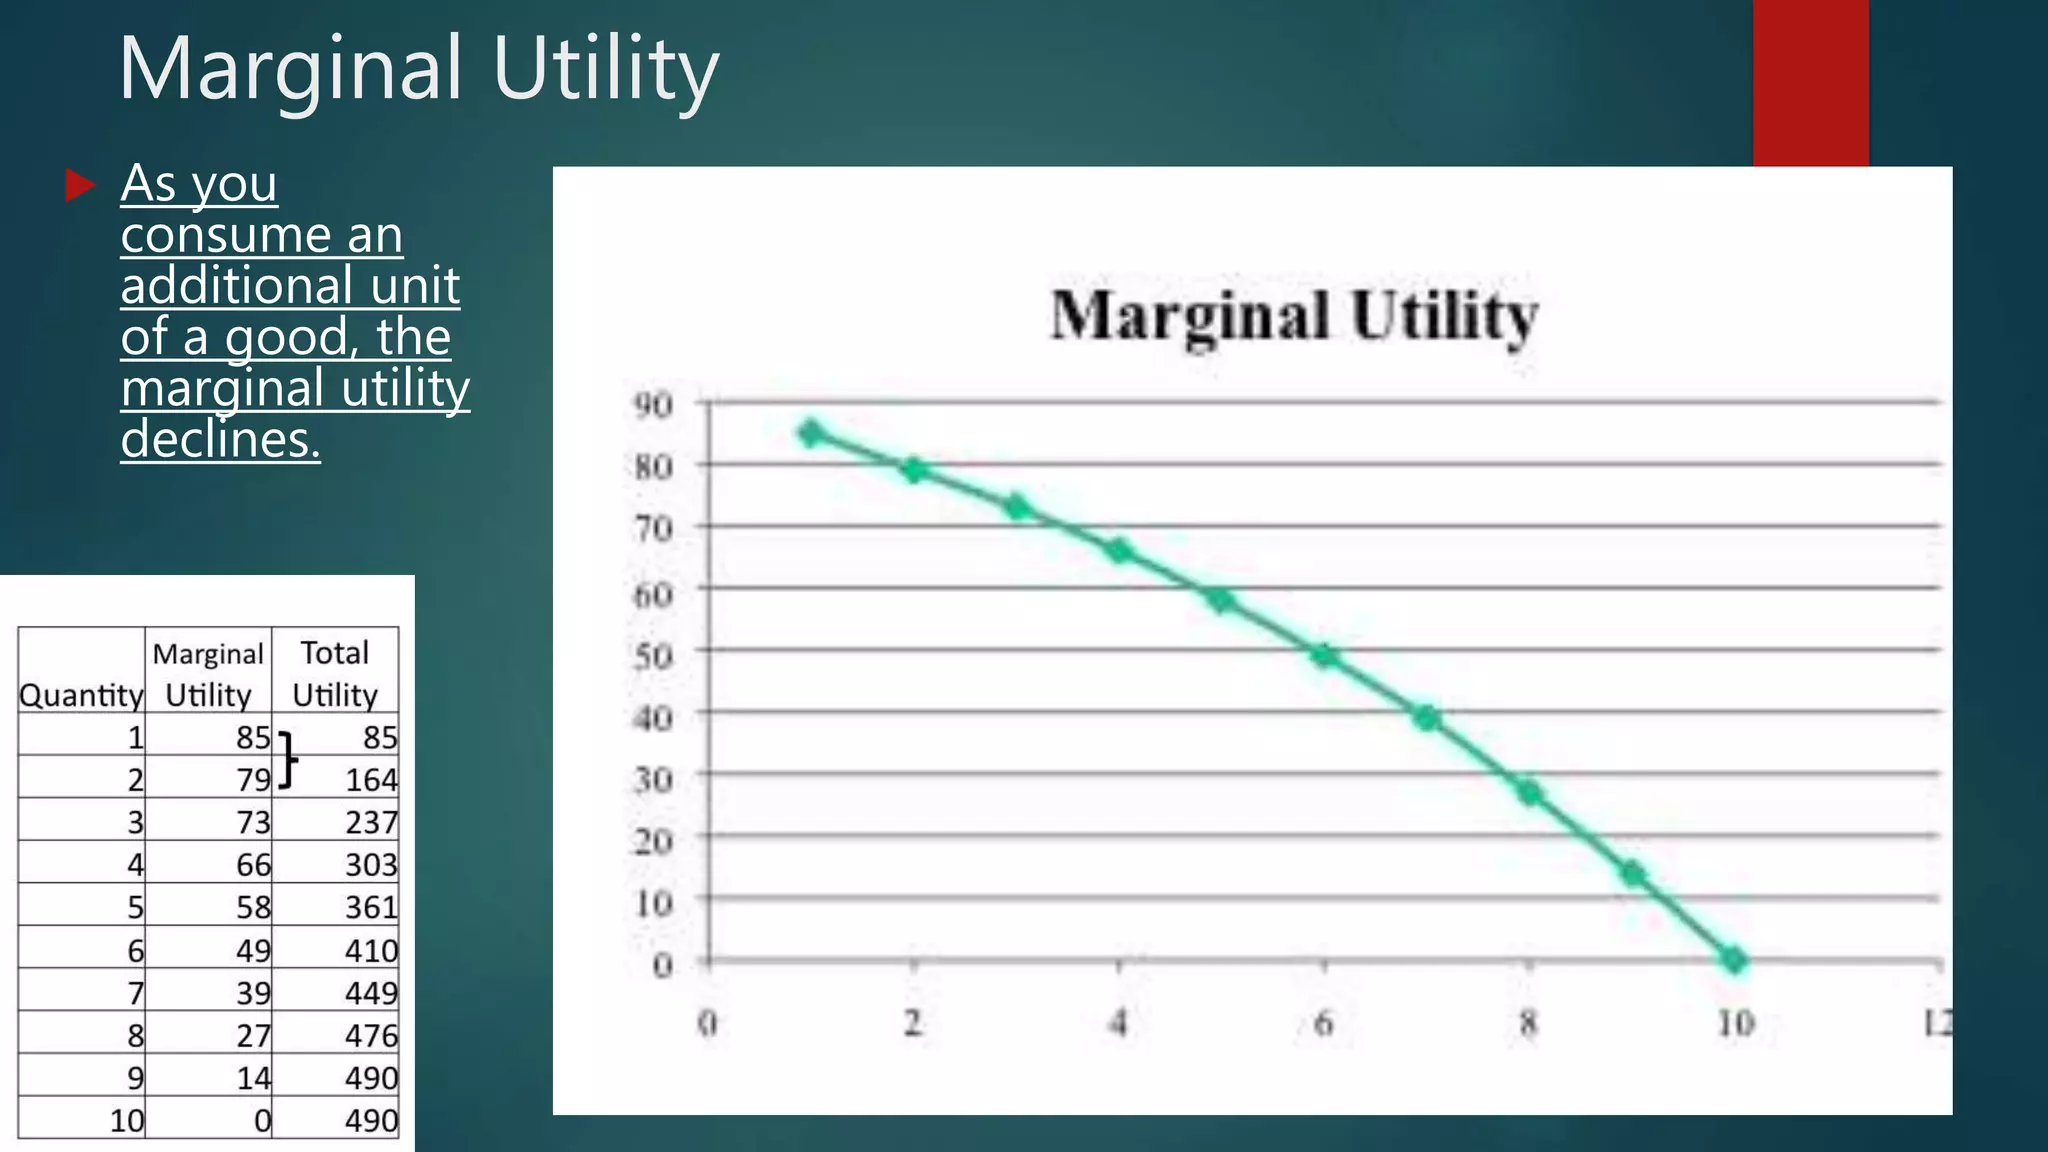
Marginal Utility
Asyou
consume an
additional unit
of a good, the
marginal utility
declines.
26.
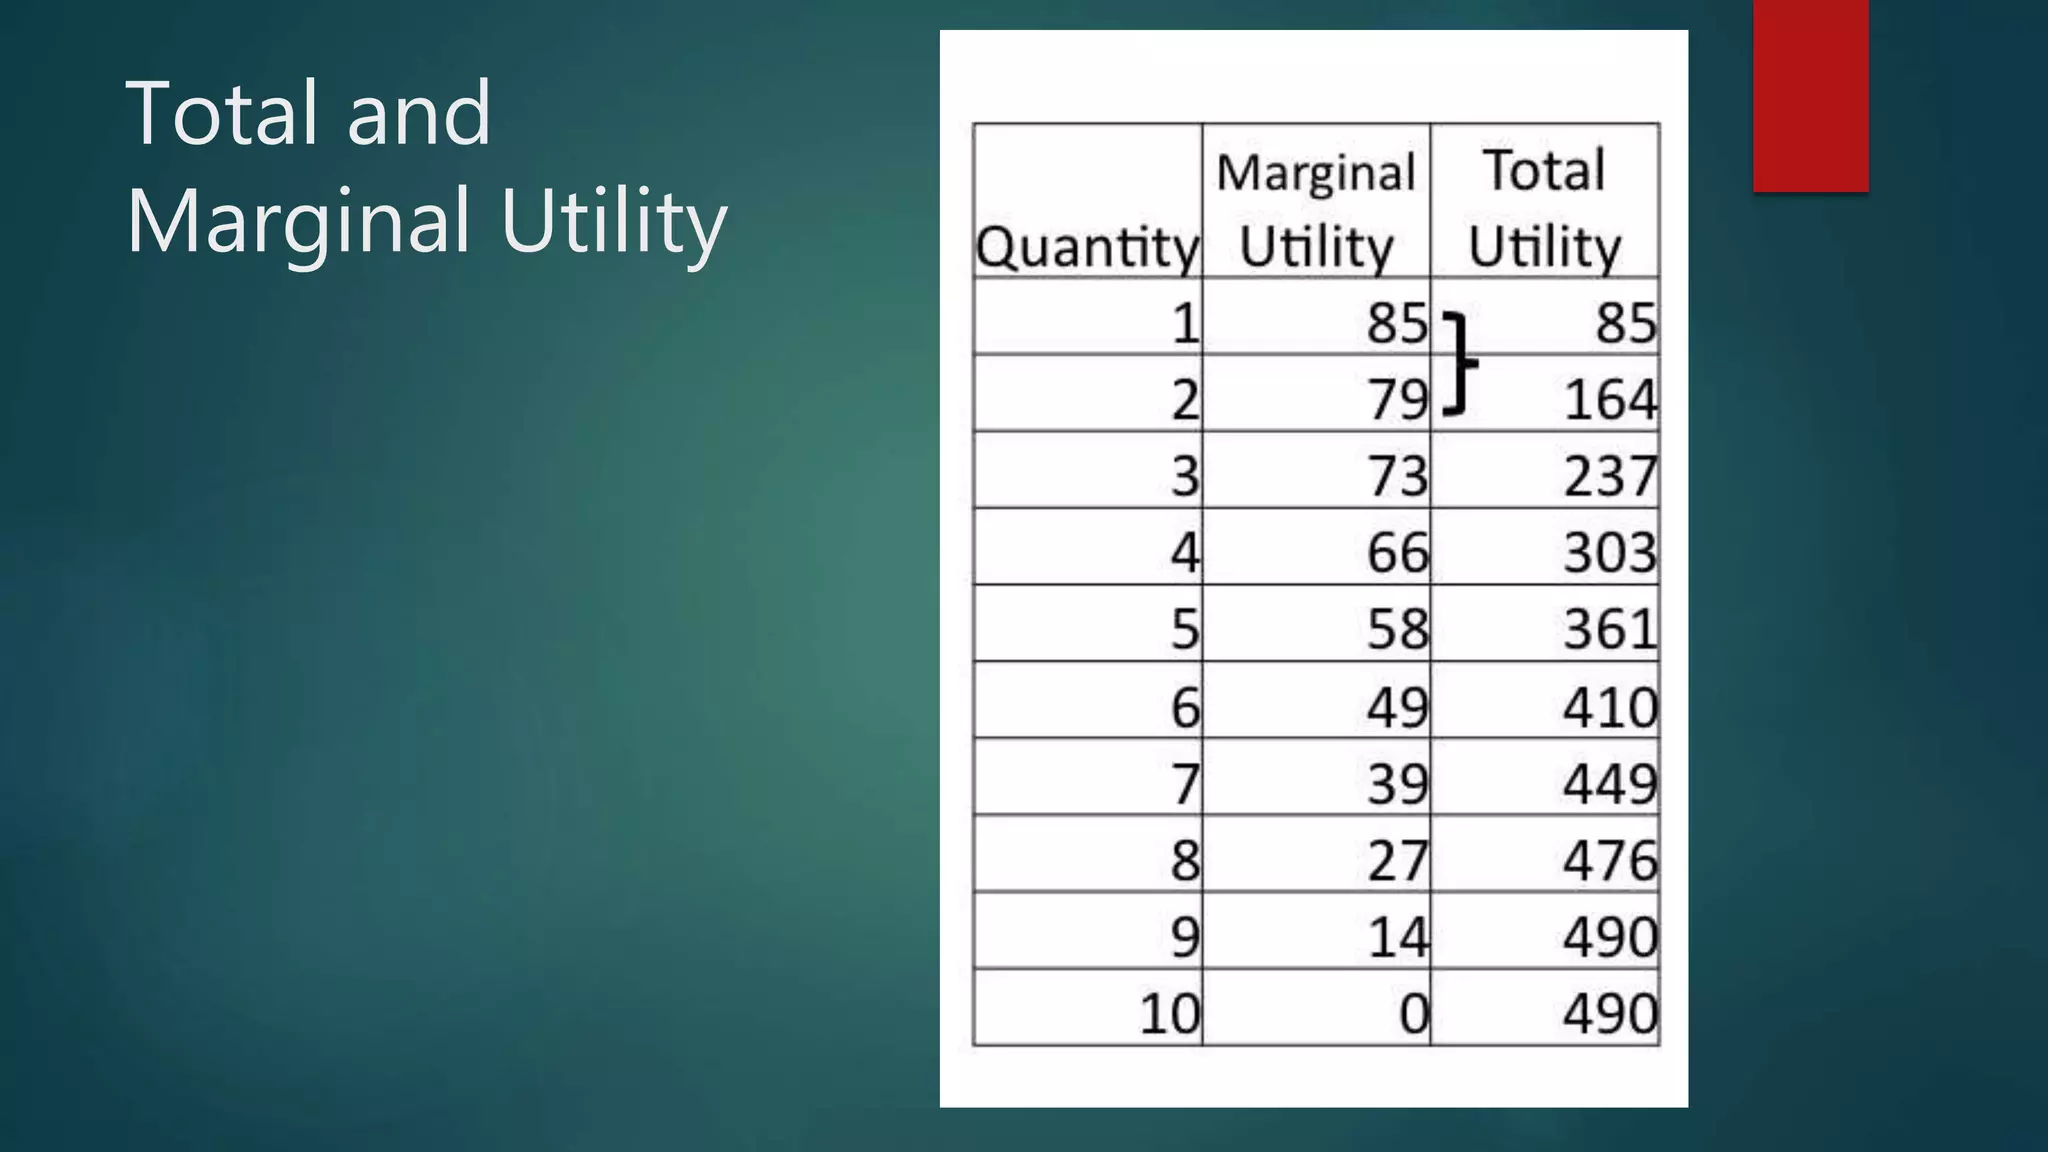
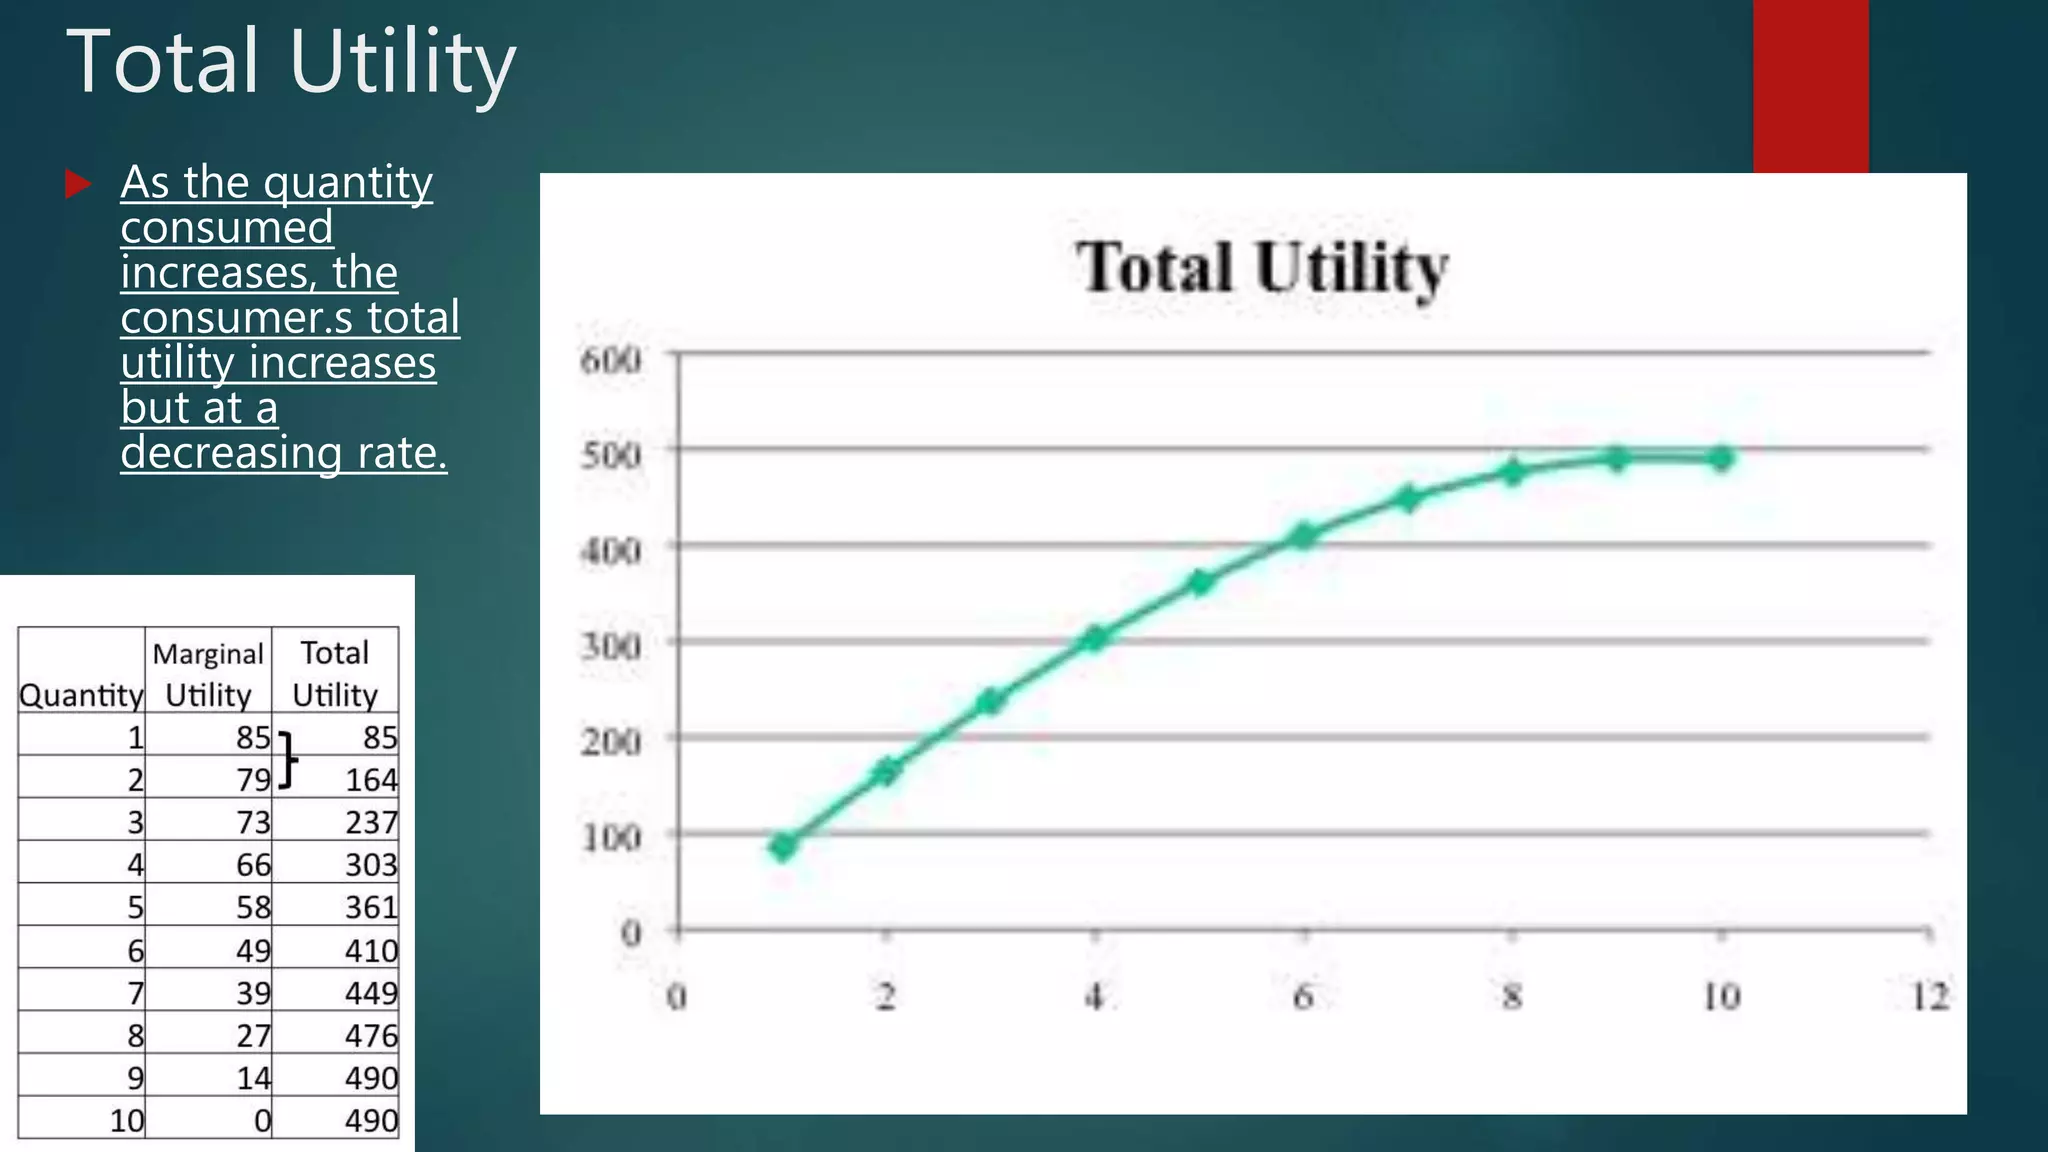
Total Utility
Asthe quantity
consumed
increases, the
consumer.s total
utility increases
but at a
decreasing rate.
27.
Indifference Curve
An indifferencecurve is a graph showing
combination of two goods that give the
consumer equal satisfaction and utility. Each
point on an indifference curve indicates that a
consumer is indifferent between the two and
all points give him the same utility.
28.
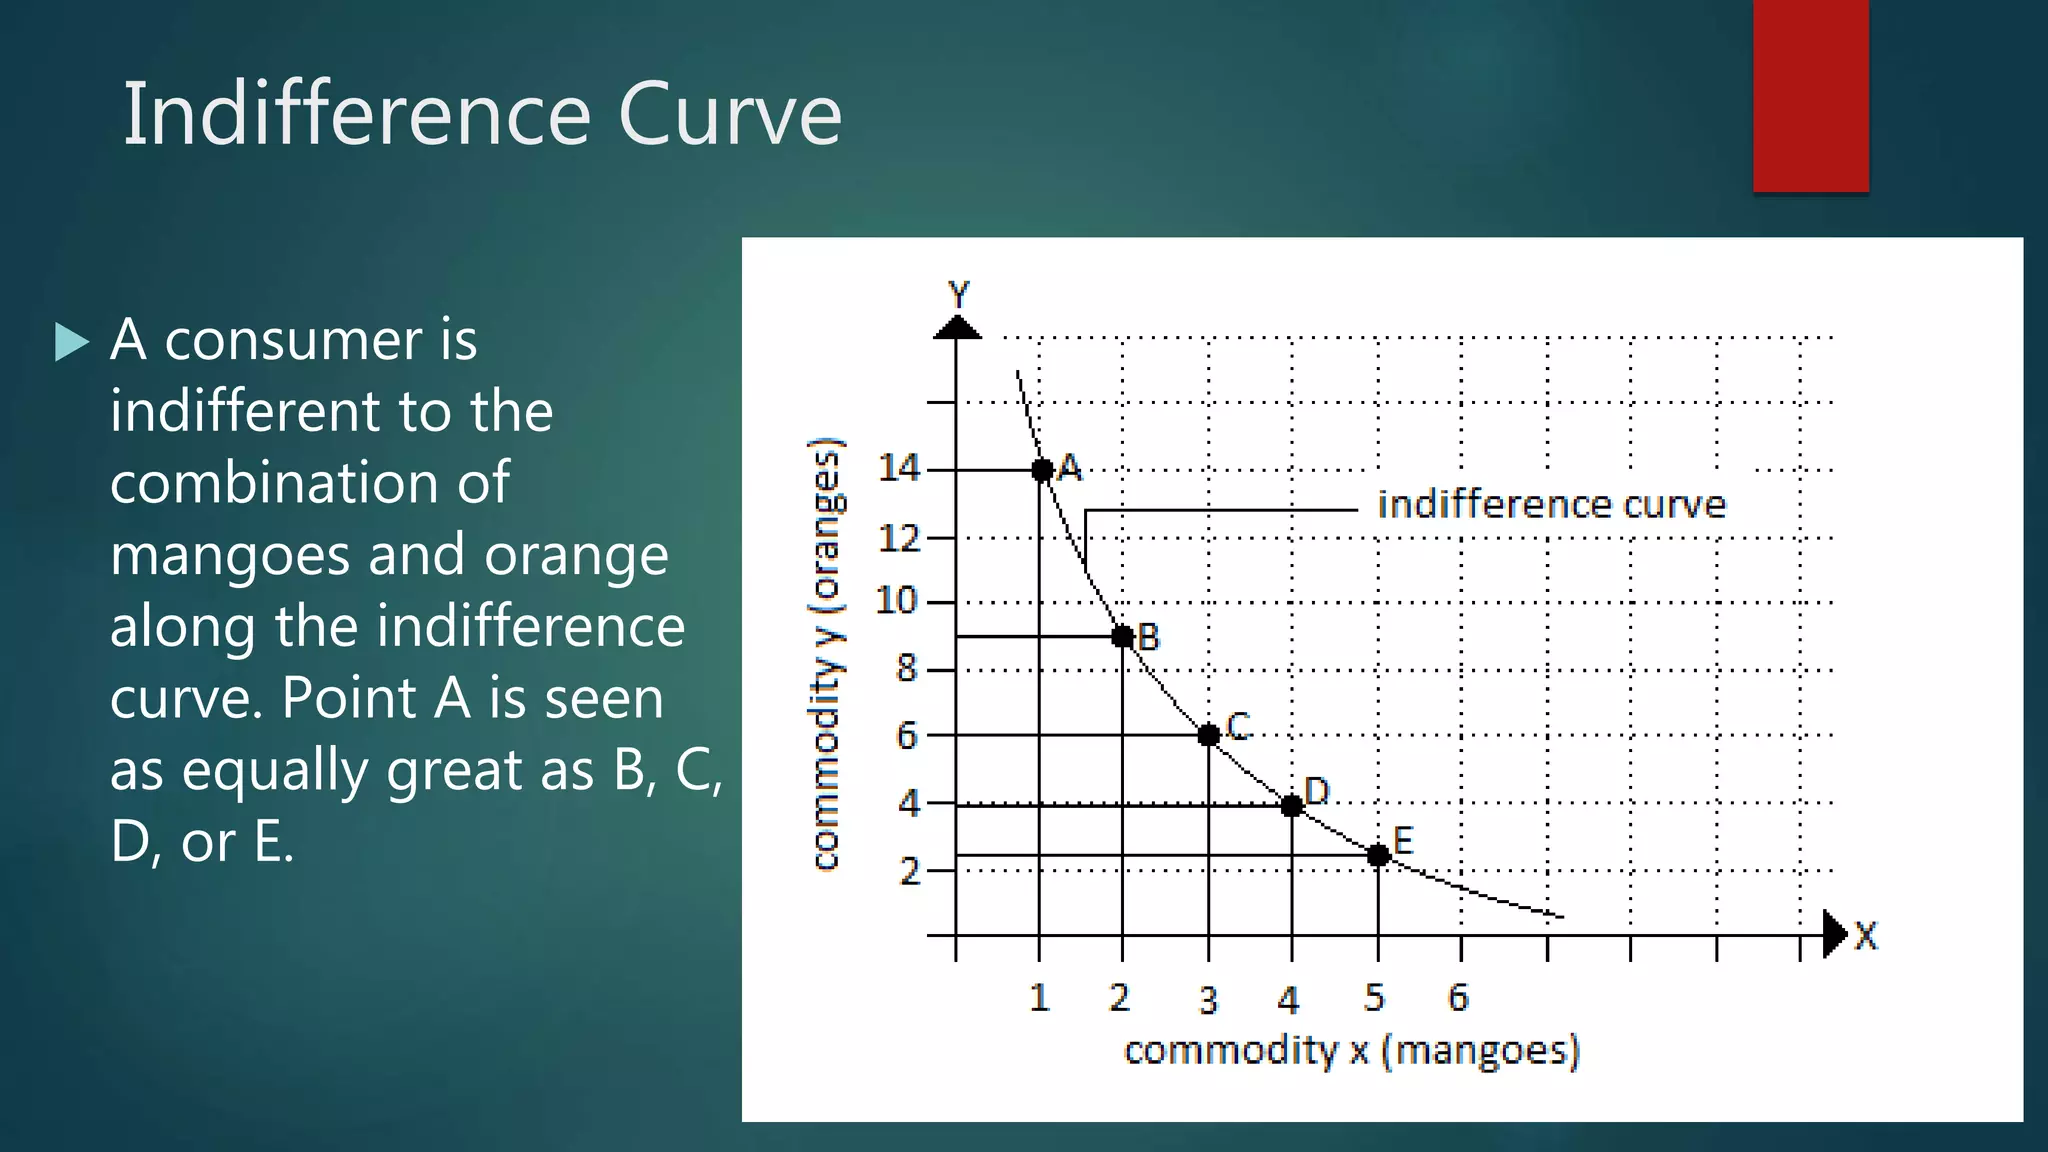
Indifference Curve
Aconsumer is
indifferent to the
combination of
mangoes and orange
along the indifference
curve. Point A is seen
as equally great as B, C,
D, or E.
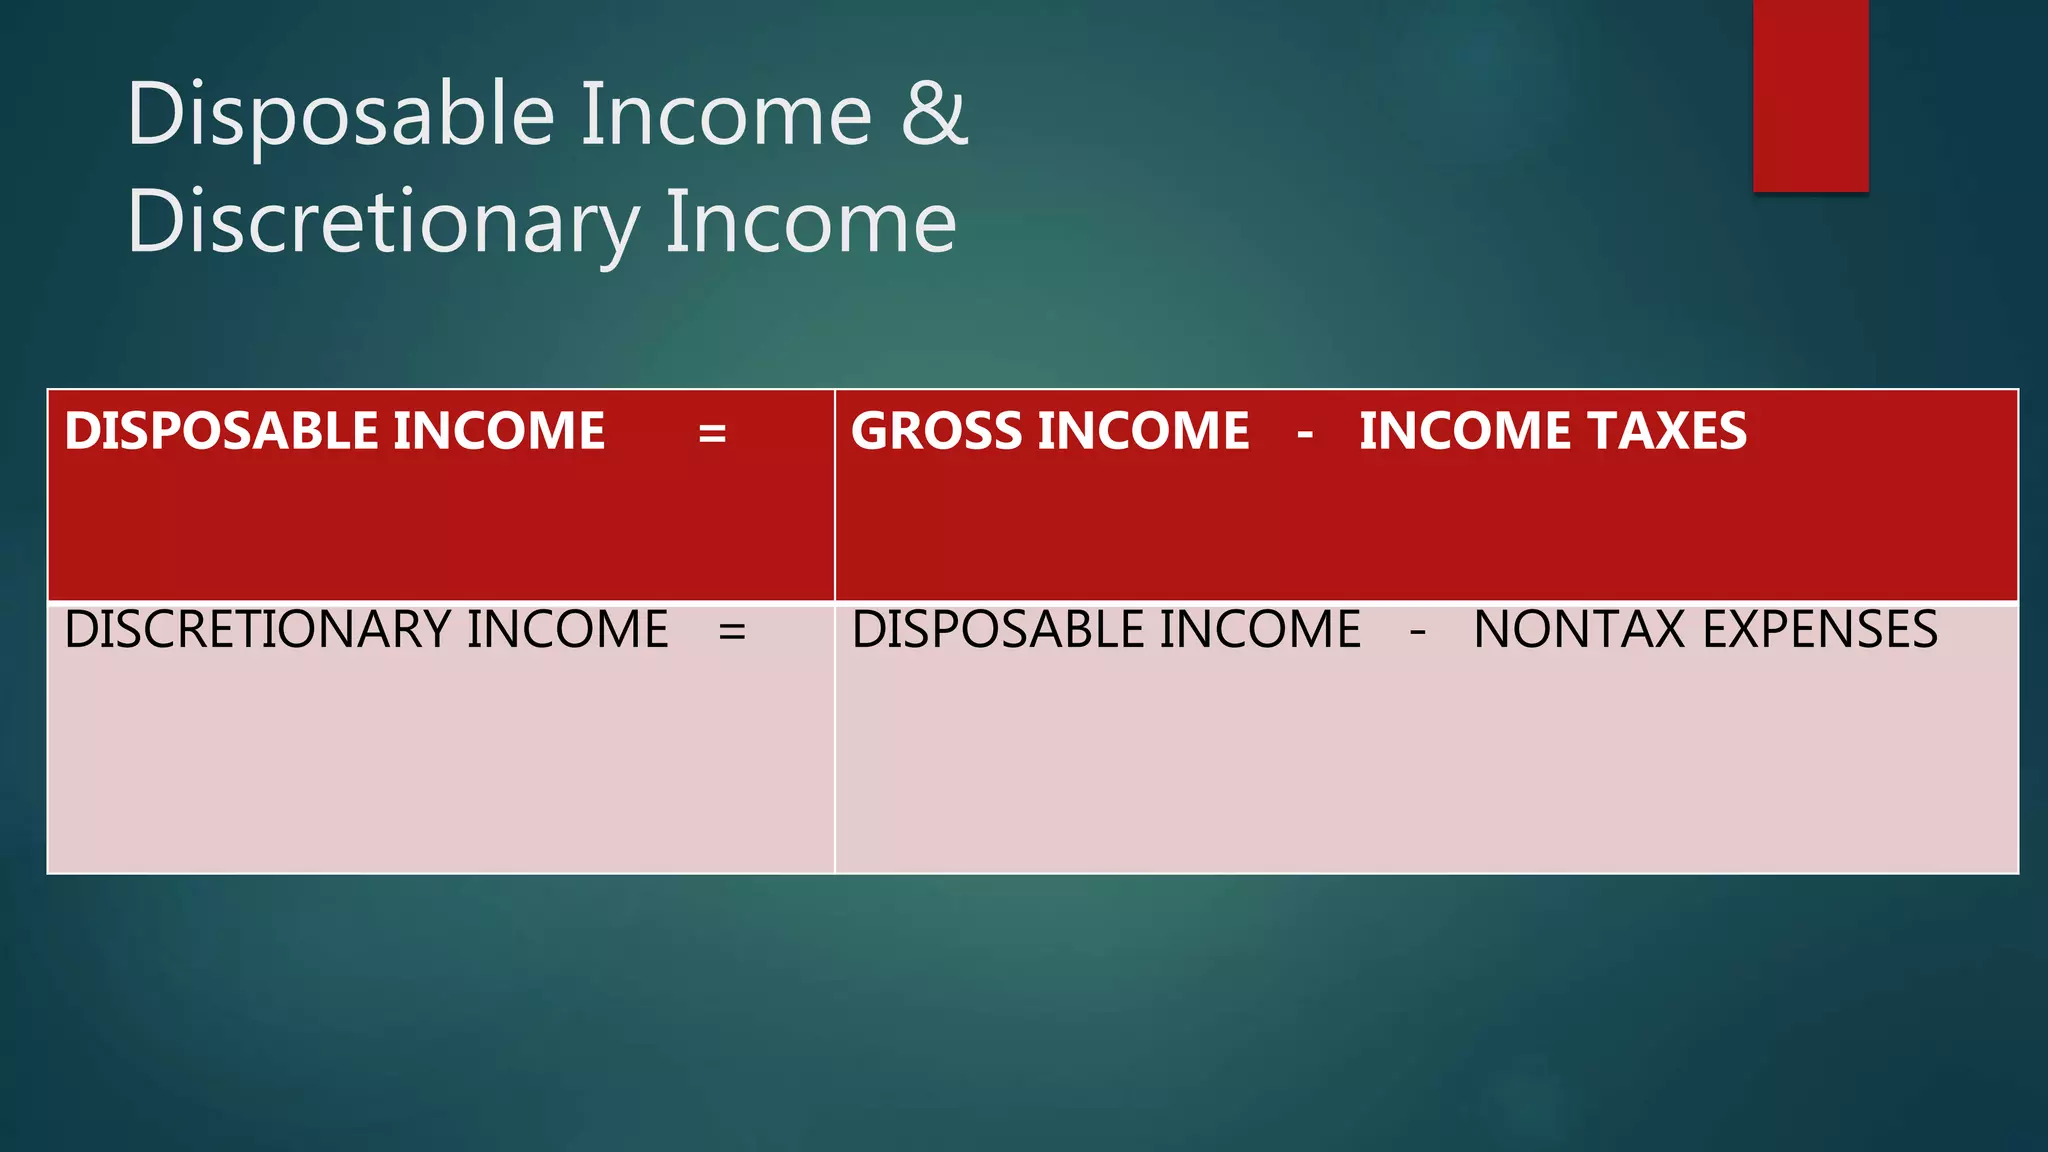
Disposable Income &
DiscretionaryIncome
Disposable income is the income after taxes.
Discretionary income is the income left from
disposable income after all necessary (nontax)
expenses have been deducted. The amount
that is either spent or saved corresponds to
discretionary income.
34.
Disposable Income &
DiscretionaryIncome
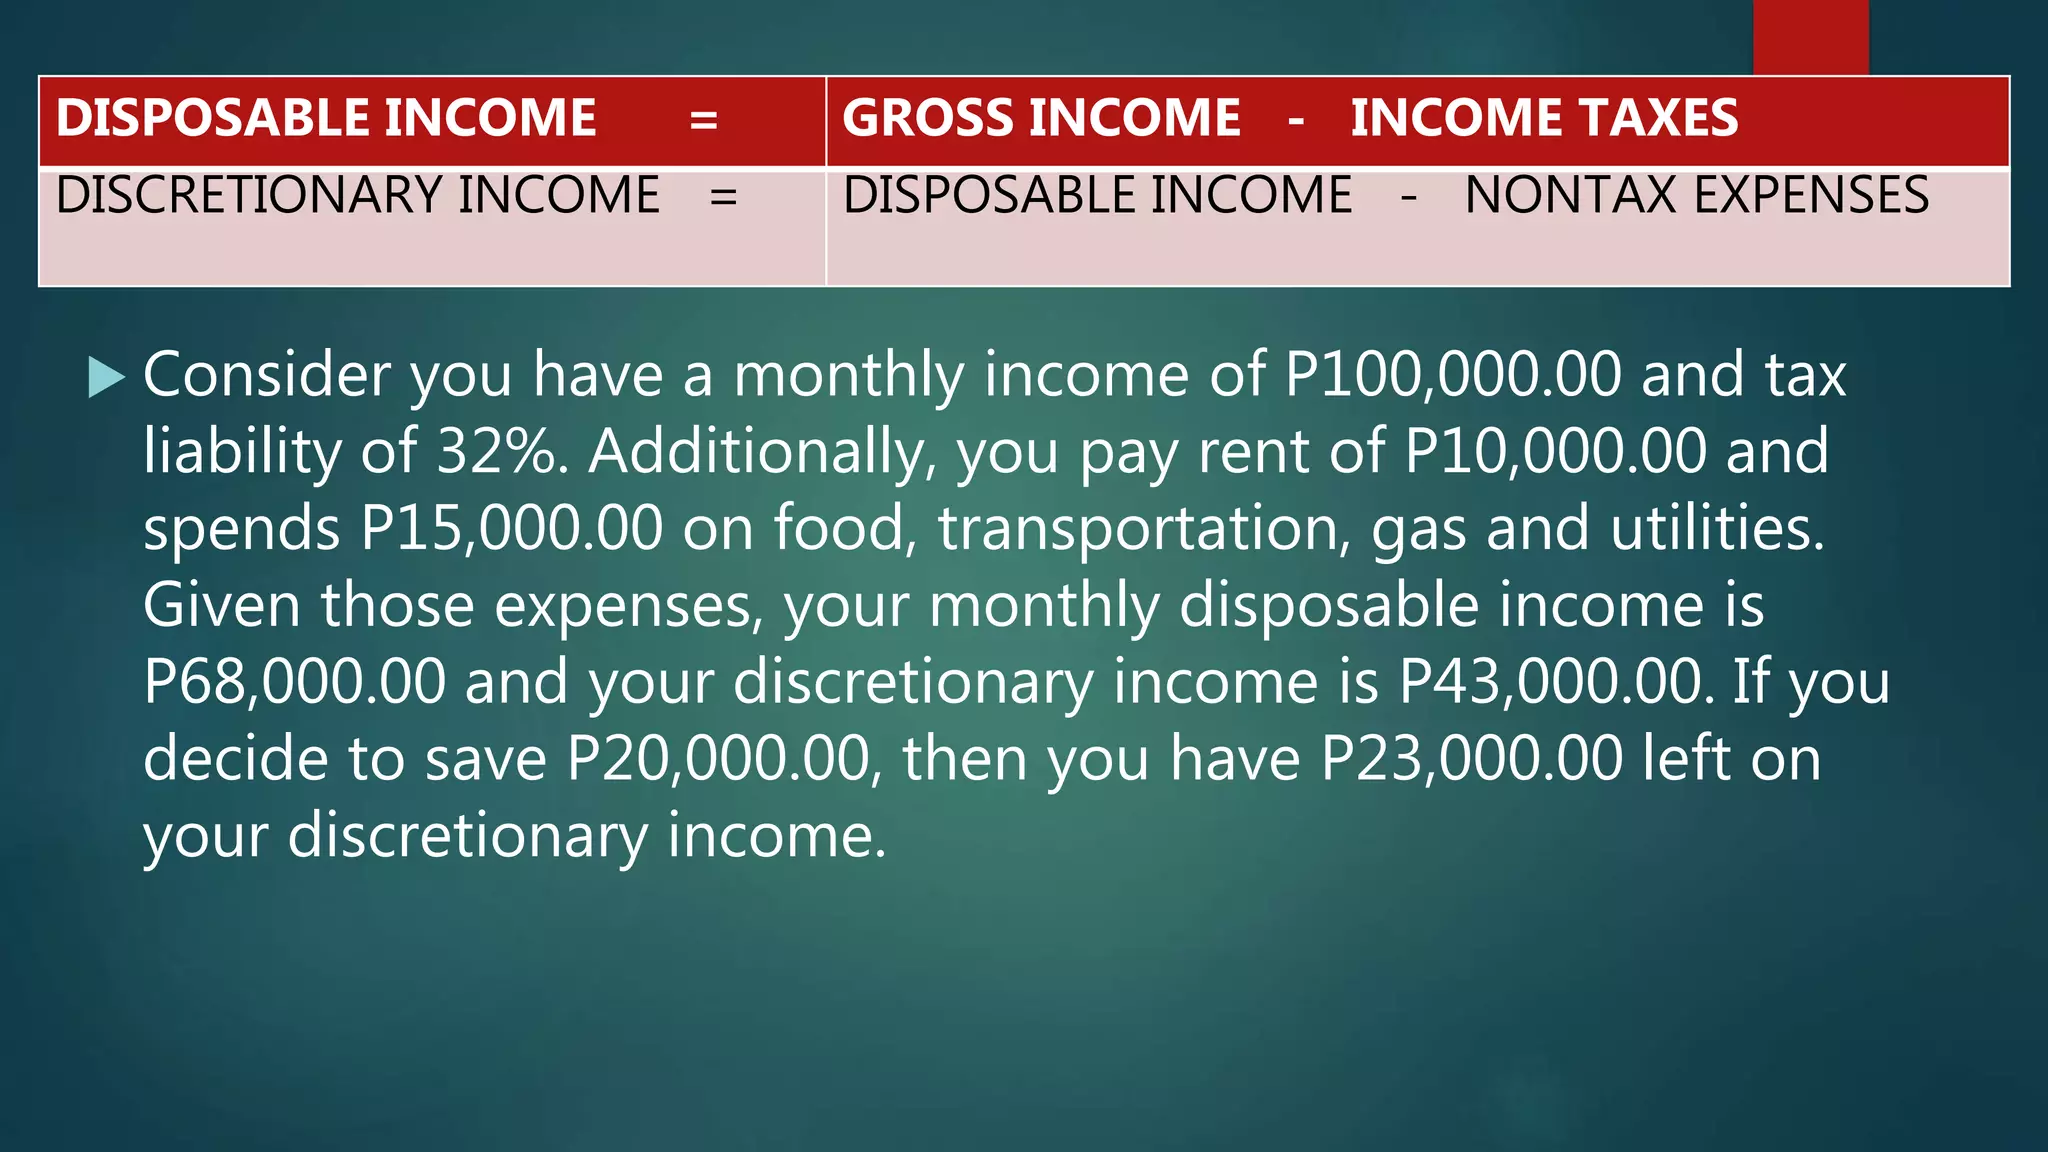
DISPOSABLE INCOME = GROSS INCOME - INCOME TAXES
DISCRETIONARY INCOME = DISPOSABLE INCOME - NONTAX EXPENSES
35.
Consider youhave a monthly income of P100,000.00 and tax
liability of 32%. Additionally, you pay rent of P10,000.00 and
spends P15,000.00 on food, transportation, gas and utilities.
Given those expenses, your monthly disposable income is
P68,000.00 and your discretionary income is P43,000.00. If you
decide to save P20,000.00, then you have P23,000.00 left on
your discretionary income.
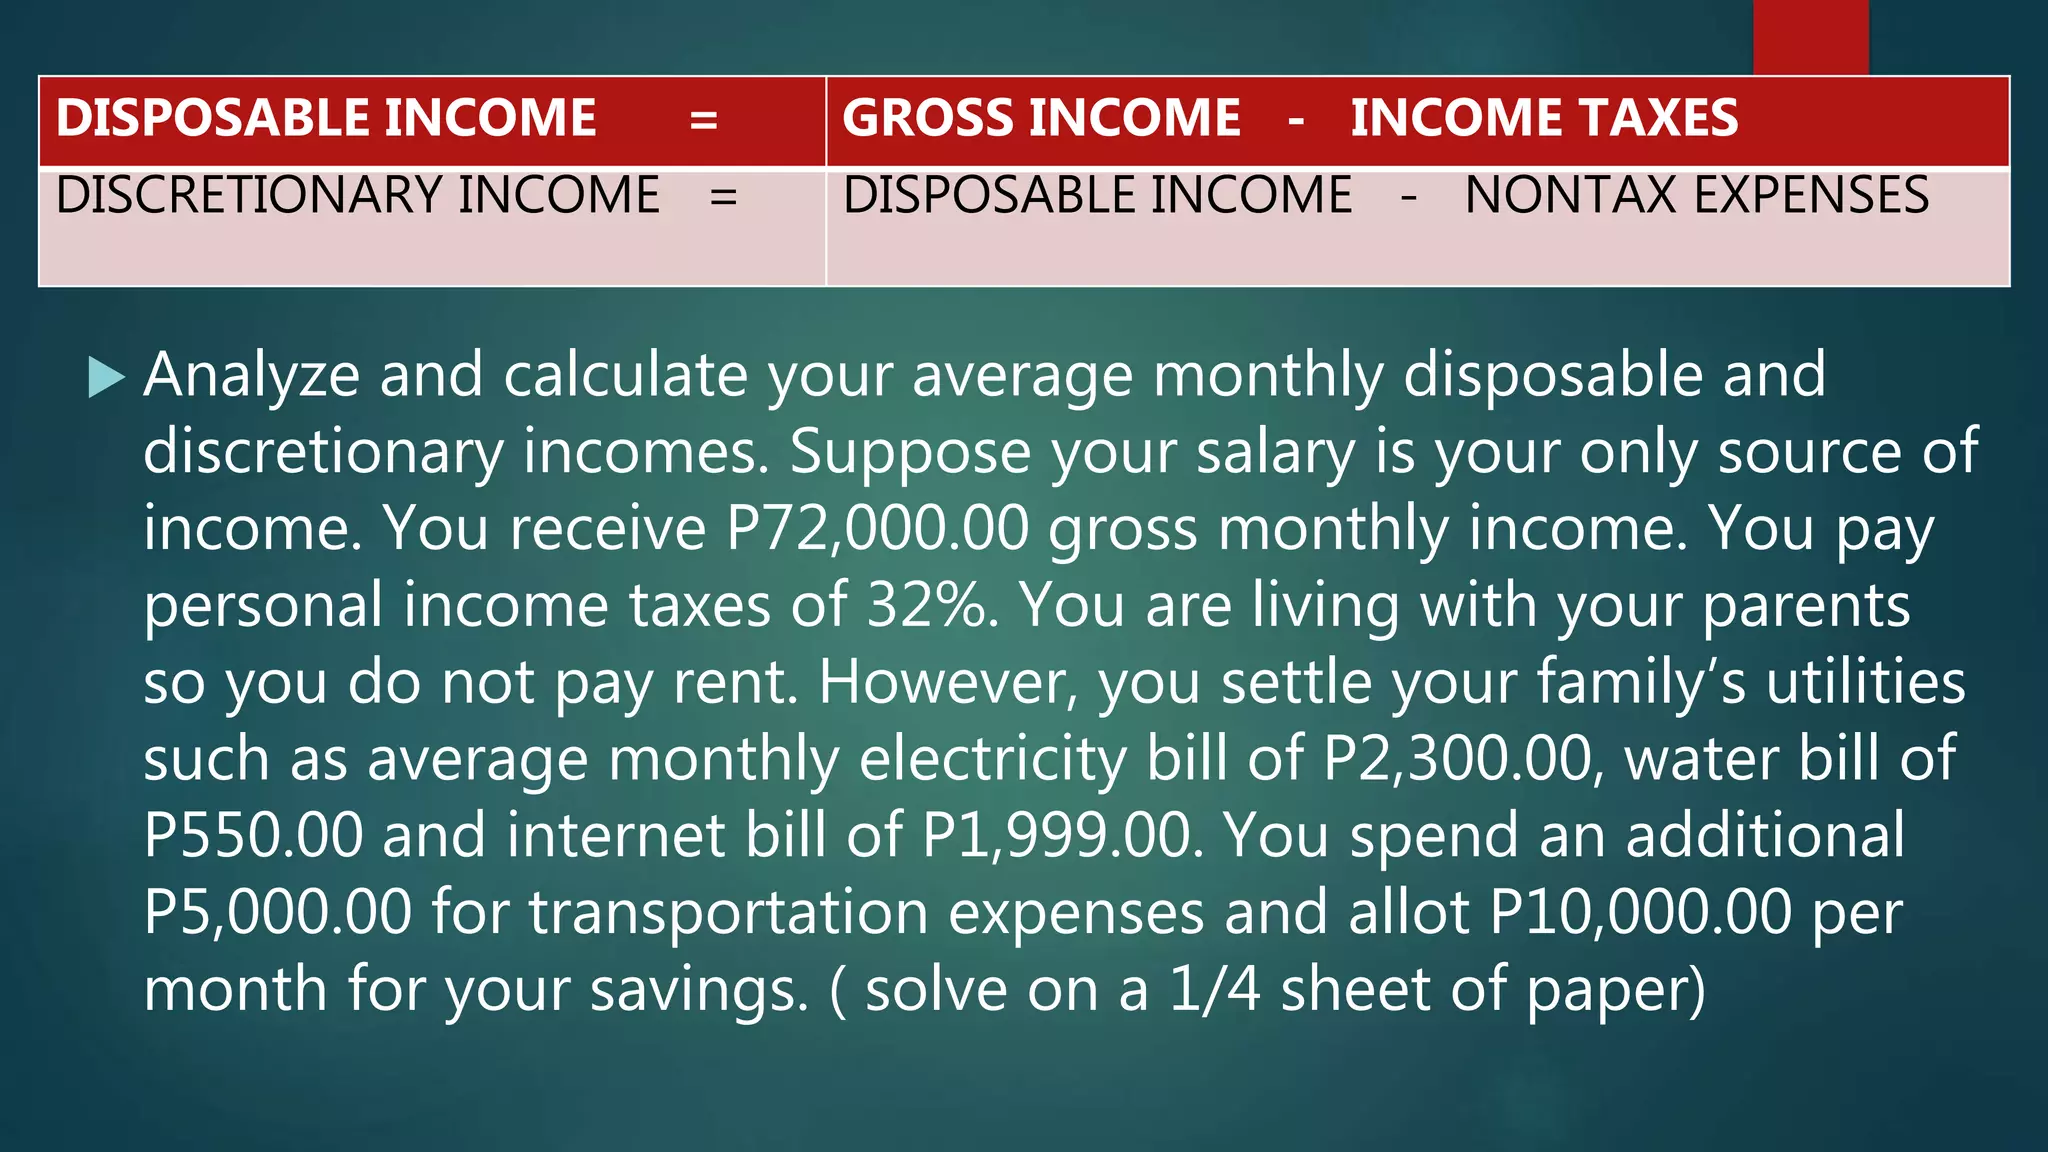
DISPOSABLE INCOME = GROSS INCOME - INCOME TAXES
DISCRETIONARY INCOME = DISPOSABLE INCOME - NONTAX EXPENSES
36.
Analyze andcalculate your average monthly disposable and
discretionary incomes. Suppose your salary is your only source of
income. You receive P72,000.00 gross monthly income. You pay
personal income taxes of 32%. You are living with your parents
so you do not pay rent. However, you settle your family’s utilities
such as average monthly electricity bill of P2,300.00, water bill of
P550.00 and internet bill of P1,999.00. You spend an additional
P5,000.00 for transportation expenses and allot P10,000.00 per
month for your savings. ( solve on a 1/4 sheet of paper)
DISPOSABLE INCOME = GROSS INCOME - INCOME TAXES
DISCRETIONARY INCOME = DISPOSABLE INCOME - NONTAX EXPENSES
37.
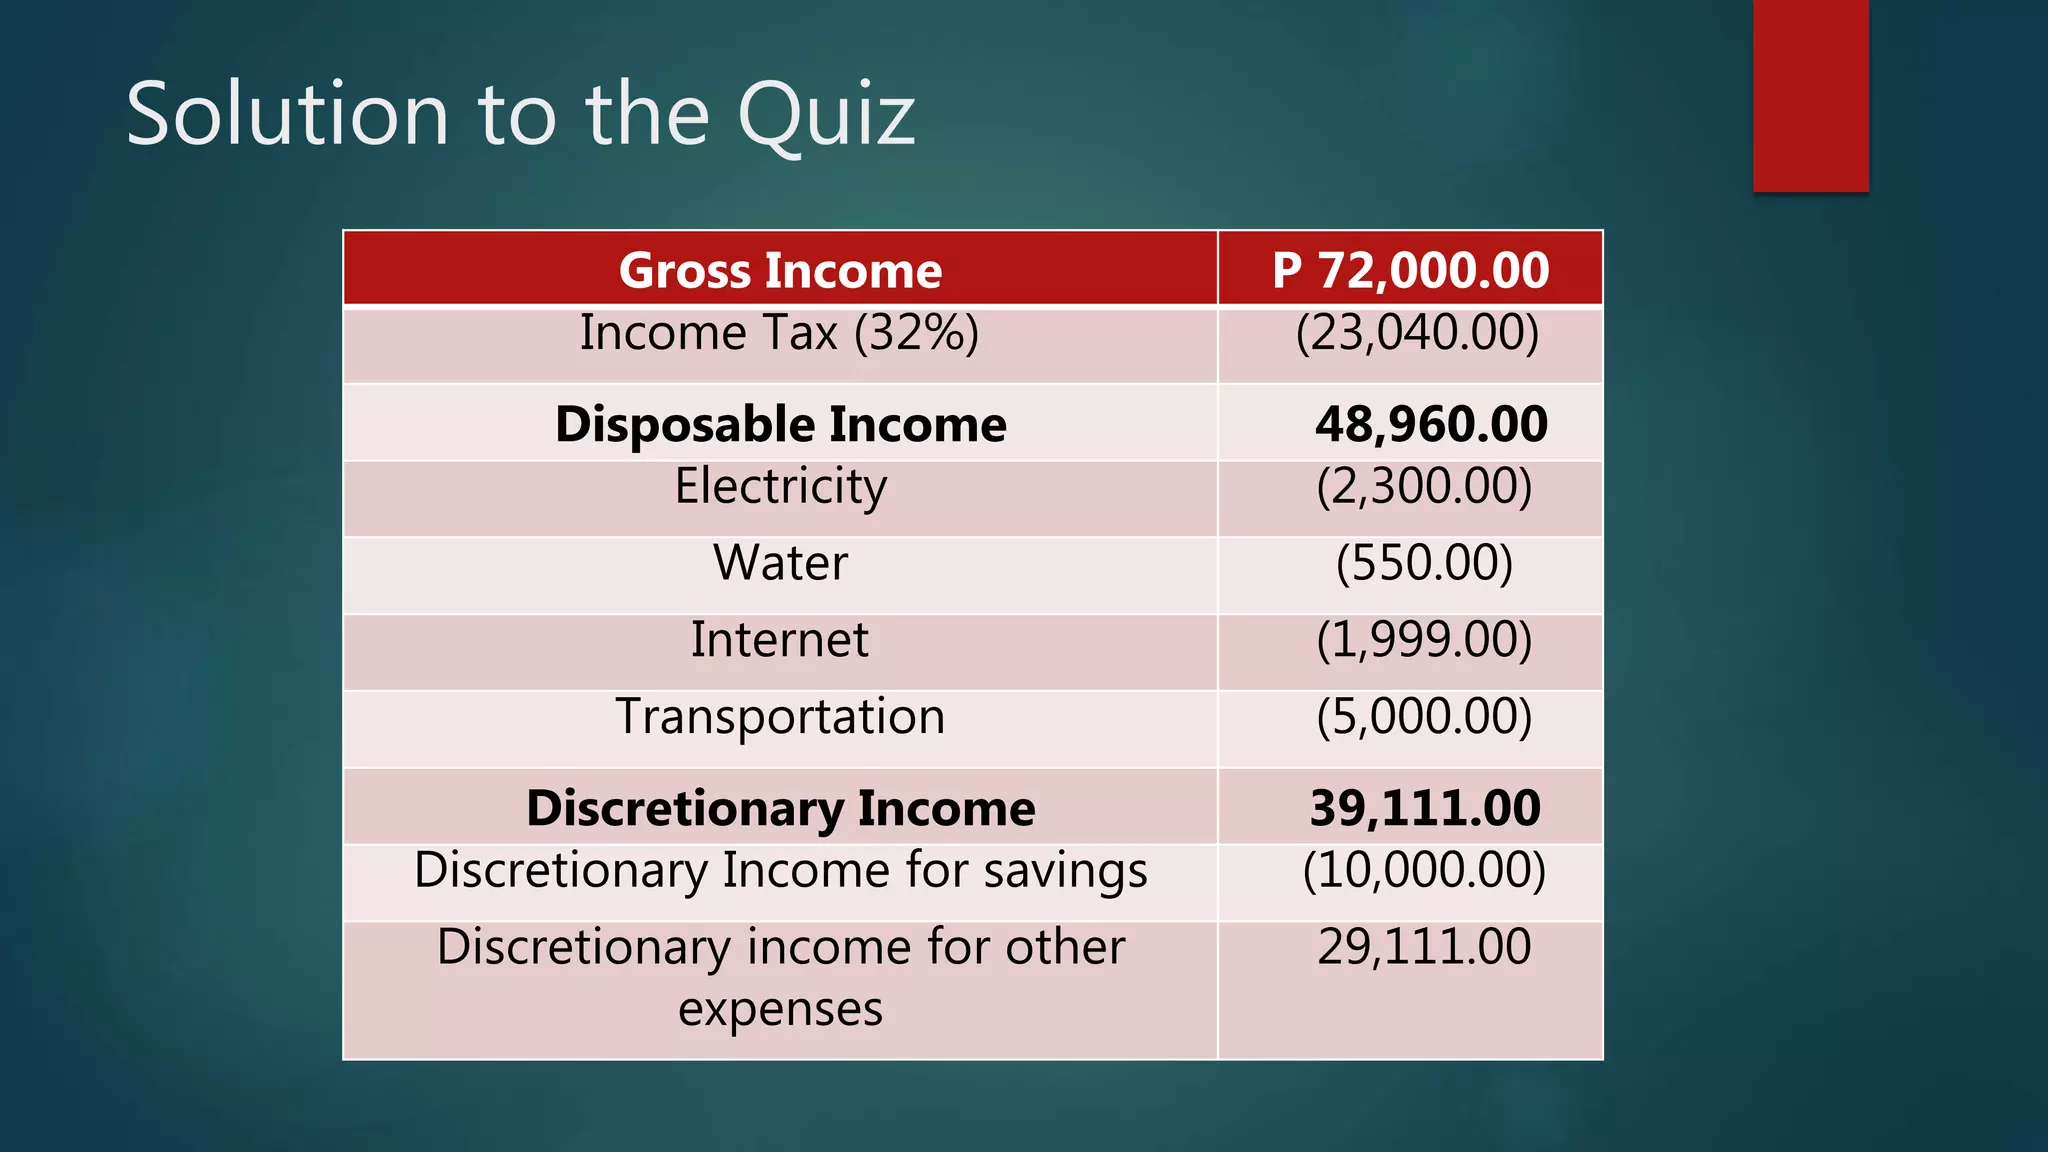
Solution to theQuiz
Gross Income P 72,000.00
Income Tax (32%) (23,040.00)
Disposable Income 48,960.00
Electricity (2,300.00)
Water (550.00)
Internet (1,999.00)
Transportation (5,000.00)
Discretionary Income 39,111.00
Discretionary Income for savings (10,000.00)
Discretionary income for other
expenses
29,111.00
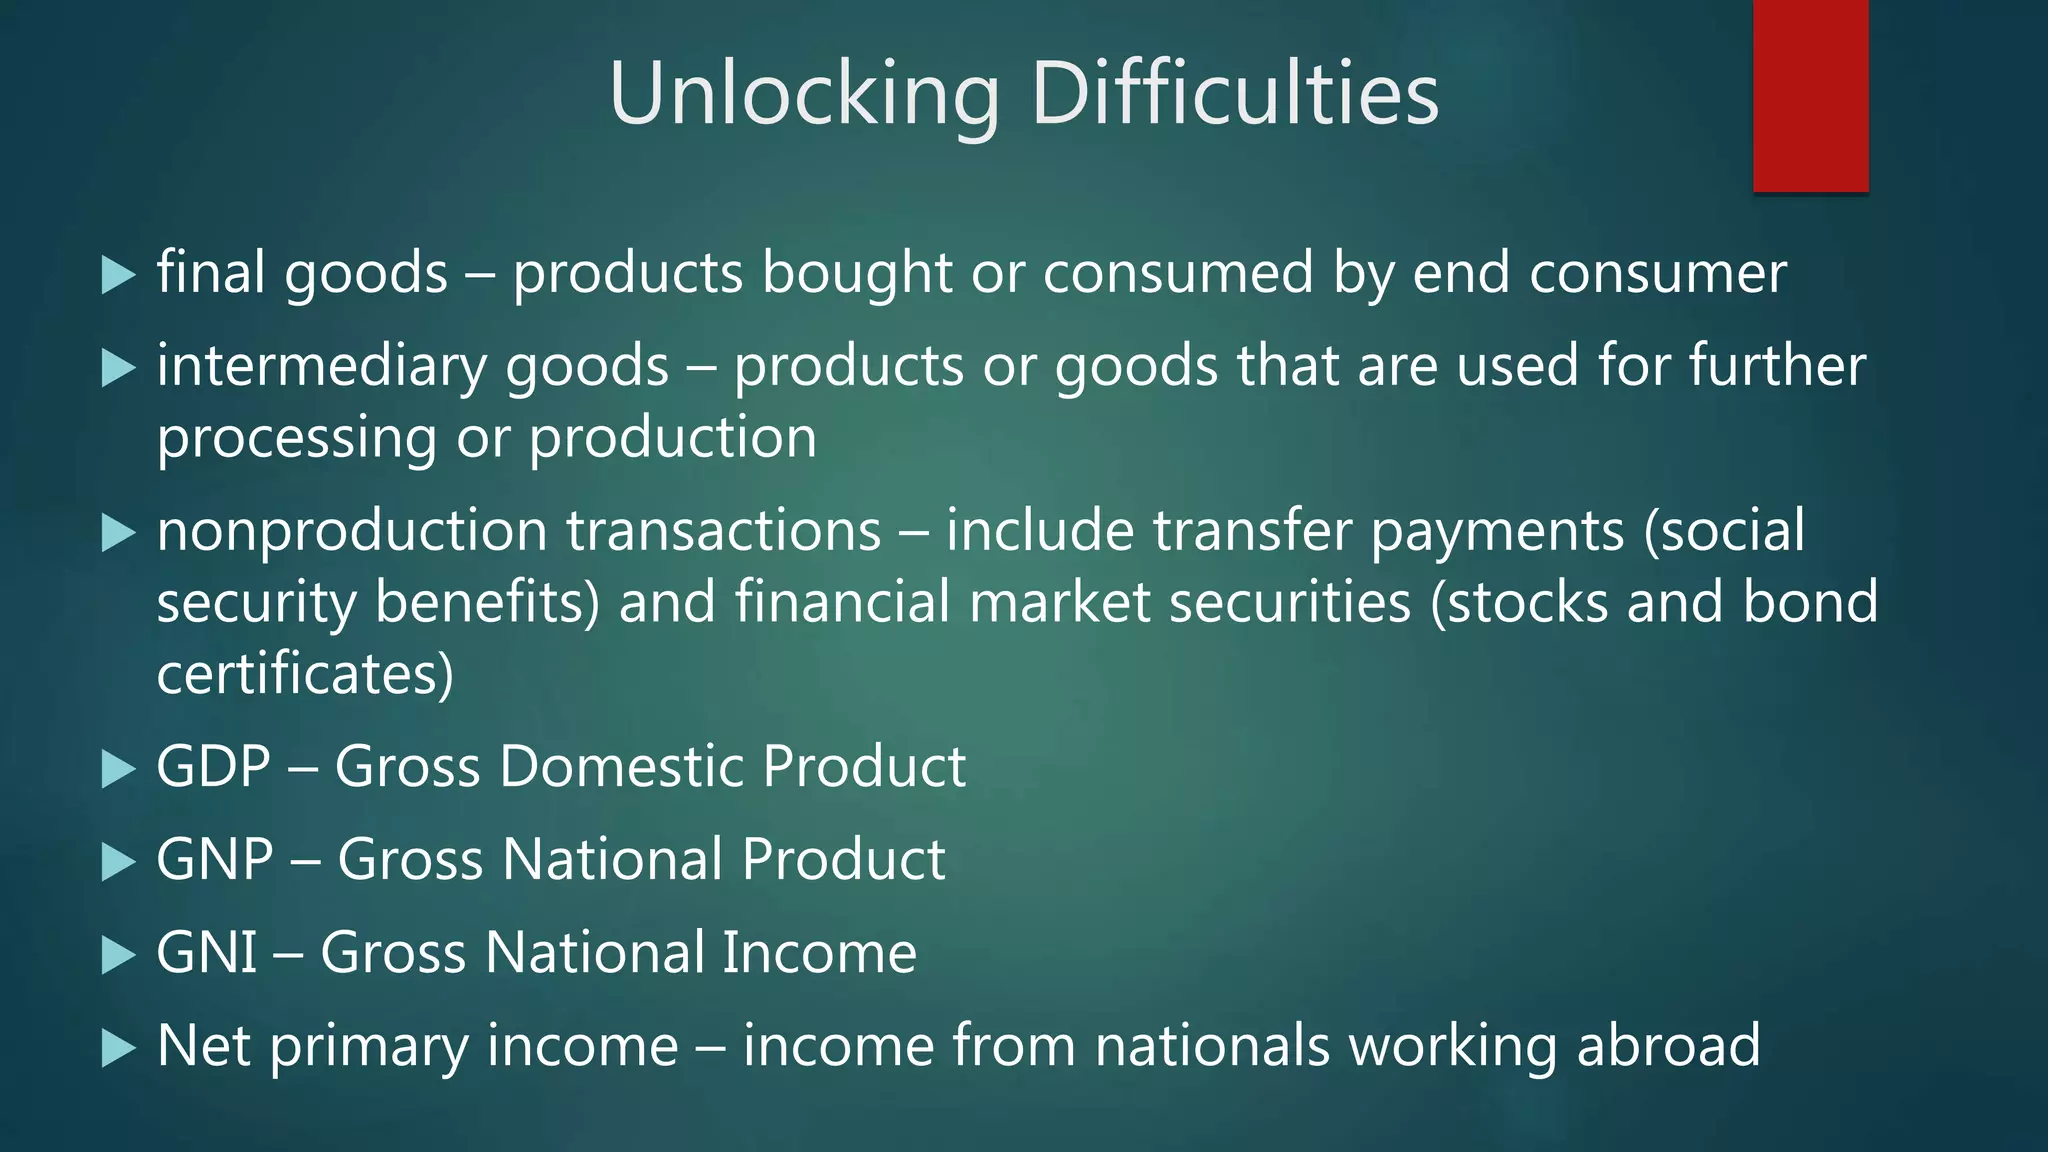
Unlocking Difficulties
finalgoods – products bought or consumed by end consumer
intermediary goods – products or goods that are used for further
processing or production
nonproduction transactions – include transfer payments (social
security benefits) and financial market securities (stocks and bond
certificates)
GDP – Gross Domestic Product
GNP – Gross National Product
GNI – Gross National Income
Net primary income – income from nationals working abroad
42.
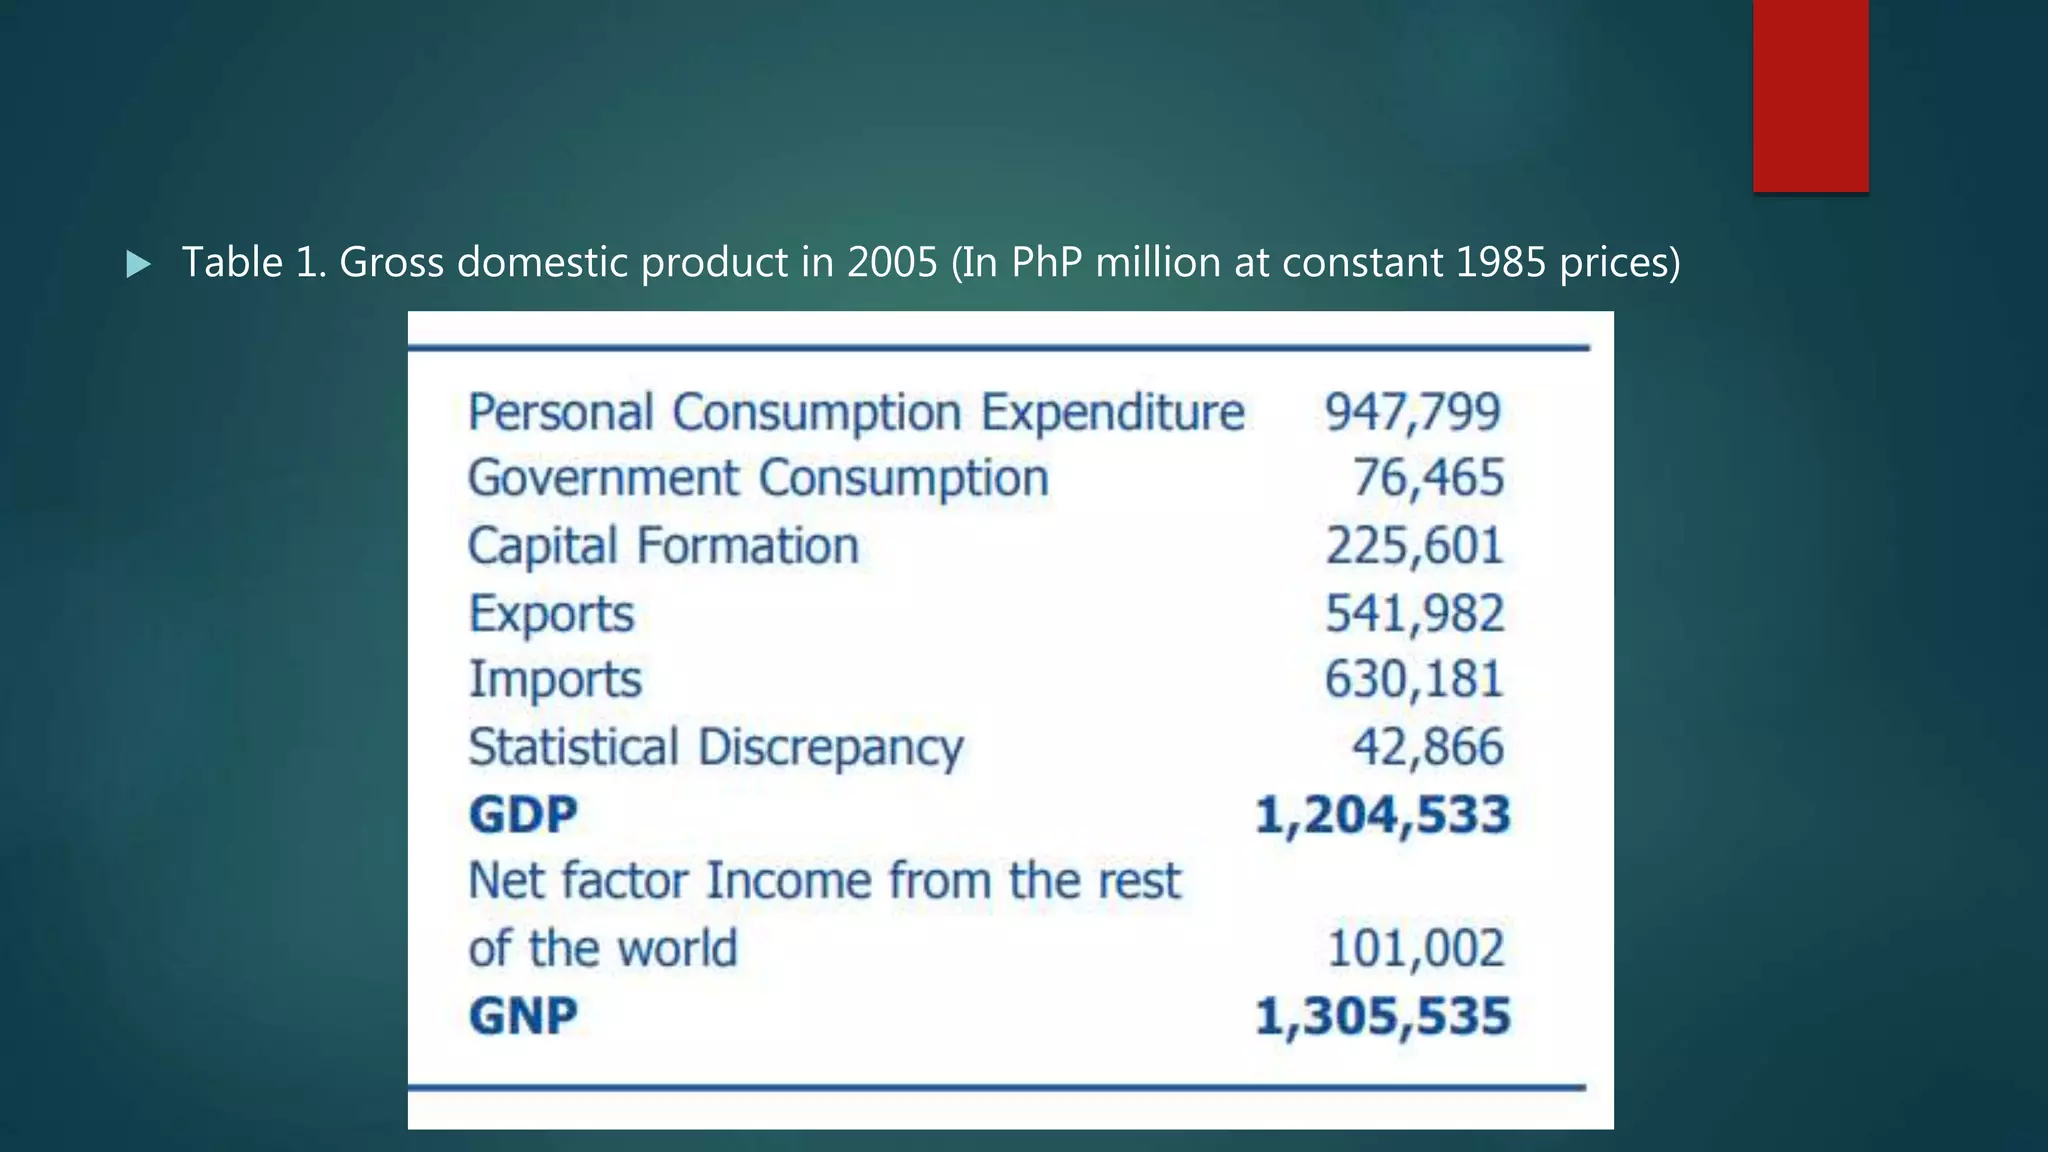
Table 1.Gross domestic product in 2005 (In PhP million at constant 1985 prices)
43.
GDP is definedas the total value of final goods
and services consumed during a given period.
This is usually expressed in Philippine Peso (Php)
Total expenditure of the economy
All final goods produced within the country are
included in the GDP
Nonproduction transactions are excluded
44.
There are fourcomponents of GDP
• Consumption
• Investment
• Government
• Foreign (X - M)
45.
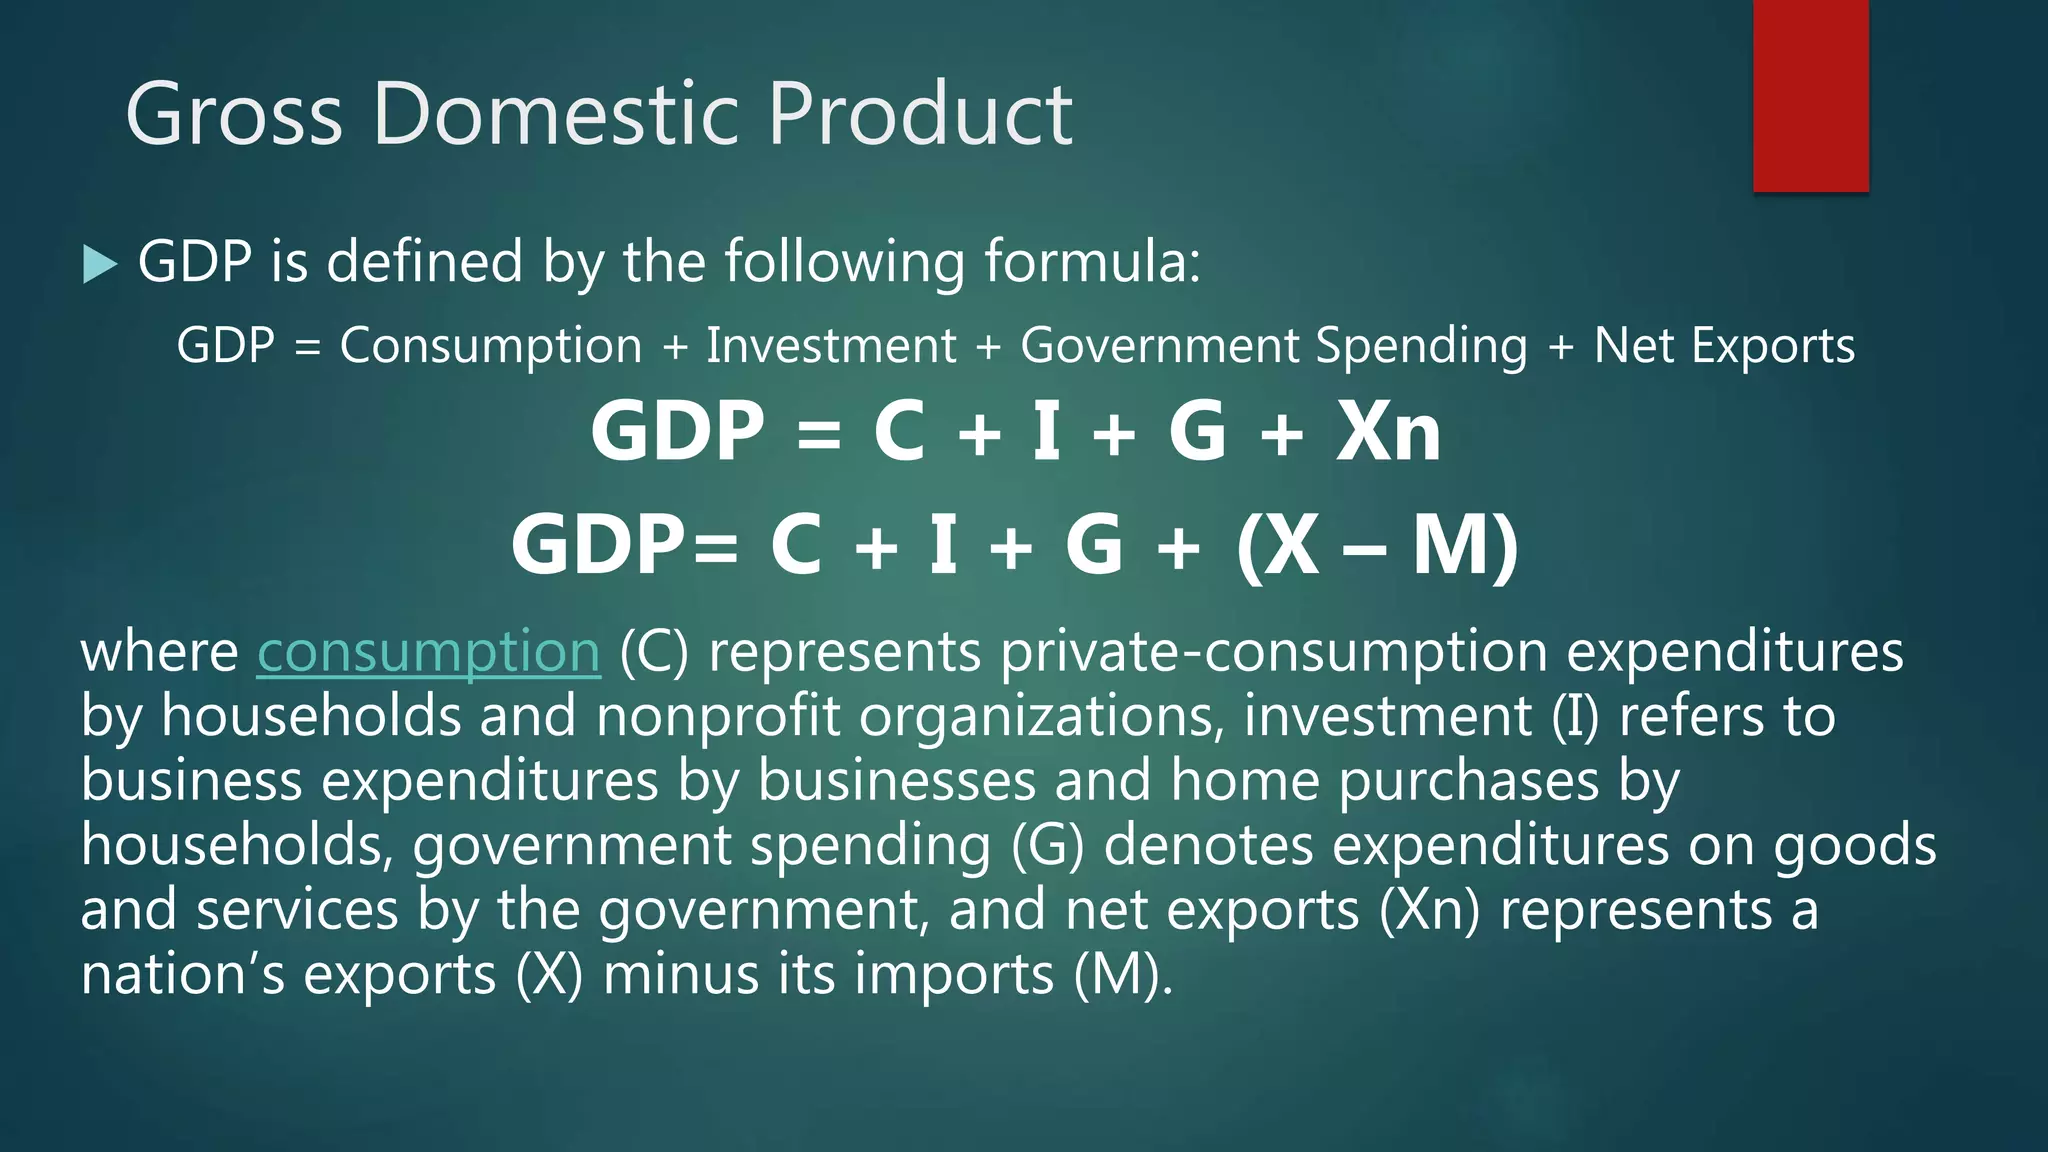
Gross Domestic Product
GDP is defined by the following formula:
GDP = Consumption + Investment + Government Spending + Net Exports
GDP = C + I + G + Xn
GDP= C + I + G + (X – M)
where consumption (C) represents private-consumption expenditures
by households and nonprofit organizations, investment (I) refers to
business expenditures by businesses and home purchases by
households, government spending (G) denotes expenditures on goods
and services by the government, and net exports (Xn) represents a
nation’s exports (X) minus its imports (M).
46.
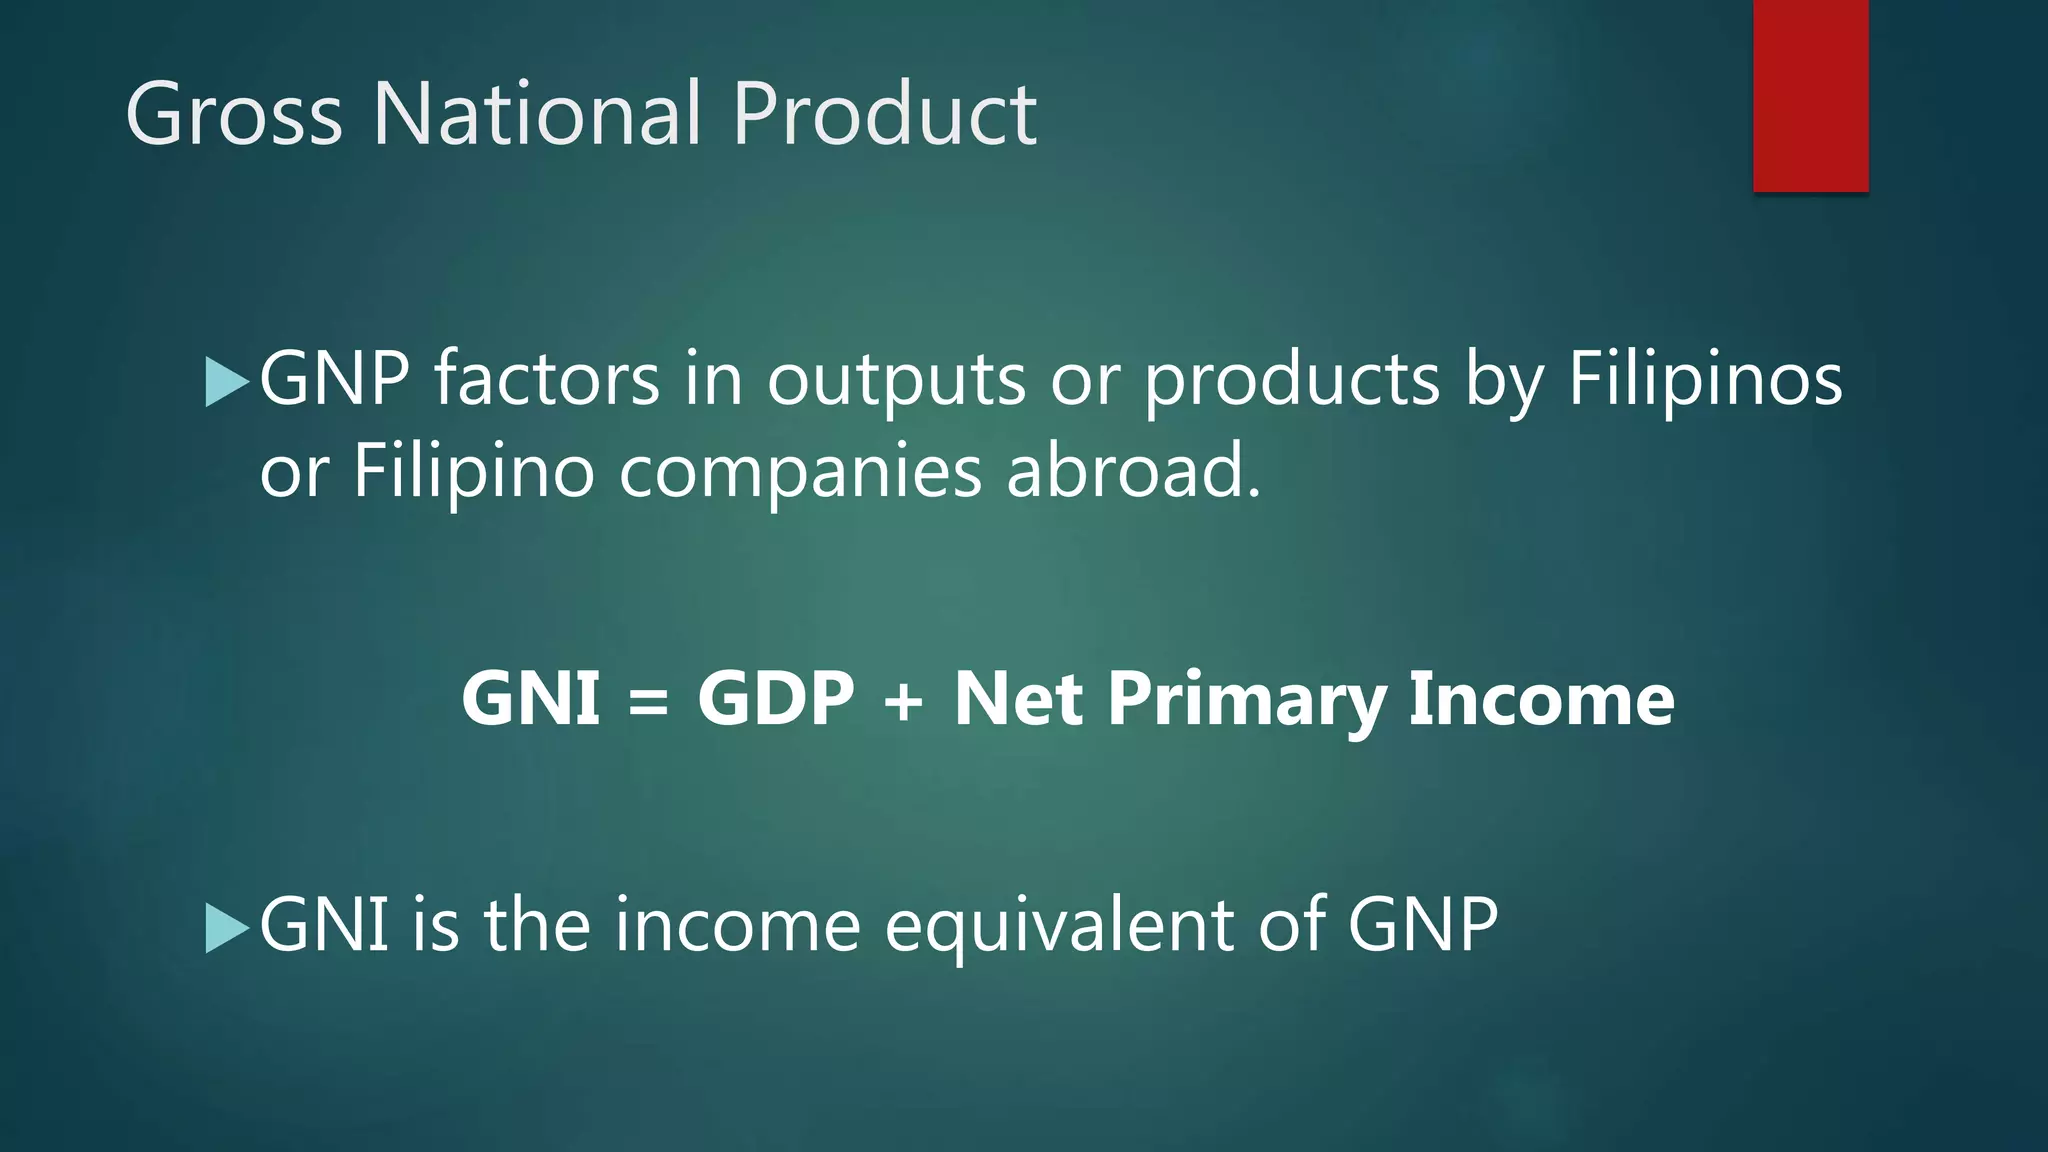
Gross National Product
GNPfactors in outputs or products by Filipinos
or Filipino companies abroad.
GNI = GDP + Net Primary Income
GNI is the income equivalent of GNP
47.
GNP vs GDP
GDPis made in the Philippines while
GNP is made by Filipinos.
48.
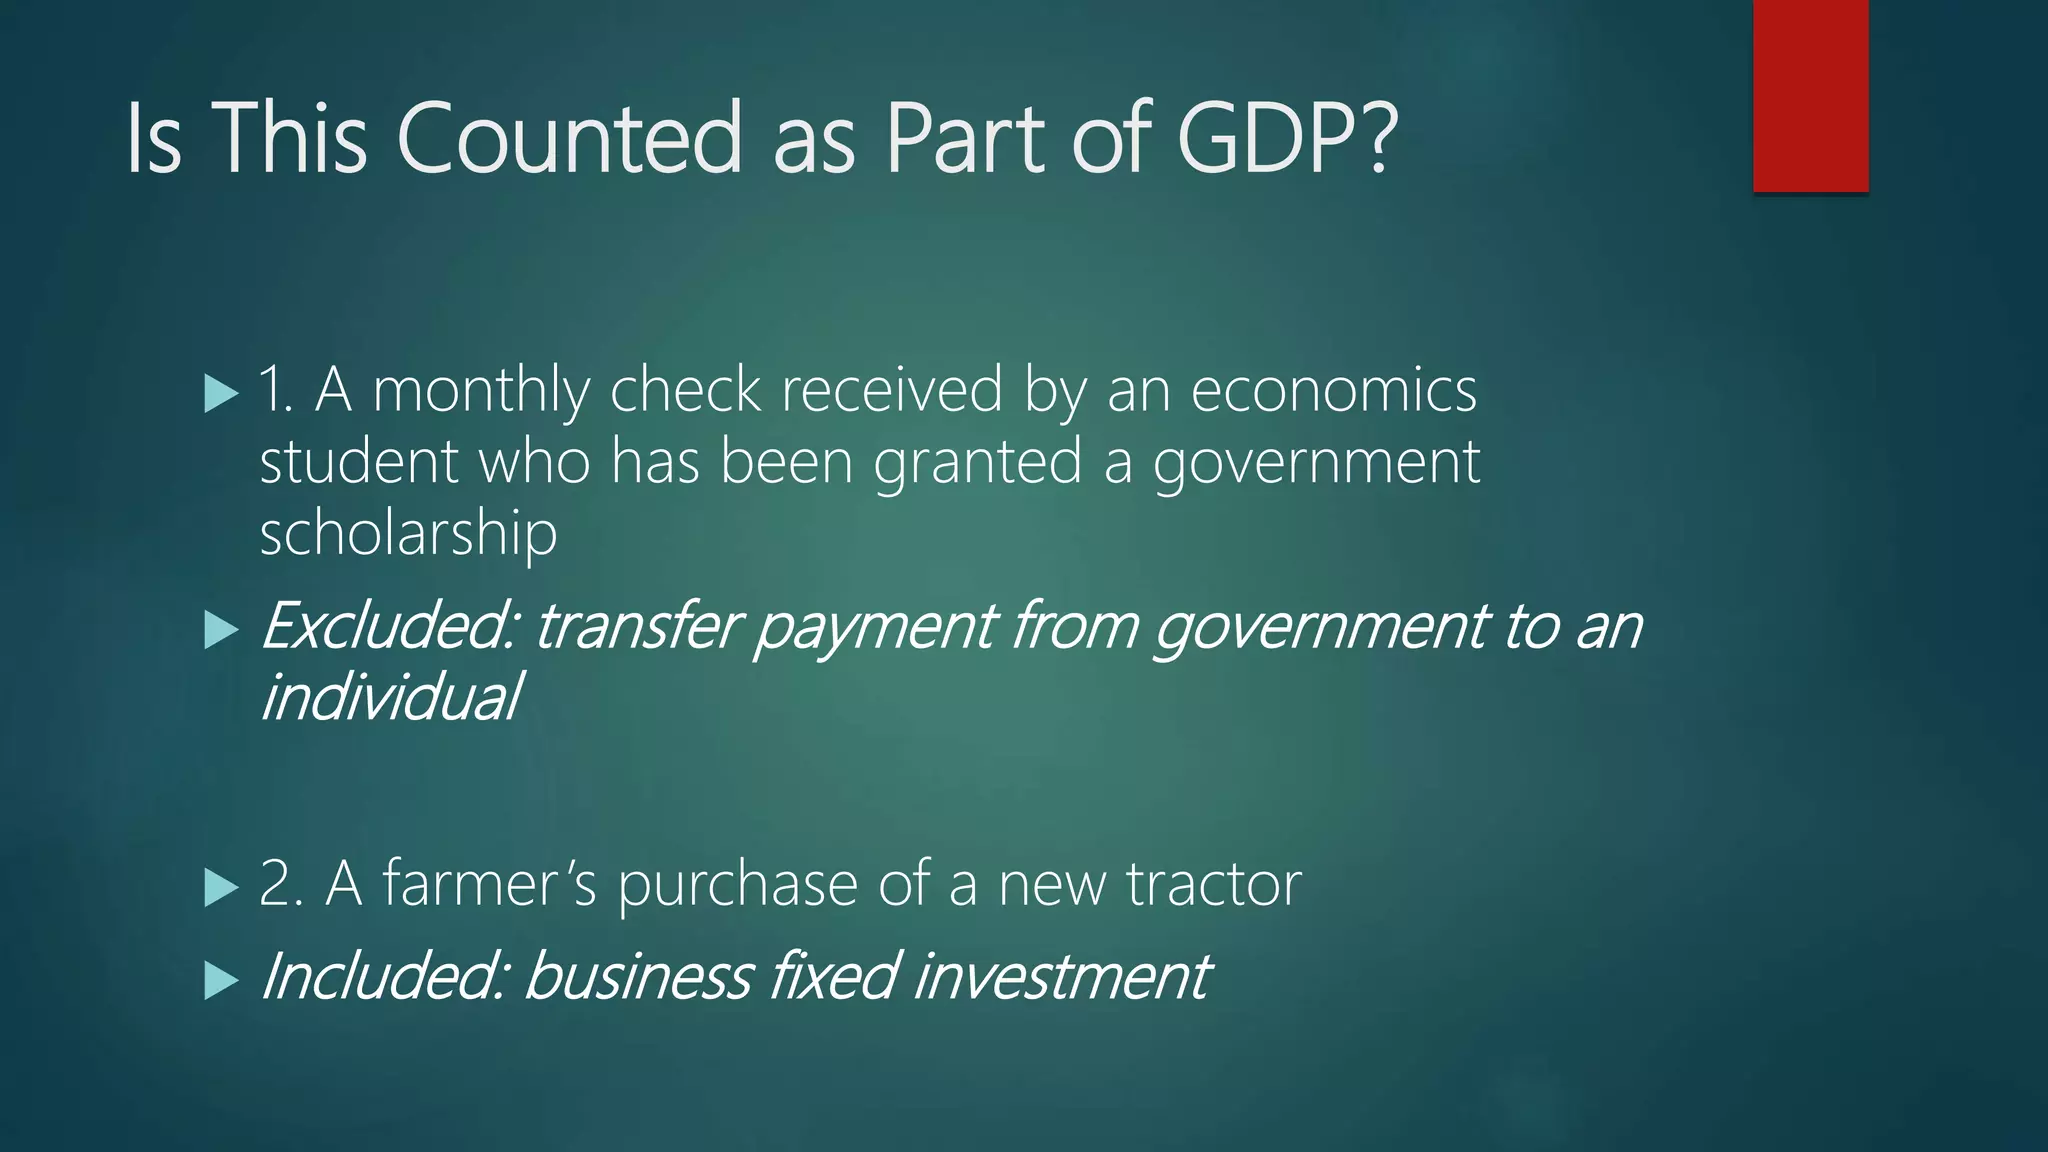
Is This Countedas Part of GDP?
1. A monthly check received by an economics
student who has been granted a government
scholarship
Excluded: transfer payment from government to an
individual
2. A farmer’s purchase of a new tractor
Included: business fixed investment
49.
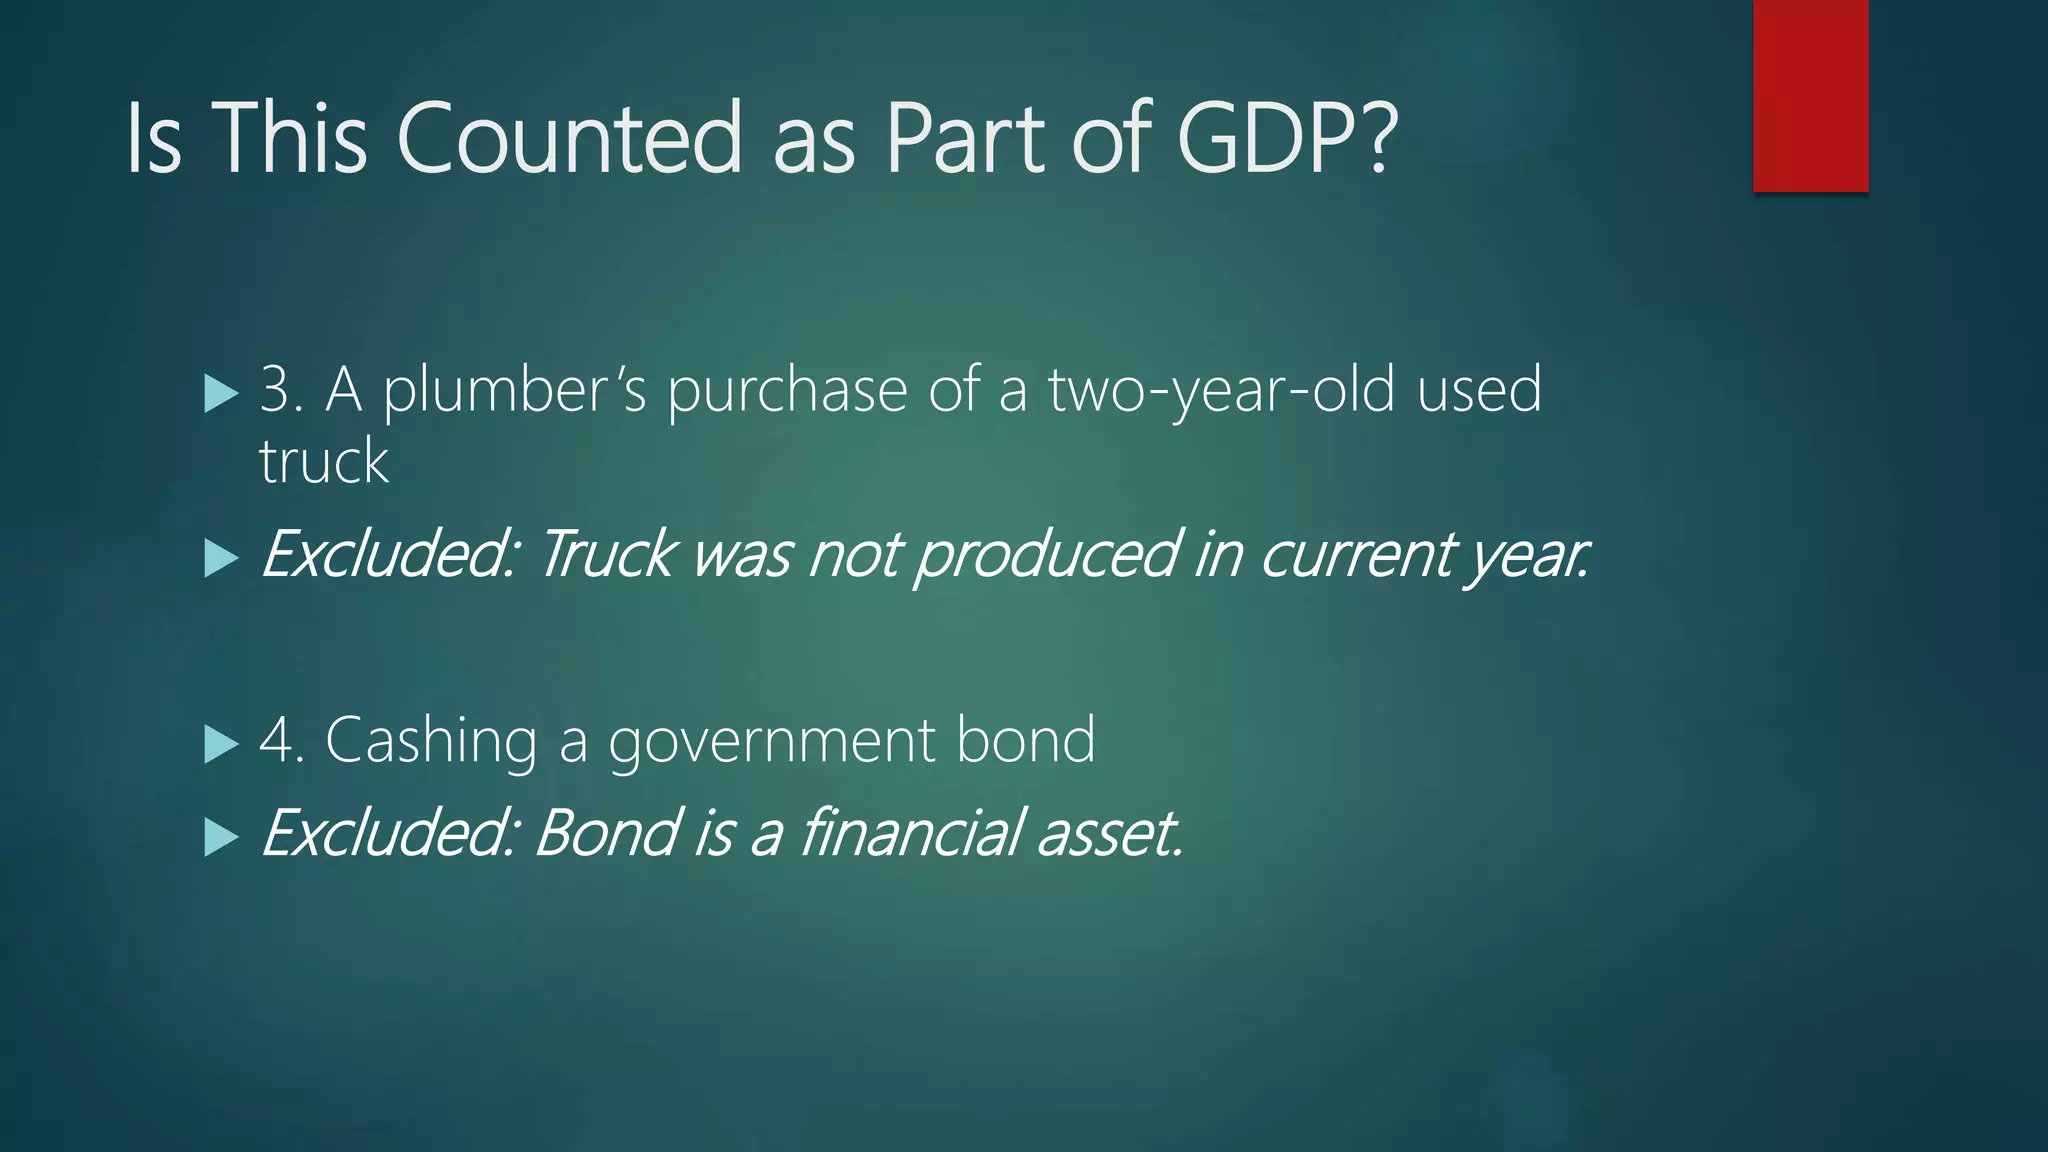
Is This Countedas Part of GDP?
3. A plumber’s purchase of a two-year-old used
truck
Excluded: Truck was not produced in current year.
4. Cashing a government bond
Excluded: Bond is a financial asset.
50.
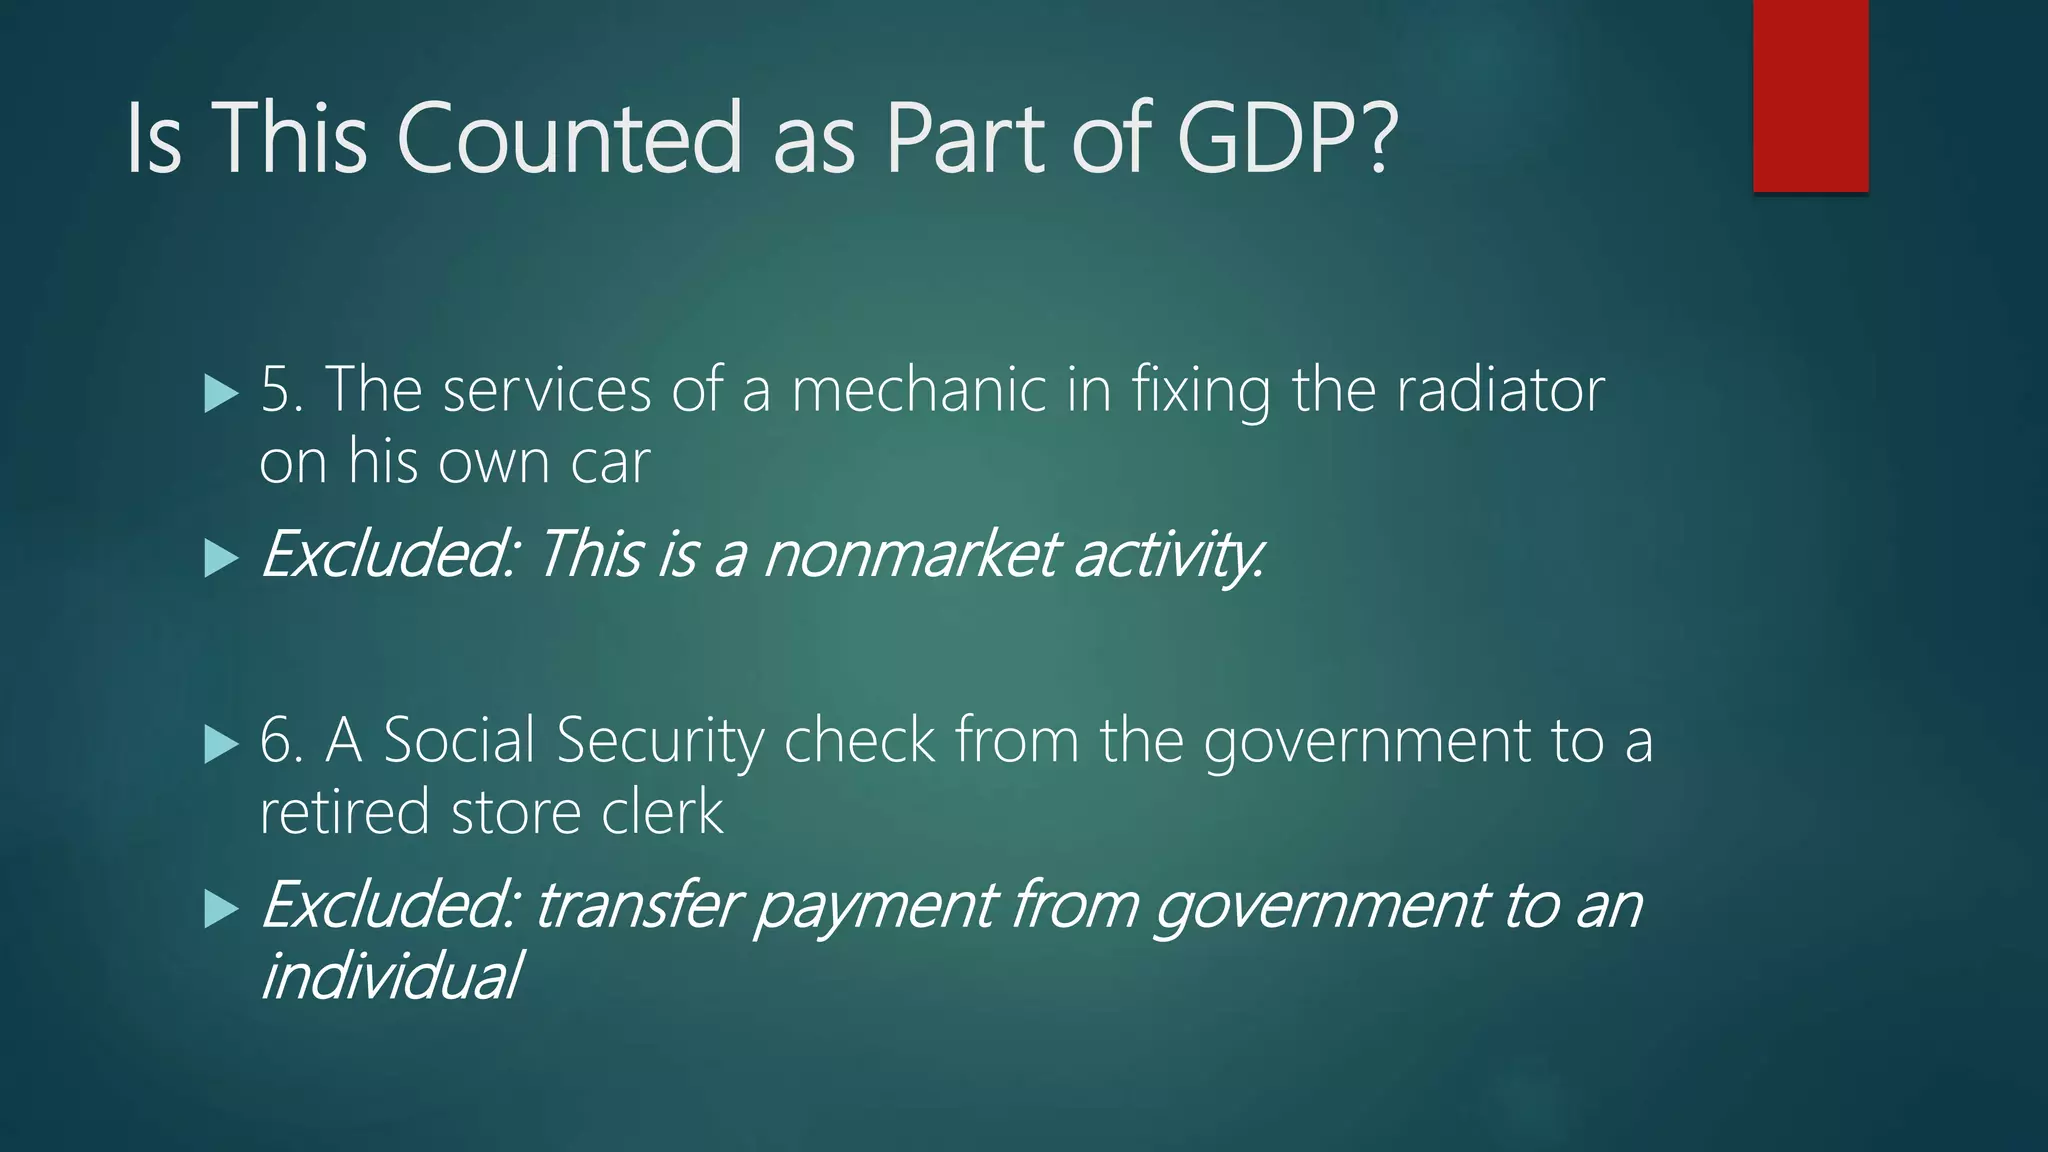
Is This Countedas Part of GDP?
5. The services of a mechanic in fixing the radiator
on his own car
Excluded: This is a nonmarket activity.
6. A Social Security check from the government to a
retired store clerk
Excluded: transfer payment from government to an
individual
51.
Is This Countedas Part of GDP?
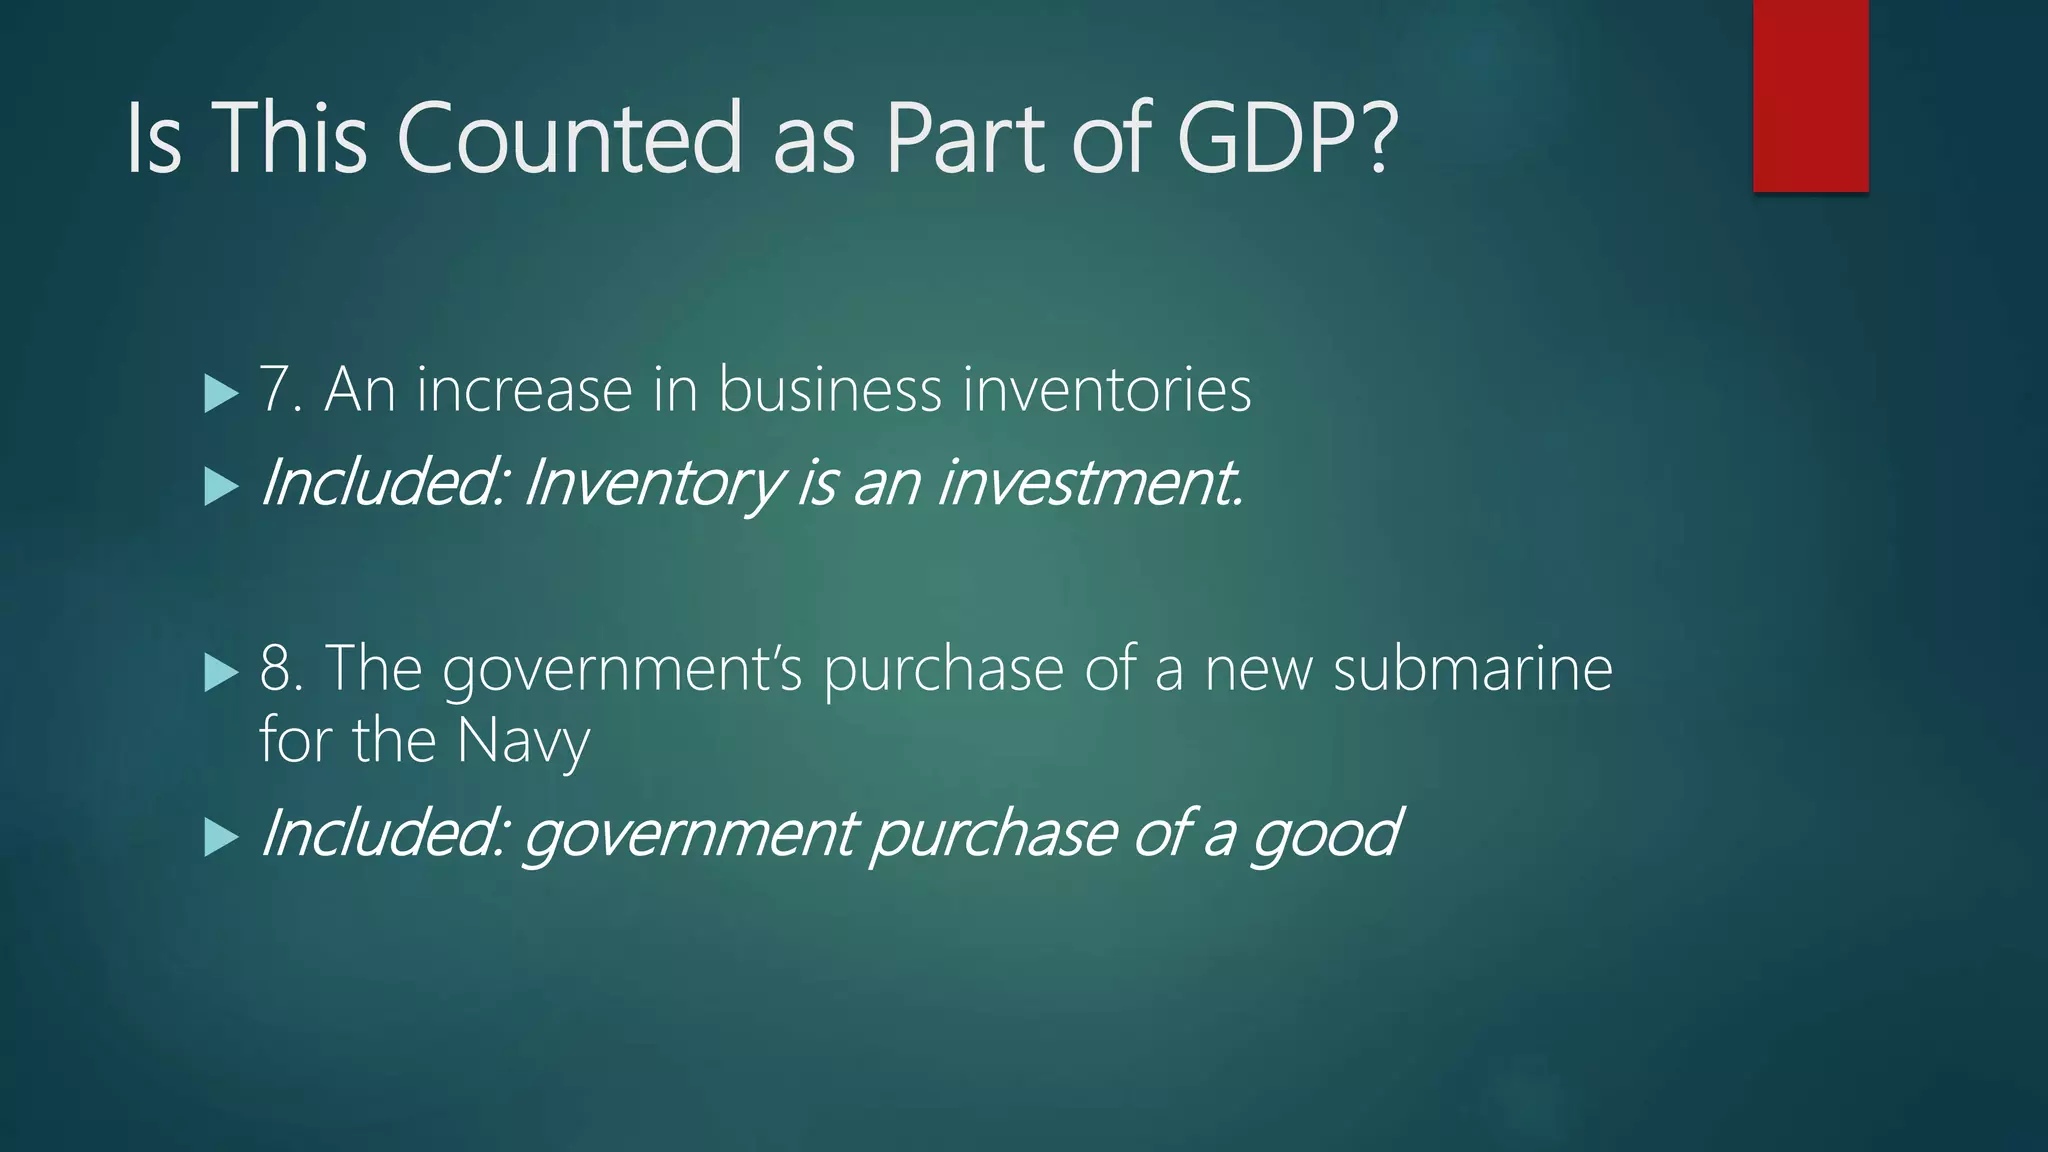
7. An increase in business inventories
Included: Inventory is an investment.
8. The government’s purchase of a new submarine
for the Navy
Included: government purchase of a good
52.
Is This Countedas Part of GDP?
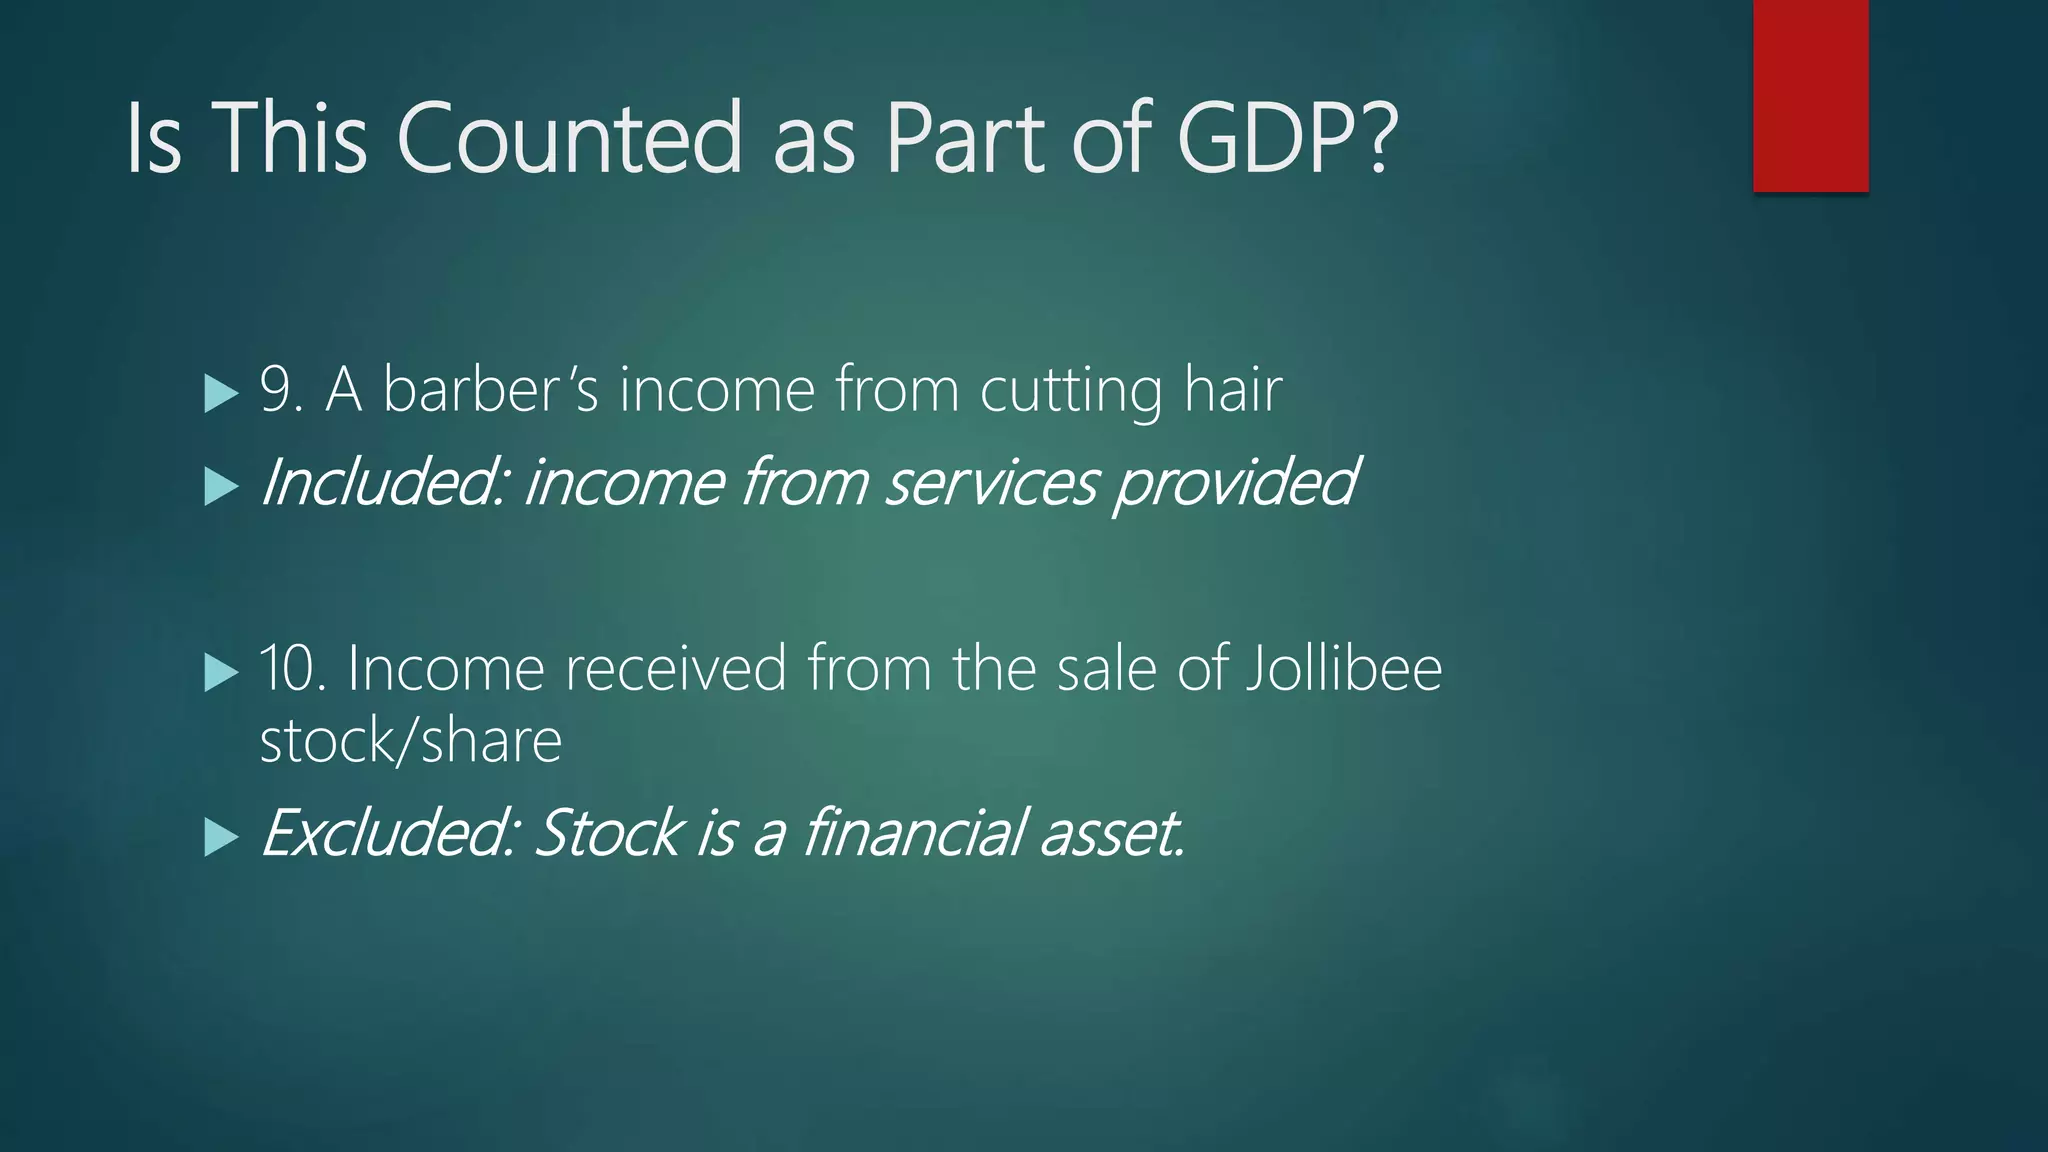
9. A barber’s income from cutting hair
Included: income from services provided
10. Income received from the sale of Jollibee
stock/share
Excluded: Stock is a financial asset.
53.
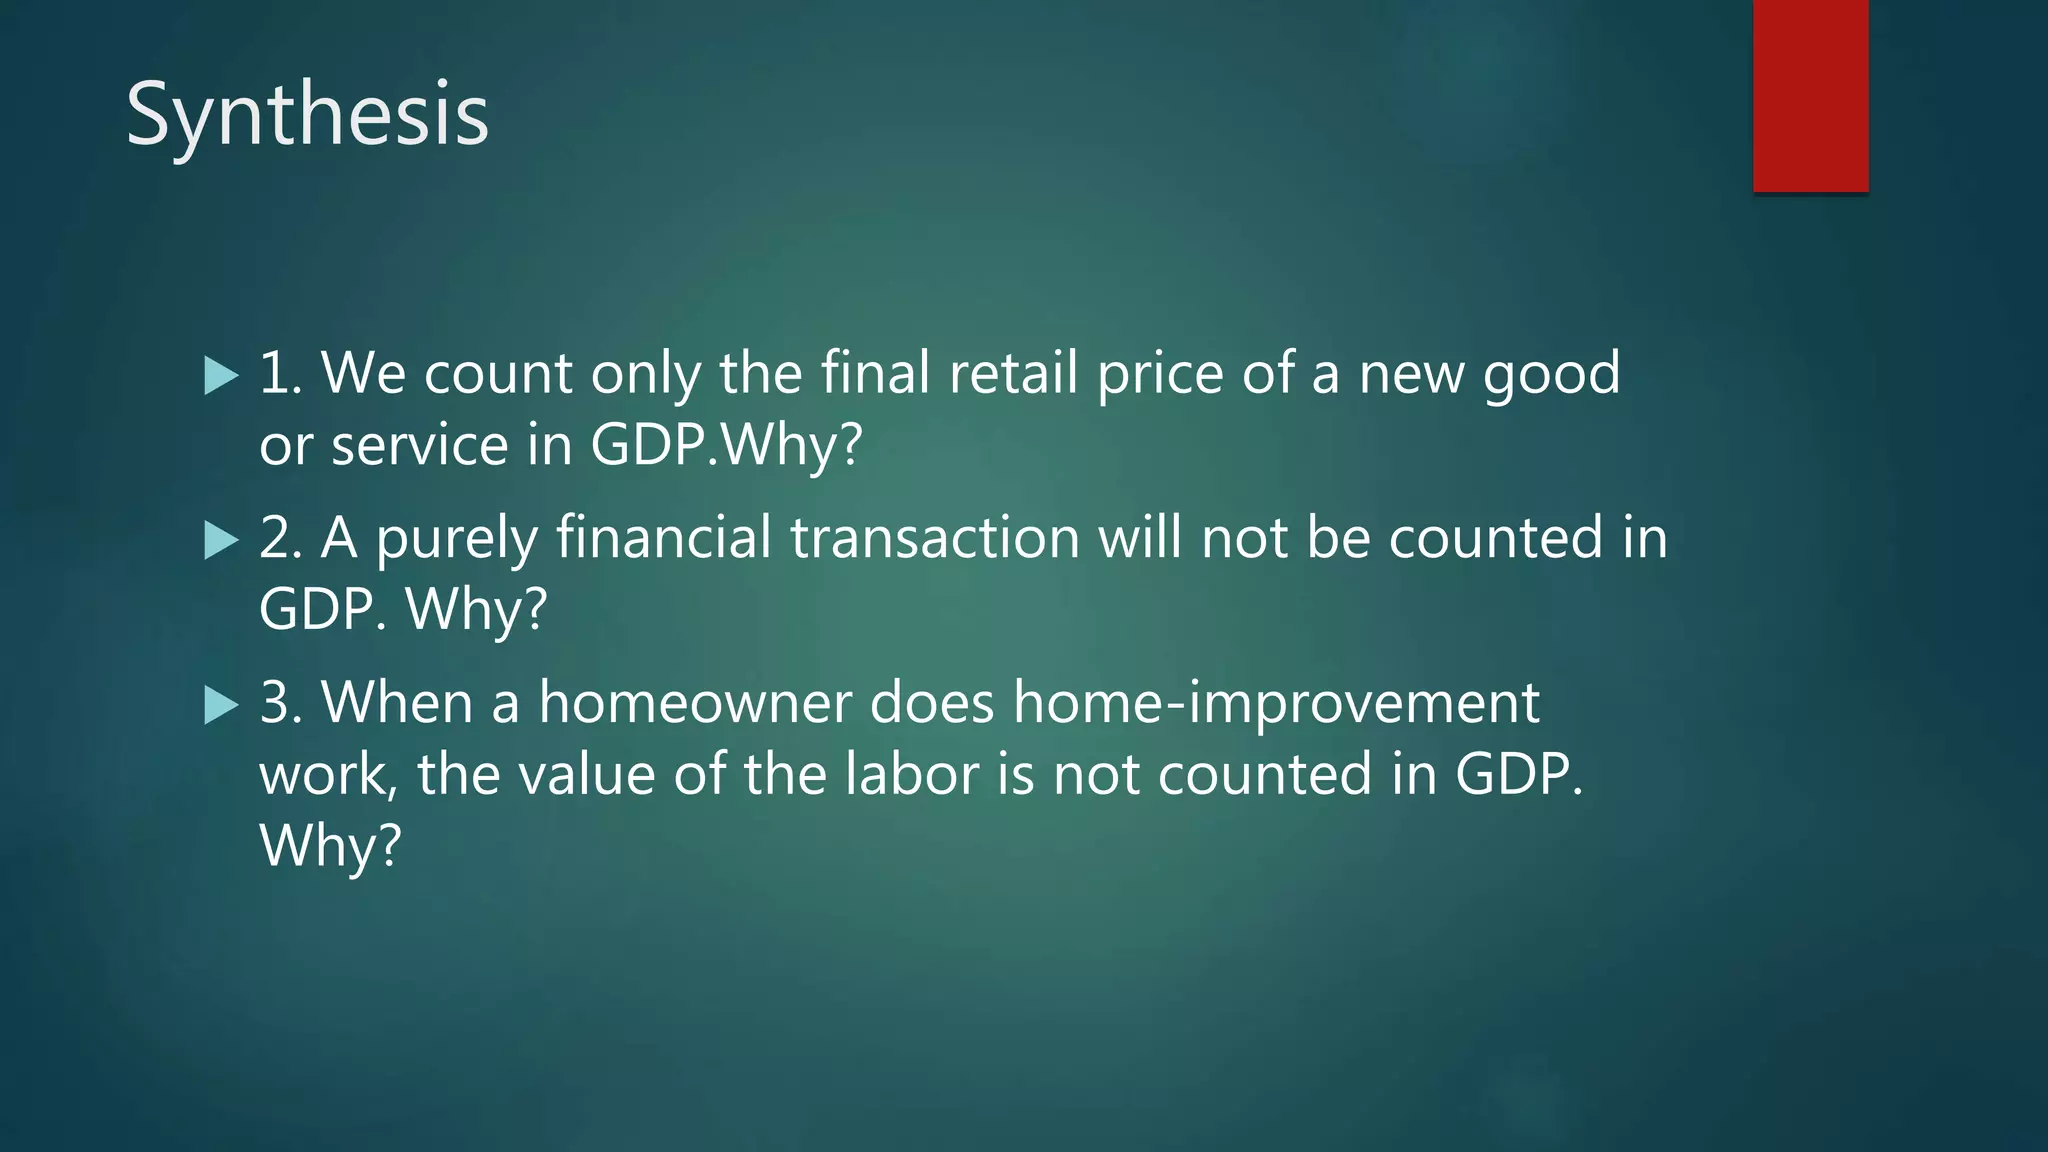
Synthesis
1. Wecount only the final retail price of a new good
or service in GDP.Why?
2. A purely financial transaction will not be counted in
GDP. Why?
3. When a homeowner does home-improvement
work, the value of the labor is not counted in GDP.
Why?
54.
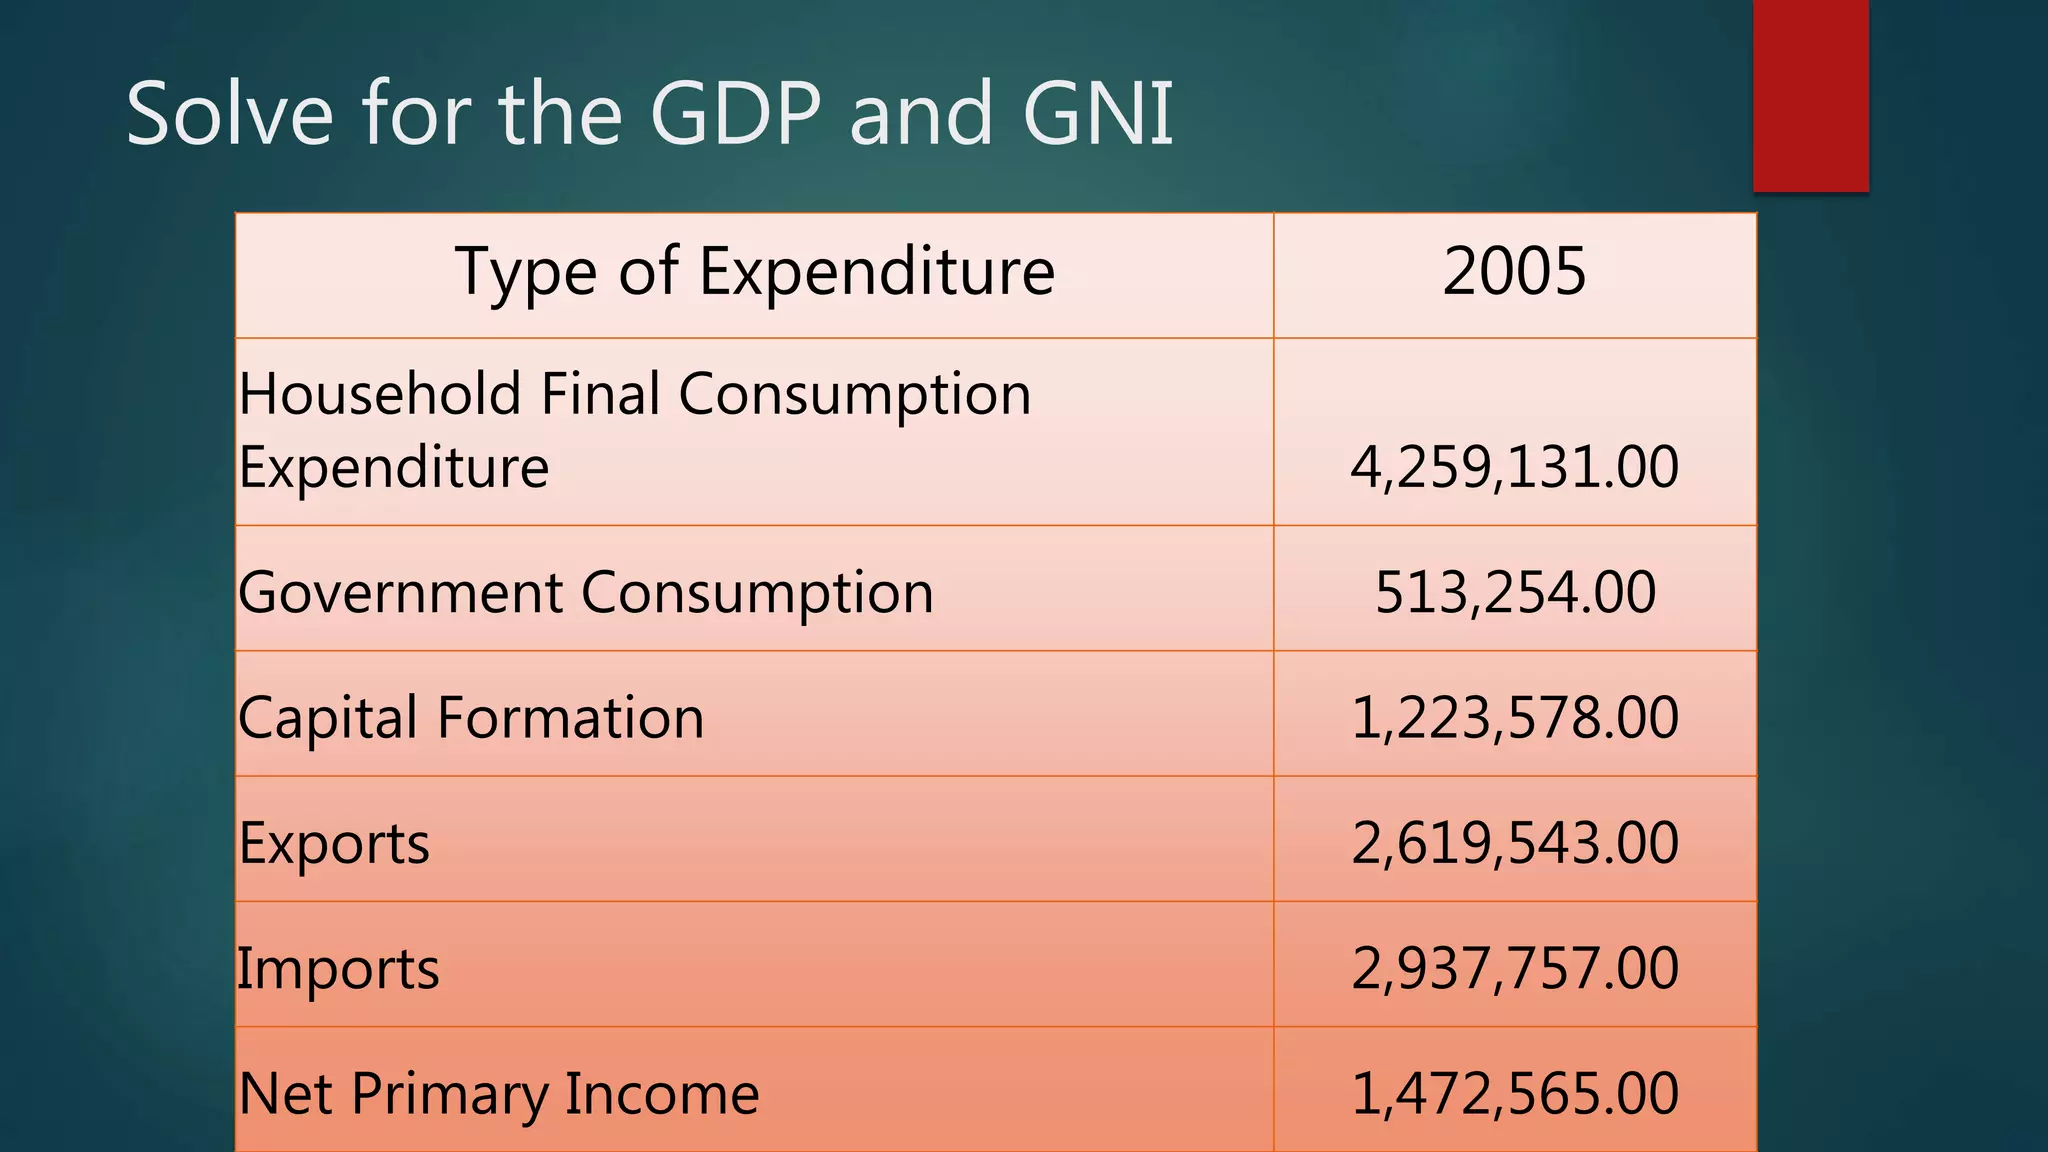
Solve for theGDP and GNI
Type of Expenditure 2005
Household Final Consumption
Expenditure 4,259,131.00
Government Consumption 513,254.00
Capital Formation 1,223,578.00
Exports 2,619,543.00
Imports 2,937,757.00
Net Primary Income 1,472,565.00
55.
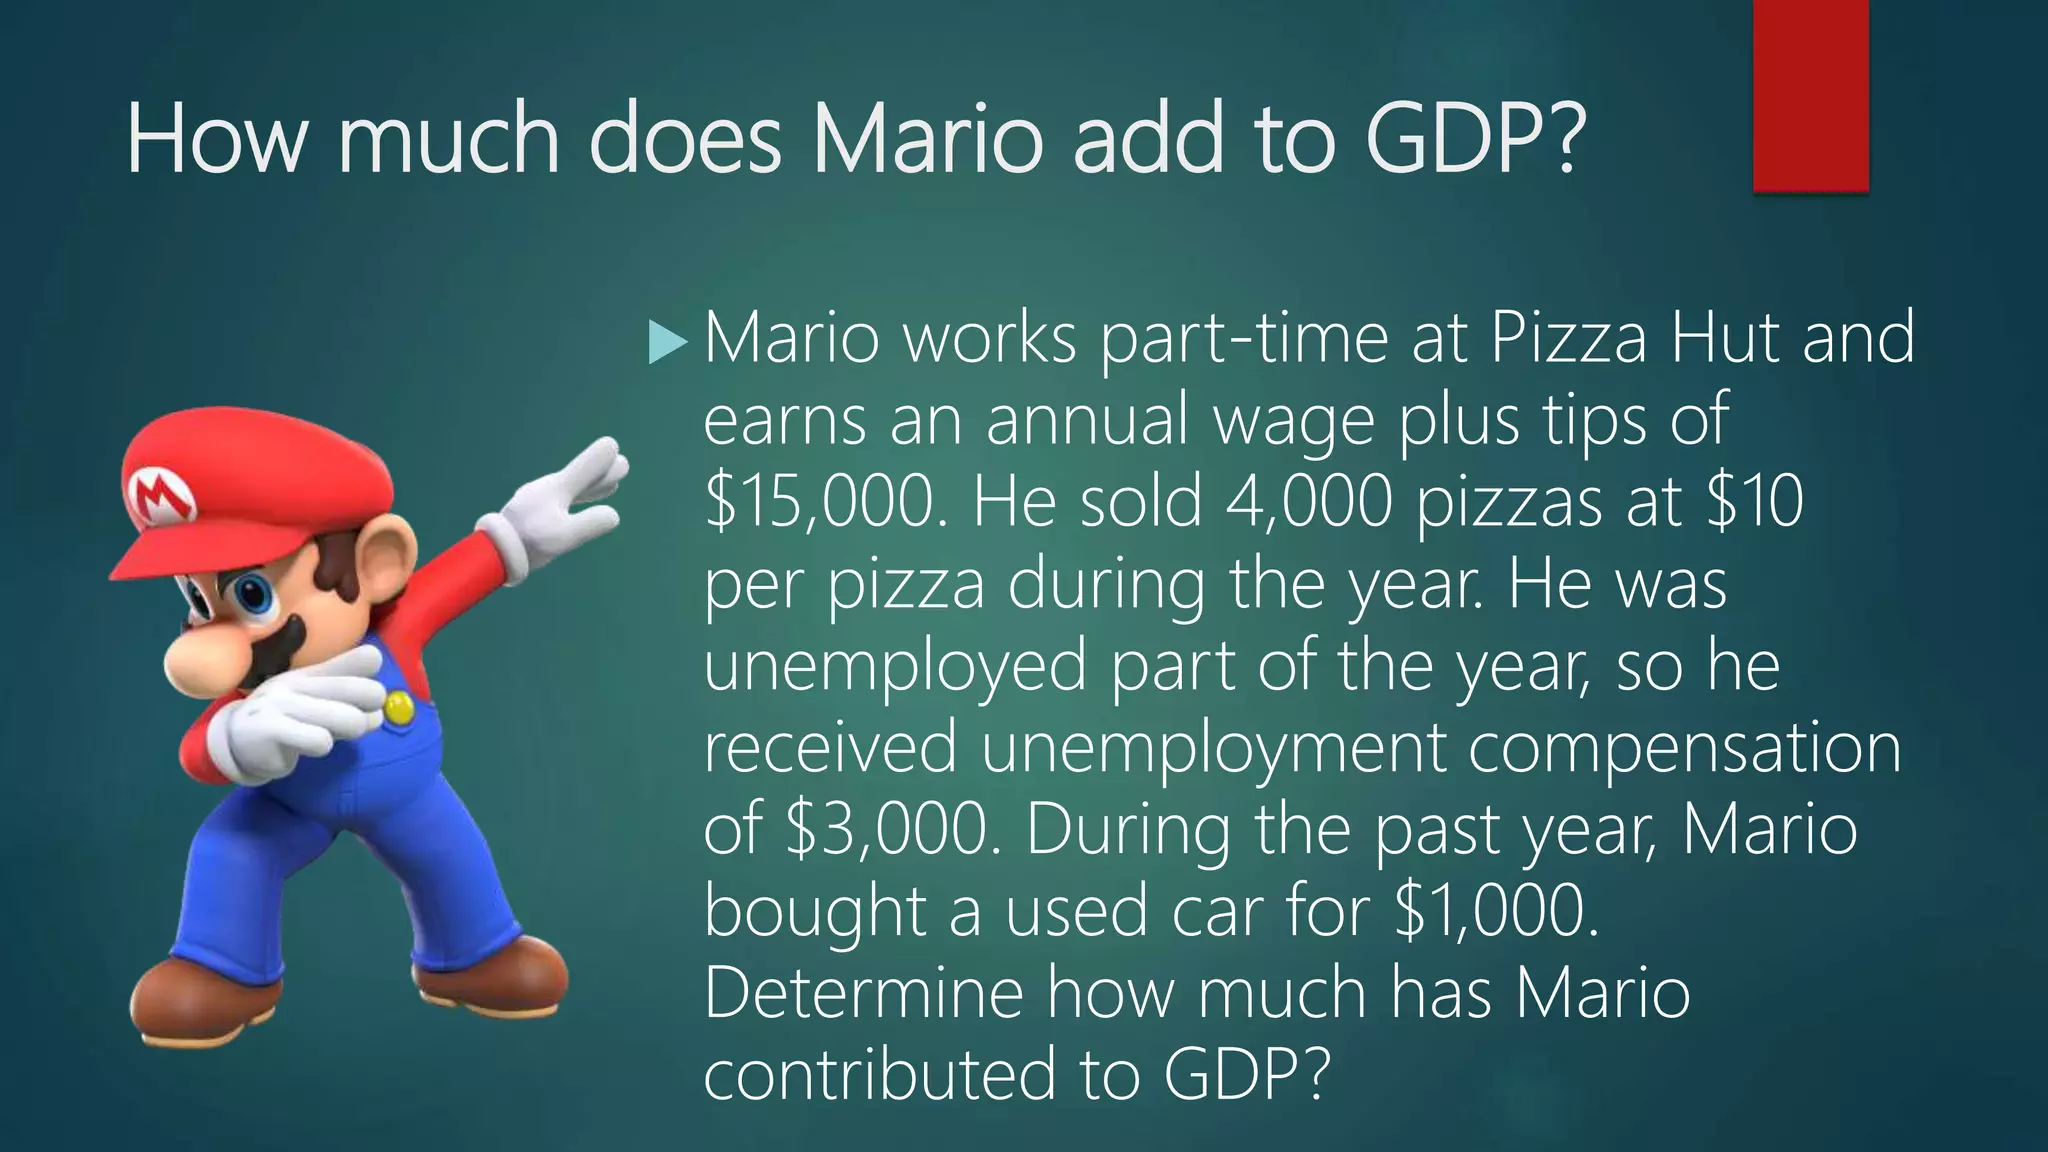
How much doesMario add to GDP?
Mario works part-time at Pizza Hut and
earns an annual wage plus tips of
$15,000. He sold 4,000 pizzas at $10
per pizza during the year. He was
unemployed part of the year, so he
received unemployment compensation
of $3,000. During the past year, Mario
bought a used car for $1,000.
Determine how much has Mario
contributed to GDP?
56.
Assignment
Read thearticle entitled, “Venezuela: the land of 500% inflation”
http://money.cnn.com/2016/04/12/news/economy/venezuela-imf-
economy/index.html
57.
• Inflation isthe rate at which the general level of prices
for goods and services is rising and, consequently, the
purchasing power of currency is falling.
58.
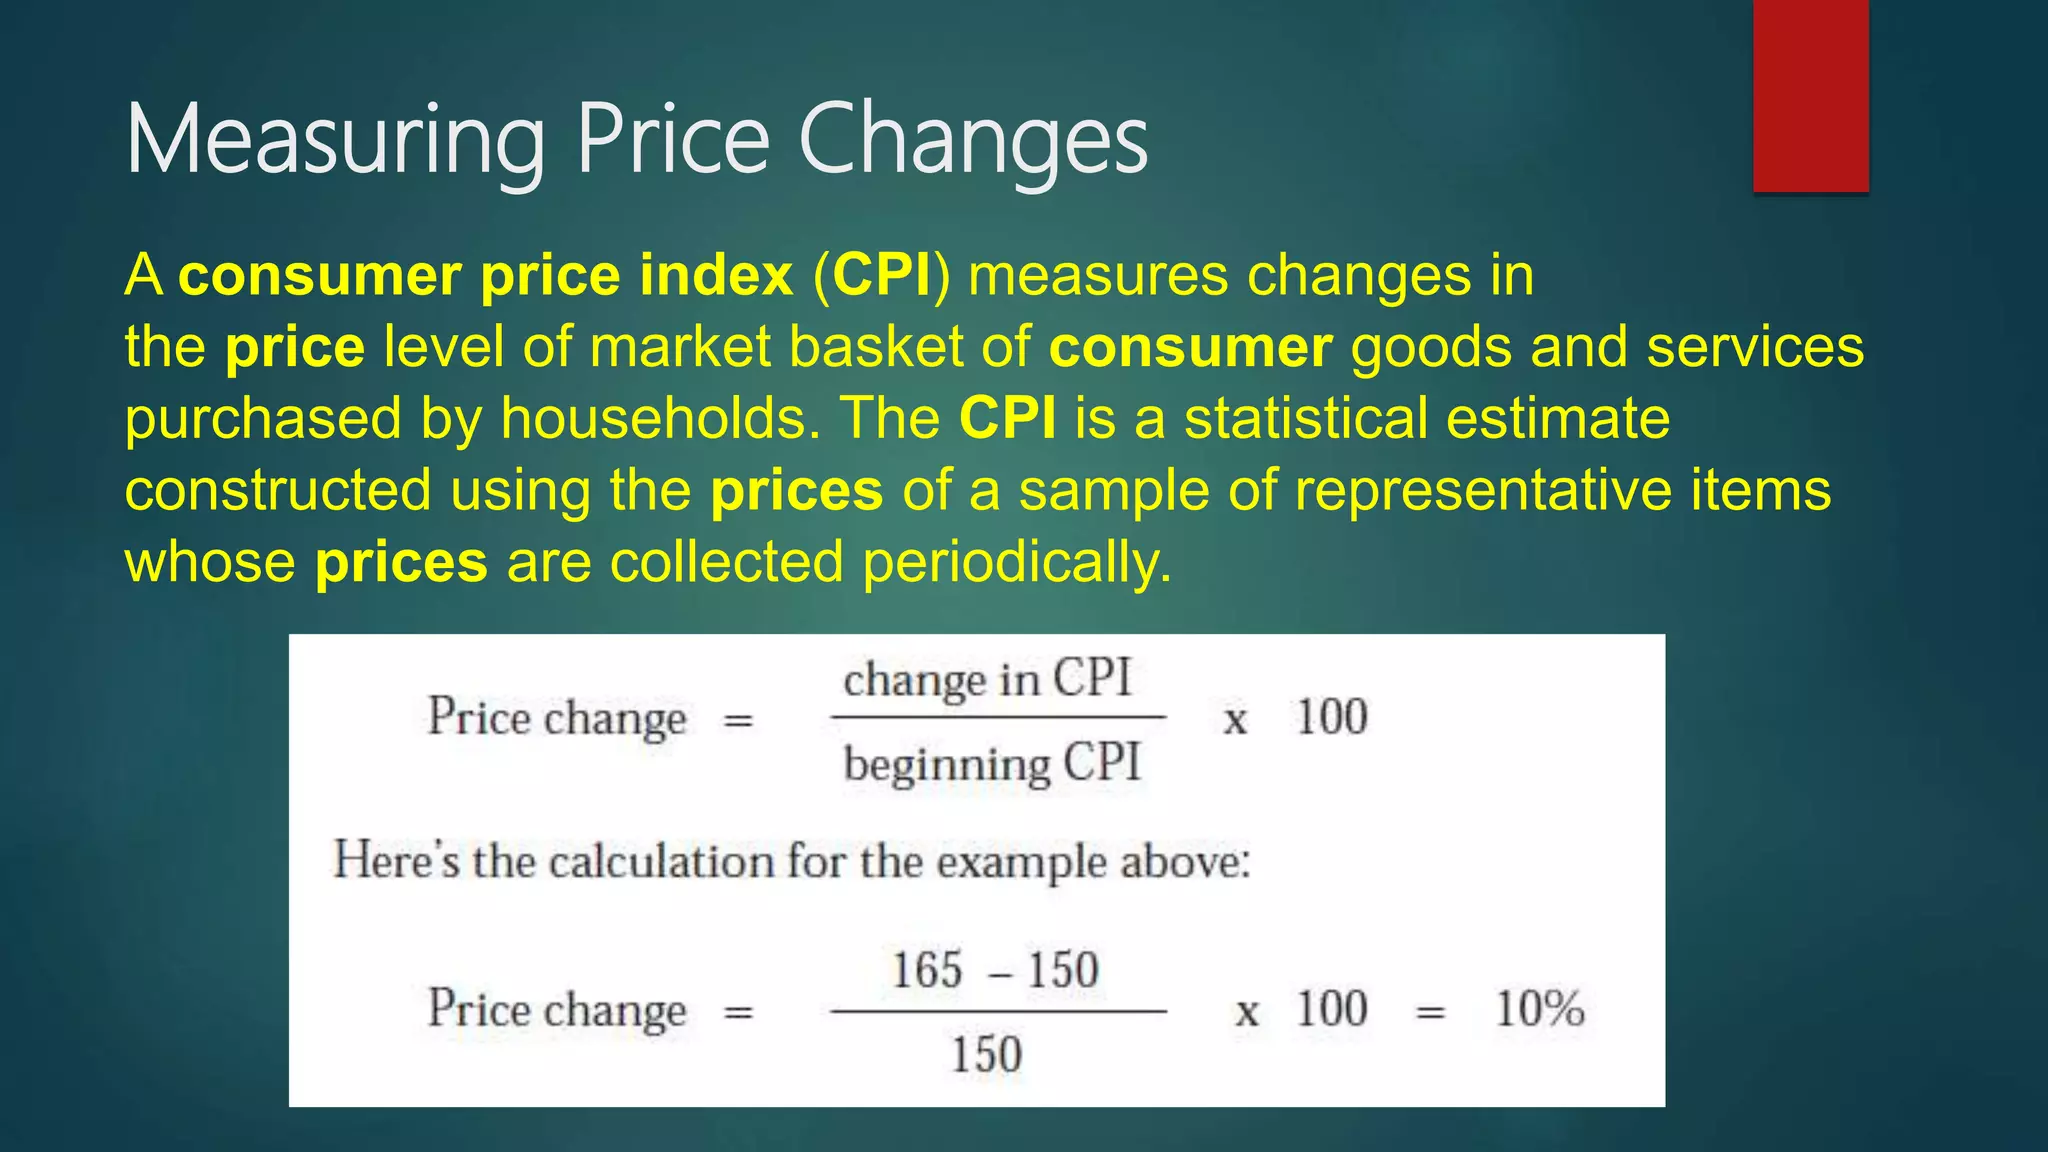
Measuring Price Changes
Aconsumer price index (CPI) measures changes in
the price level of market basket of consumer goods and services
purchased by households. The CPI is a statistical estimate
constructed using the prices of a sample of representative items
whose prices are collected periodically.
59.
1. Whatis the total cost of buying all the items in Year 2?
$580
2. What is the CPI for Year 2?
120.8 [(580 / 480) x 100]
60.
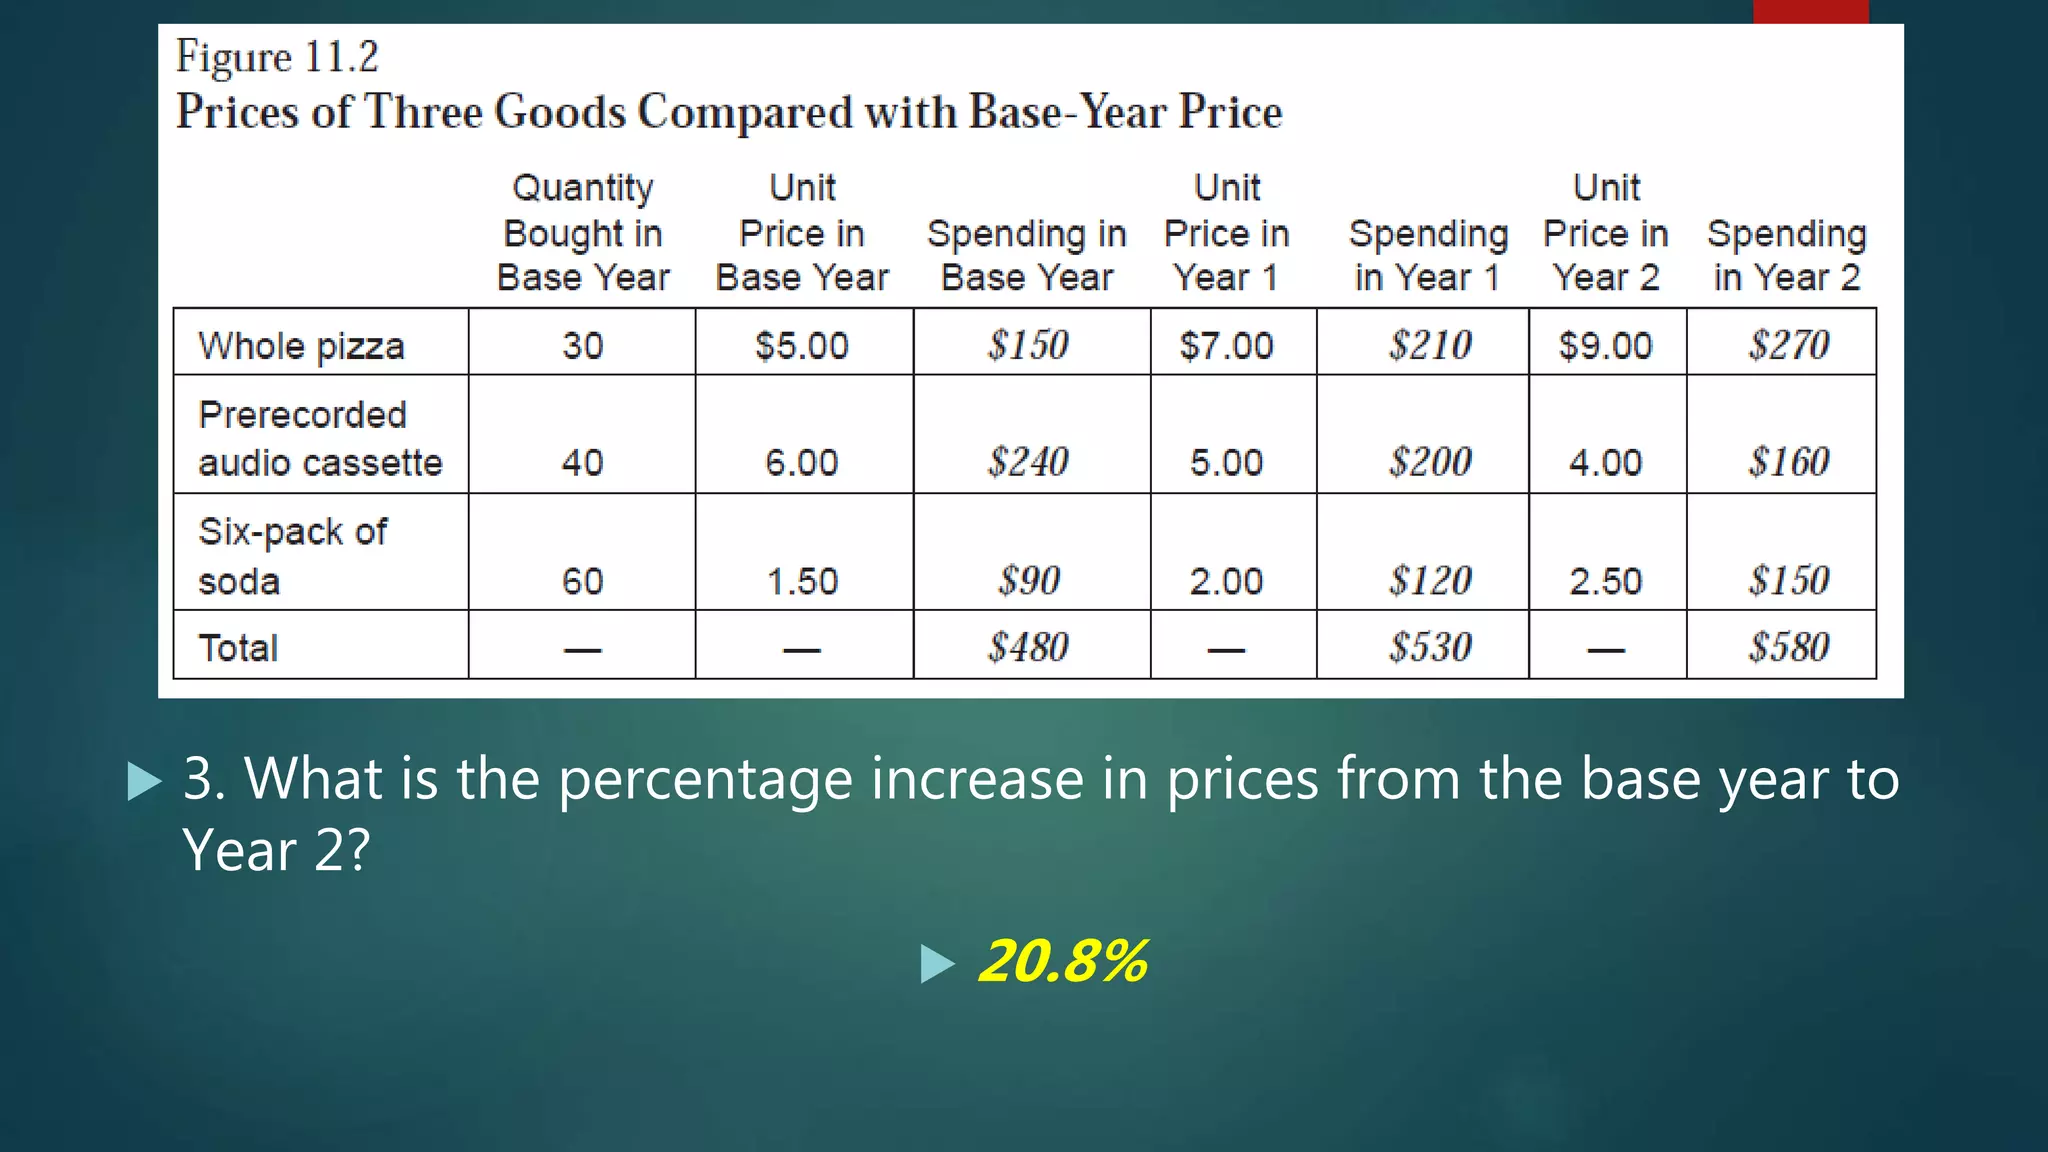
3. Whatis the percentage increase in prices from the base year to
Year 2?
20.8%
61.
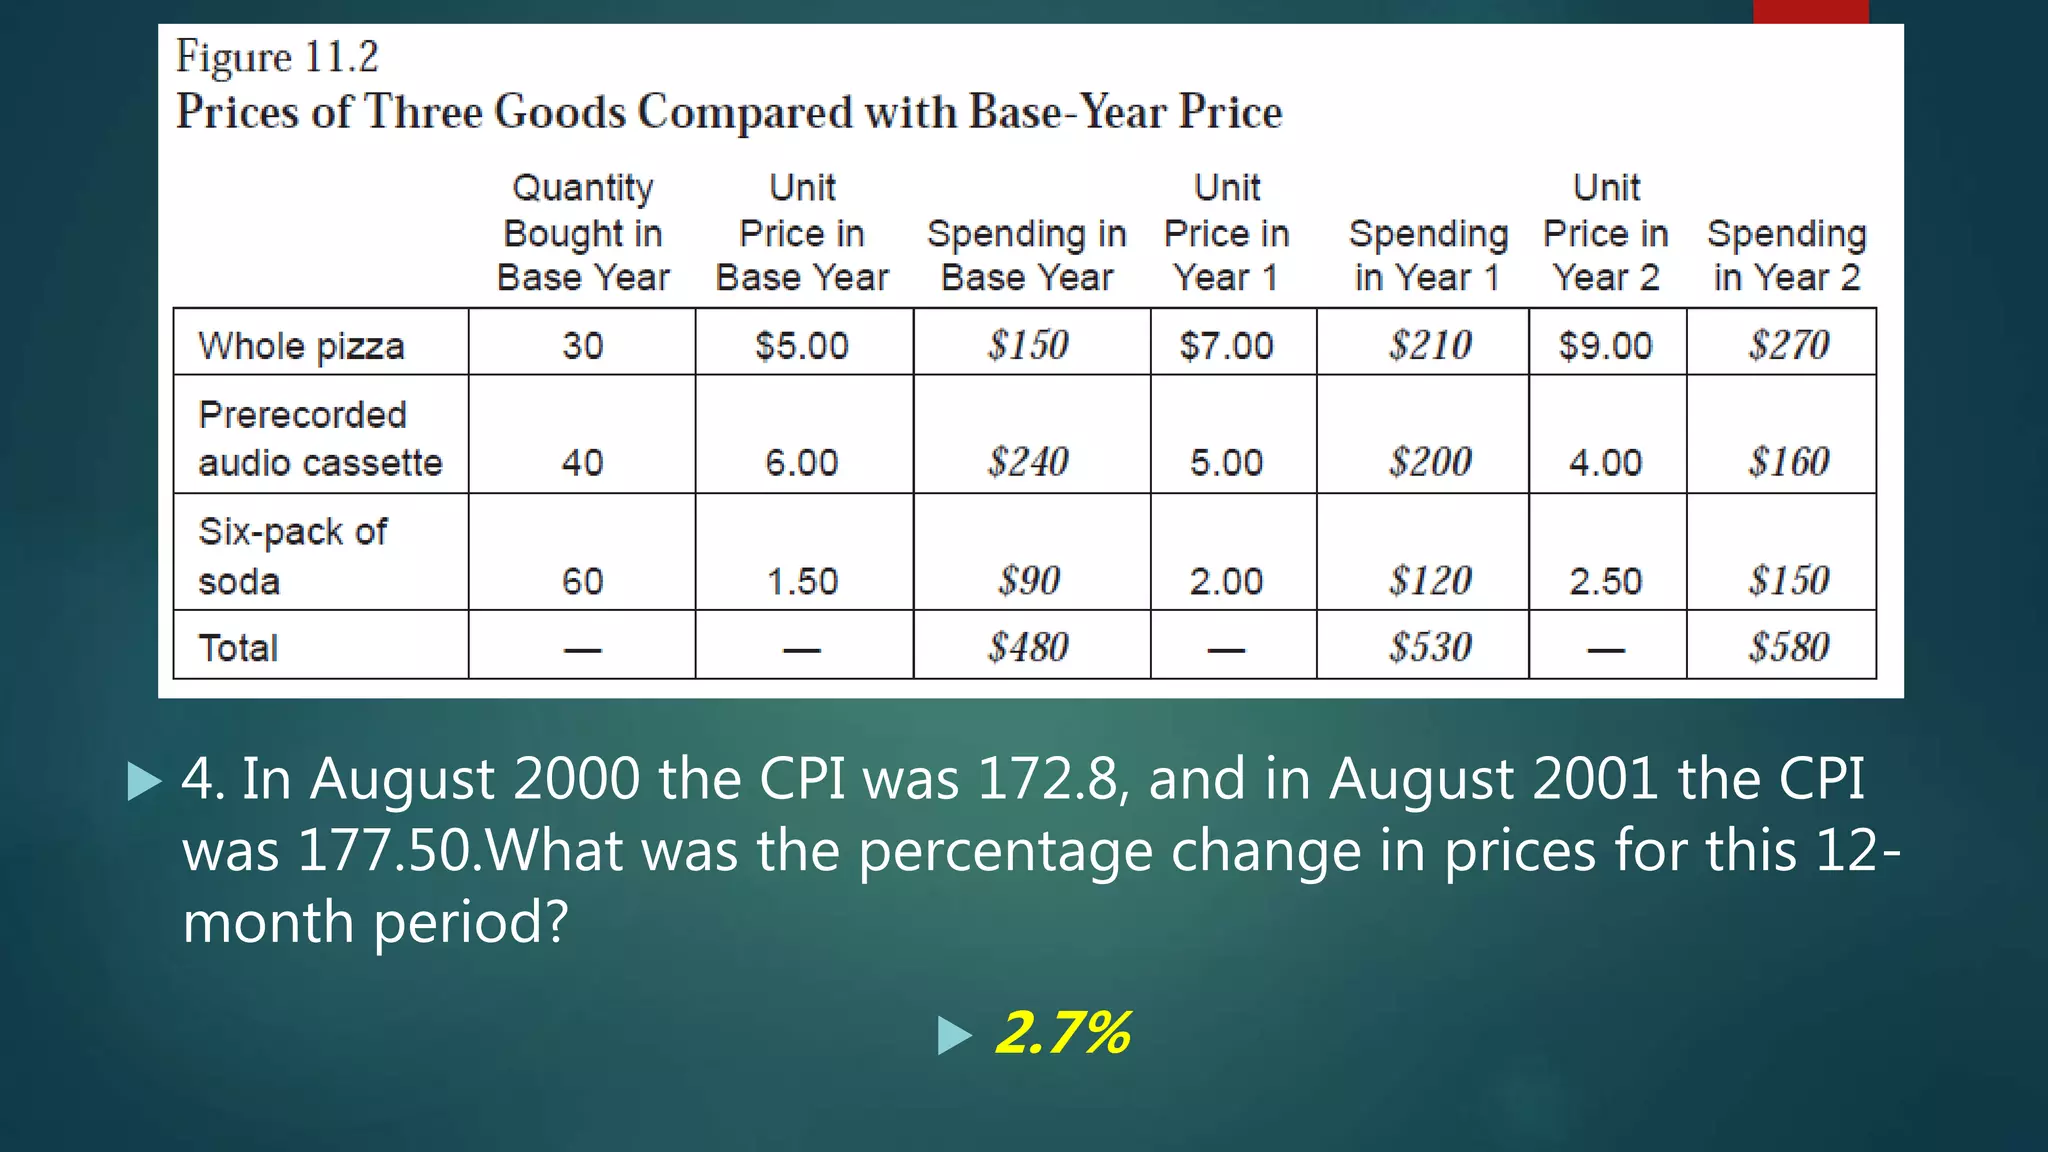
4. InAugust 2000 the CPI was 172.8, and in August 2001 the CPI
was 177.50.What was the percentage change in prices for this 12-
month period?
2.7%
62.
Measuring Short-Run Economic
Growth
•The main difference between nominal and real
values is that real values are adjusted for inflation,
while nominal values are not. As a result, nominal
GDP will often appear higher than real GDP.
63.
1. Whatis the real GDP in Year 3?
$4,000 [(100 x $5,000) / 125]
2. What is the real GDP in Year 4?
$4,400 [(100 x $6,600) / 150]
3. What is the real GDP per capita in Year 3?
$364 ($4,000 / 11)
4. What is the real GDP per capita in Year 4?
$367 ($4,400 / 12)
64.
5. Whatis the rate of real output growth between Years 3 and 4?
10% [(4,400 – 4,000) / 4,000] x 100
6. What is the rate of real output growth per capita between Years 3 and 4?
(Hint: Use per-capita data in the output growth rate formula.)
0.82% [(367 – 364) / 364] x 100


![ 1. What is the total cost of buying all the items in Year 2?
$580
2. What is the CPI for Year 2?
120.8 [(580 / 480) x 100]](https://image.slidesharecdn.com/econ1-171210134204/75/Overview-of-Applied-Economics-59-2048.jpg)
![ 1. What is the real GDP in Year 3?
$4,000 [(100 x $5,000) / 125]
2. What is the real GDP in Year 4?
$4,400 [(100 x $6,600) / 150]
3. What is the real GDP per capita in Year 3?
$364 ($4,000 / 11)
4. What is the real GDP per capita in Year 4?
$367 ($4,400 / 12)](https://image.slidesharecdn.com/econ1-171210134204/75/Overview-of-Applied-Economics-63-2048.jpg)
![ 5. What is the rate of real output growth between Years 3 and 4?
10% [(4,400 – 4,000) / 4,000] x 100
6. What is the rate of real output growth per capita between Years 3 and 4?
(Hint: Use per-capita data in the output growth rate formula.)
0.82% [(367 – 364) / 364] x 100](https://image.slidesharecdn.com/econ1-171210134204/75/Overview-of-Applied-Economics-64-2048.jpg)