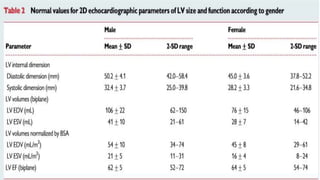
This document outlines updated recommendations for cardiac chamber quantification by echocardiography in adults, specifically detailing the measurements and methodologies for assessing left ventricle size, function, and mass. Key techniques discussed include 2D and 3D echocardiography for volume measurements, fractional shortening, ejection fraction, and global longitudinal strain, along with reference values and guidelines for accurate measurement. The recommendations emphasize the importance of averaging multiple cardiac cycles and indexing measurements to body surface area (BSA) for accurate comparison across diverse populations.


![2.2. EF [ejection fraction]
• EF=(EDV−ESV)/EDV
• 3DE-basedEFmeasurementsareaccurateandreproducible and should
be used when available and feasible
• 3DE - based EF measurements are accurate and reproducible and
should be used when available and feasible](https://image.slidesharecdn.com/lvchamberquantifications-200508080012/85/Lv-chamber-quantifications-2015-23-320.jpg)
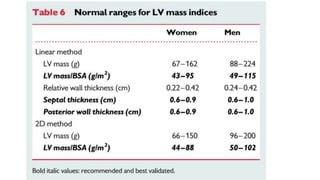
![• Linear method::
• Cube formula
• LV mass=0.8·1.04·[(IVS+LVID+PWT)3 −LVID3]+0.6g
• Where IVS is interventricular septum;
• LVID is LV internal diameter, and PWT is inferolateral wall thickness.
• Convert the volume to mass by multiplying the volume of
myocardium by the myocardial density (approximately 1.05 g/mL](https://image.slidesharecdn.com/lvchamberquantifications-200508080012/85/Lv-chamber-quantifications-2015-43-320.jpg)