Download to read offline
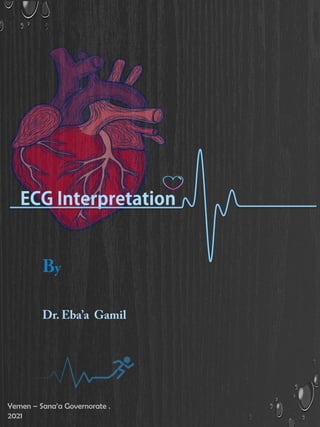


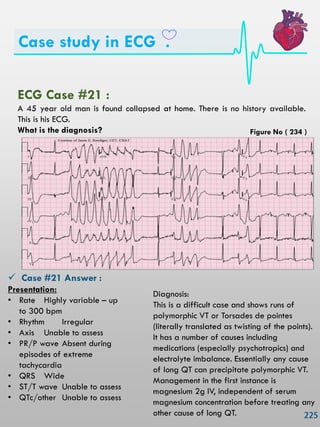
![Conducting System of the Heart :
The Cardiac Conduction System Is A Group Of Specialized Cardiac Muscle
Cells In The Walls Of The Heart That Send Signals To The Heart Muscle
Causing It To Contract
Cardiac Muscle Tissue Has Intrinsic Ability To:
• Generate and conduct impulses
• Signal these cells to contract rhythmically
Conducting system :
• A series of specialized cardiac muscle cells .
• Sino-atrial (SA) node sets the inherent rate of contraction .
Conduction System: [ SA AV Bundle Branch / Purkinje fibers.]
Anatomy
Of Conducting System .
Figure No ( 12 )](https://image.slidesharecdn.com/ecginterpretation-210515150413/85/Ecg-interpretation-24-320.jpg)


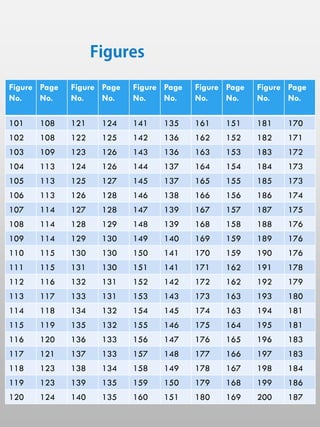
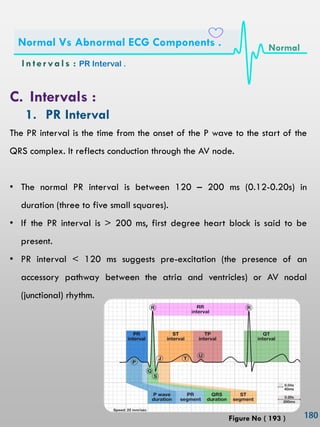
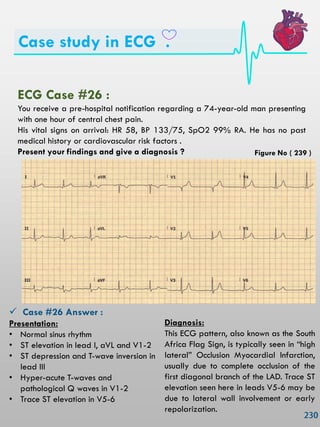
![ HR ( Heart Rate )
• Number of P‘s (atrial) R‘s (ventricular) per minute (6 second [30
squares] X 10 = minute rate).
• 1500/No of small squares (or)
• 300/No of large squares:
The HR may be counted by simply dividing 300 by the number of
the large squares between two heart beats (R-R).
If the interval between two beats is one large square, the HR is 300
beat/min, 2 squares →150, 3 squares →100, 4 squares → 75, 5
squares → 60, 6 squares → 50 beat/min.
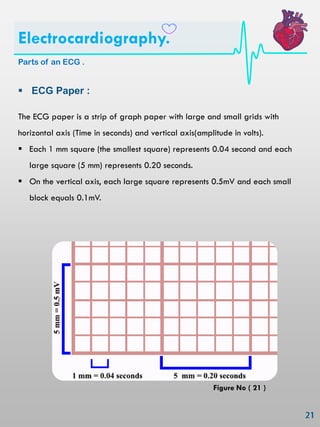
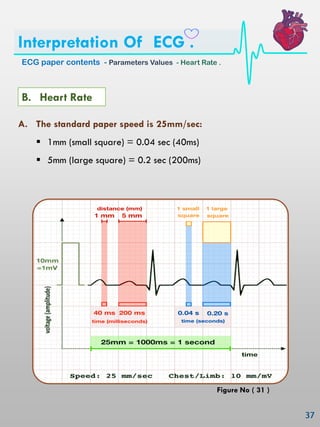
ECG paper contents - Parameters Values - Heart Rate .
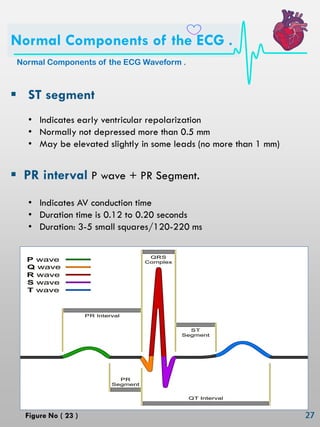
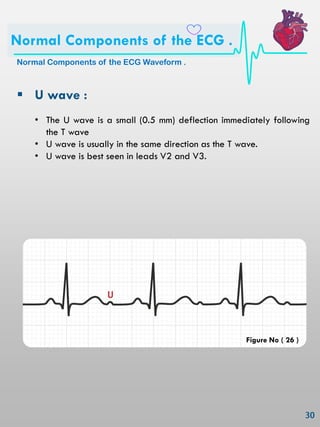
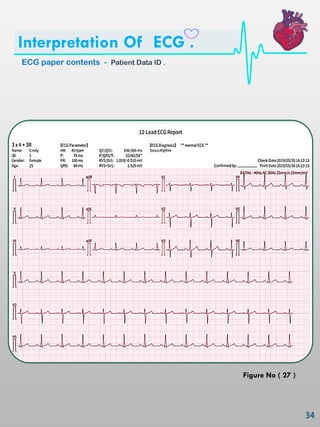
Interpretation Of ECG .
Figure No ( 33 )](https://image.slidesharecdn.com/ecginterpretation-210515150413/85/Ecg-interpretation-56-320.jpg)


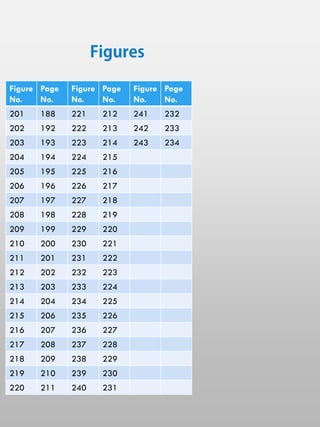
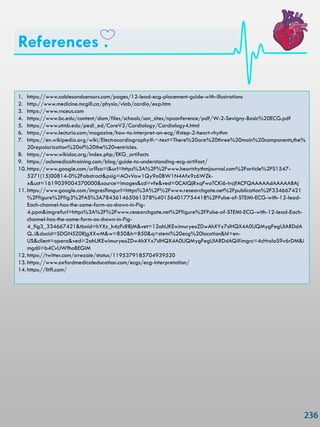
![Osborn Wave ECG : ( examples )
Example 1
Subtle J waves in mild hypothermia [Temp: 32.5°C (90.5°F)]
The height of the J wave is roughly proportional to the degree of
hypothermia
Example 2
J waves in moderate hypothermia. [Temp: 30°C (86°F)
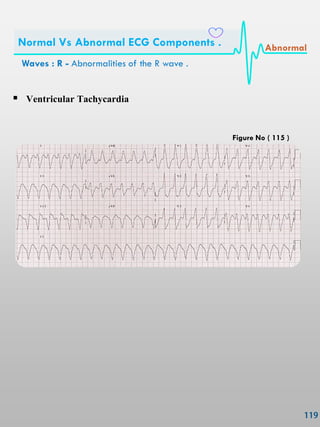
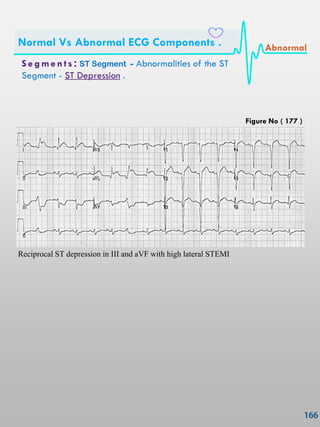
Waves : Osborn ( J ) Wave - Abnormalities of the
Osborn (J) Wave .
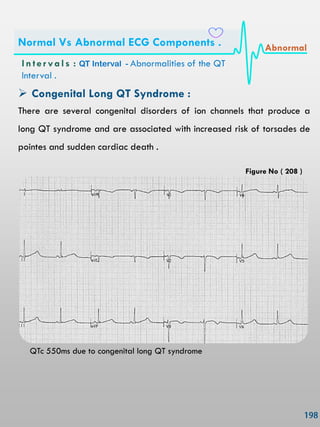
Normal Vs Abnormal ECG Components . Abnormal
Figure No ( 118 )
Figure No ( 119 )](https://image.slidesharecdn.com/ecginterpretation-210515150413/85/Ecg-interpretation-145-320.jpg)
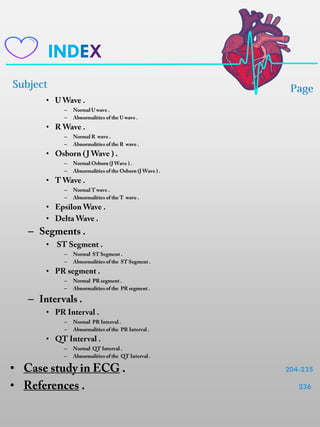
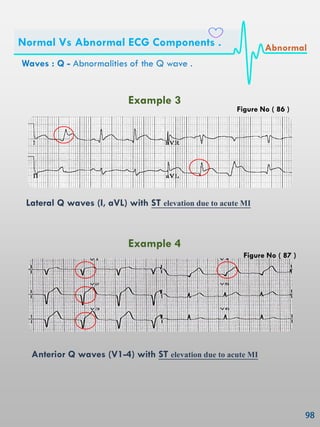
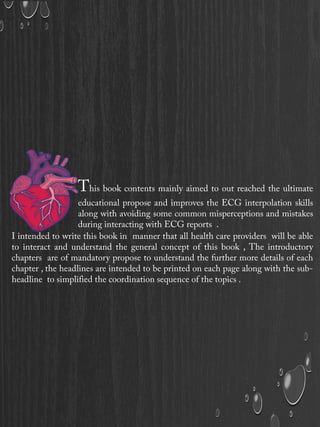
![Example 3
J waves in moderate hypothermia. [Temp: 28°C (82.4°F)]
Example 4
Marked J waves in severe hypothermia [Temp: 26°C (78.8°F)]
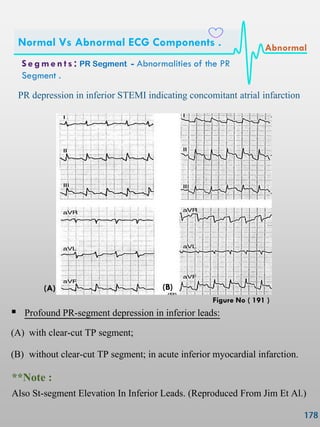
Waves : Osborn ( J ) Wave - Abnormalities of the
Osborn (J) Wave .
Normal Vs Abnormal ECG Components . Abnormal
Figure No ( 120 )
Figure No ( 121 )](https://image.slidesharecdn.com/ecginterpretation-210515150413/85/Ecg-interpretation-146-320.jpg)


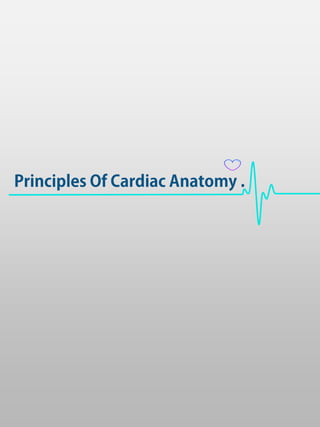
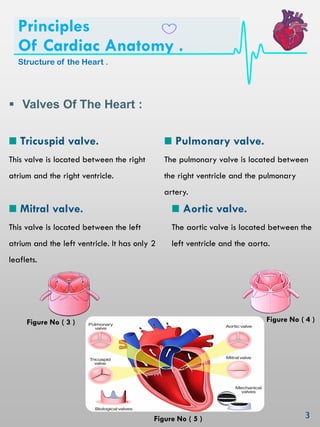
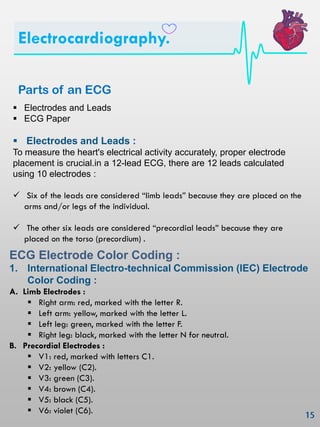
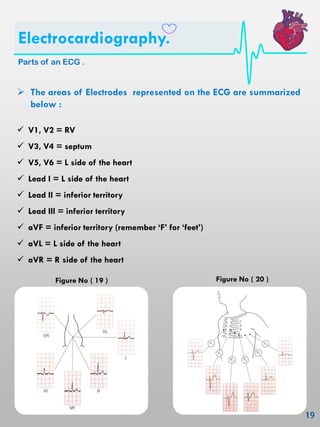
This document is a guide on ECG interpretation aimed at medical students and healthcare providers, emphasizing its importance in diagnosing heart disease and patient management. It covers the structure and function of the heart, the principles of cardiac anatomy, the conducting system, and provides detailed instructions on ECG electrode placement and interpretation. The guide aims to enhance ECG skills and avoid common misconceptions during interactions with ECG reports.


