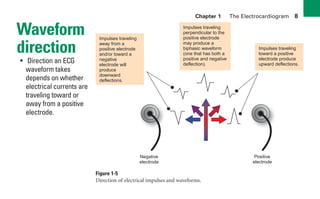
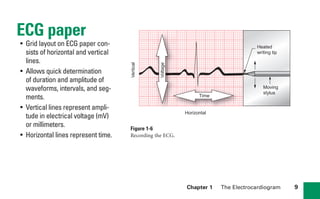
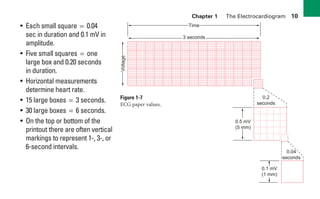
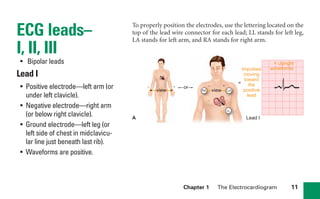
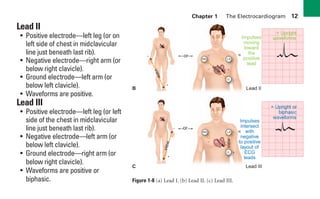
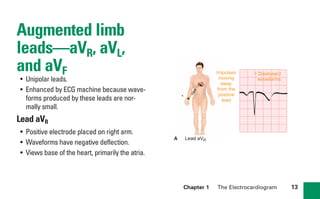
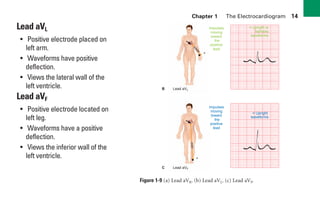
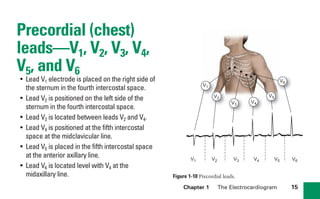
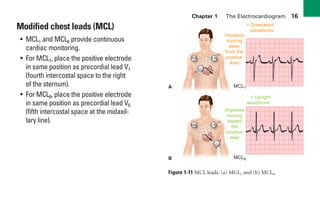
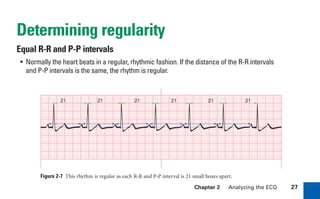
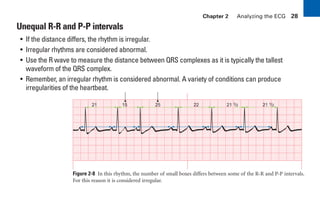
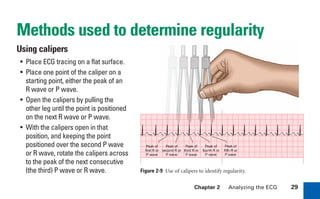
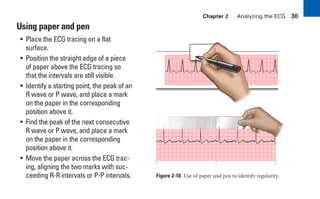
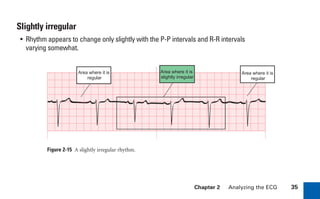
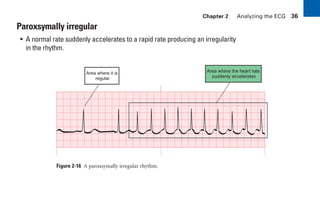
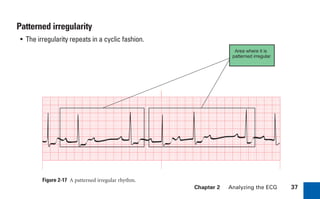
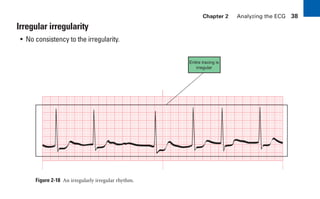
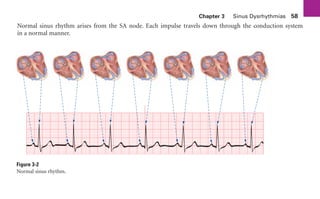
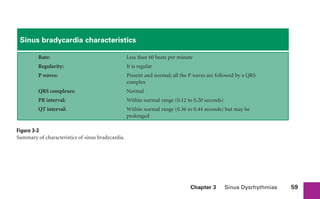
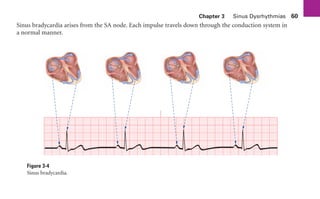
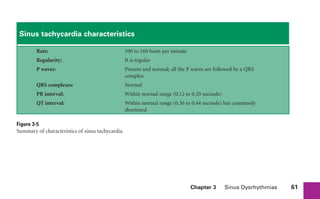
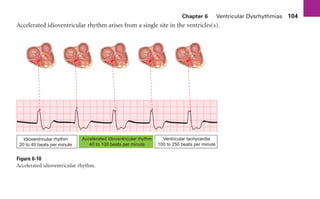
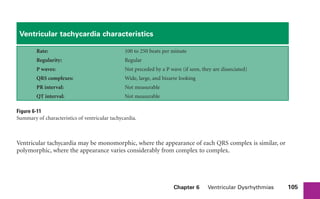
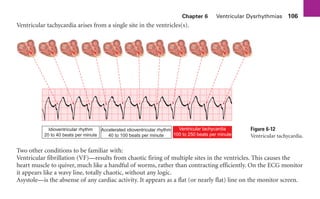
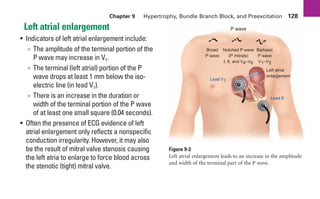
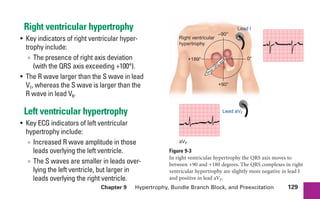
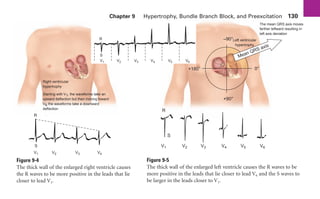
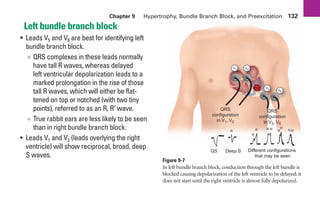
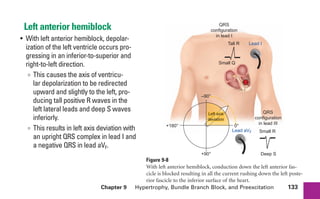
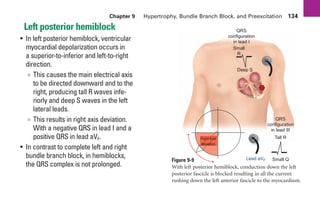
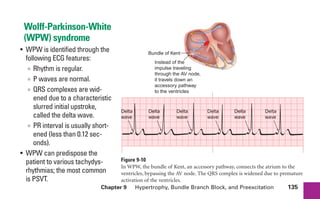
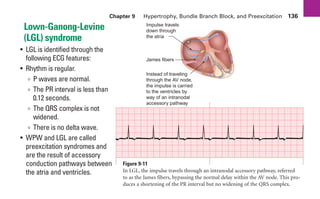
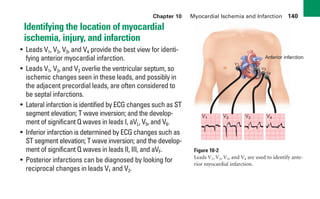
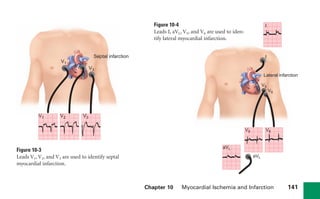
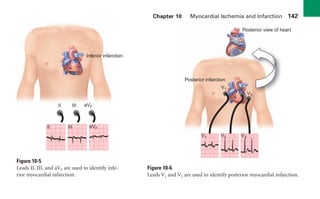
This document provides an overview of electrocardiograms (ECGs) and the heart. It discusses the normal ECG tracing and the heart's electrical conduction system. It describes the standard 12-lead ECG configuration, including limb leads I, II, III and augmented leads aVR, aVL, aVF as well as precordial chest leads V1-V6. It also discusses ECG paper format and how the direction of waveforms is determined by the movement of electrical impulses toward or away from positive electrodes.
This presentation focus on the basic concept of pointers. so that students can easily understand. it also contains basic operations performed by pointer variables and implementation using c language.
Salient features of the book are -
- The book provides a shortcut to understand and remember certain specific formulae and points you require to interpret the 12-lead ECG.
- Treatment protocols (in green boxes) for most of the important conditions are also included.
- View sample ECGs as you read along the topics.
- The content is explained in a very simple language to provide good conceptions, written from a student’s point of view.
- People can gain their belief in the book after going through sample ECGs which would be available at www.themedicalpost.net/ecg
- The book competes with the other books available in the market in simplicity, summaries, treatment protocols, live diagrams and regularly updated sample ECGs on the website.
learn how to obtain an ECG, anyone can do it:
This presentation aims to show the clinical process of obtaining an ECG and features some tips and suggestions to troubleshoot and improve the quality of the tracing.
Please note that you're welcome to use any slides as long as you reference my post when you do so to maintain the integrity of authorship
If interested in detailed answers, please email: aamirdash@yahoo.com
Thanks, Ahmad
Gianella Espinosa
(
Olivier Ritter
BEM Bachelor
10/09/2012
) (
A l’attention d
’
Anne-Catherine
Guitard
) (
INTERNSHIP REPORT
)
Contents
Context 2
What is Cardiac Mapping? 2
The Product 3
The Mission 4
What is atrial fibrillation? 5
Clinical cases 6
Global Market Needs Analysis 7
Normal anatomy and physiology of the heart 7
Pathophysiology, Causal factors & Disease progression 8
Clinical Presentation & Outcomes 11
Treatments of Atrial fibrillation 12
Epidemiology 14
Economic Burden 17
Appendices
Context
Heart disease is the number one cause of death in the United States. Cardiac arrhythmias—an irregular heartbeat—affects 2.2 million Americans. Congestive heart failure—the inability to pump blood properly—affects nearly 5 million Americans. Conventional treatments such as ablation and cardiac resynchronization therapy (CRT) can improve patients’ lives; but clinical outcomes have not reached the intended levels of success.
Catheter ablation success rates have ranged between 40-85 percent, resulting in need for repeat procedures in 40-50 percent of the cases. For CRT patients, success is highly dependent on selecting the right patient, placing the lead in the best location for that patient, and optimizing the device settings.
Currently, 1/3 of all patients with CRT devices do not respond to treatment, leading to continued progression of heart failure, increased patient morbidity, and an increasing financial burden to the healthcare system.What is Cardiac Mapping?
Mapping the electrical activity of the heart is a critical component for the diagnosis and treatment of heart disease. Many advanced therapies (such as ablation for the treatment of arrhythmias) require detailed electroanatomic mapping. Currently, mapping is performed in an electrophysiology (EP) lab, during which mapping catheters are inserted into the heart and carefully moved to various locations around the heart to map and identify the origins of the arrhythmia. Once the origin of the arrhythmia is identified, the specific tissue is destroyed by ablation. Current catheter mapping technologies have several limitations including:
· Risks and limitations associated with being an invasive and time consuming procedure.
· Current point-to-point mapping technology does not provide simultaneous, beat-by-beat mapping. Electrical activity has to be skillfully aggregated and annotated to make sense of the information provided by these point-to-point mapping systems.
· Does not provide the whole picture (bi-atrial or bi-ventricular) of electrical activity. Only provides mapping information one chamber at a time.
· Does not fit into the current work flow of device based therapy (e.g. Cardiac resynchronization therapy devices for heart failure).
Catheter ablation has evolved to become a mainstream treatment for arrhythmias, while mapping to identify ablation treatment targets and confirm success of therapy has emerged as its significant and critical counterpart.
For device-based thera.
Phonocardiogram based diagnostic systemijbesjournal
A Phonocardiogram or PCG is a plot of high fidelity recording of the sounds and murmurs made by the
heart with the help of the machine called phonocardiograph. It has developed continuously to perform an
important role in the proper and accurate diagnosis of the defects of the heart. As usually with the
stethoscope, it requires highly and experienced physicians to read the phonocardiogram. A diagnostic
system based on Artificial Neural Networks (ANN) is implemented as a detector and classifier of heart
diseases. The output of the system is the classification of the sound as either normal or abnormal, if it is
abnormal what type of abnormality is present. In this paper, Based on the extracted time domain and
frequency domain features such as energy, mean, variance and Mel Frequency Cepstral Coefficients
(MFCC) various heart sound samples are classified using Support Vector Machine (SVM), K Nearest
Neighbour (KNN), Bayesian and Gaussian Mixture Model (GMM) Classifiers. The data used in this paper
was obtained from Michigan university website.
Have you ever wondered how search works while visiting an e-commerce site, internal website, or searching through other types of online resources? Look no further than this informative session on the ways that taxonomies help end-users navigate the internet! Hear from taxonomists and other information professionals who have first-hand experience creating and working with taxonomies that aid in navigation, search, and discovery across a range of disciplines.
This presentation, created by Syed Faiz ul Hassan, explores the profound influence of media on public perception and behavior. It delves into the evolution of media from oral traditions to modern digital and social media platforms. Key topics include the role of media in information propagation, socialization, crisis awareness, globalization, and education. The presentation also examines media influence through agenda setting, propaganda, and manipulative techniques used by advertisers and marketers. Furthermore, it highlights the impact of surveillance enabled by media technologies on personal behavior and preferences. Through this comprehensive overview, the presentation aims to shed light on how media shapes collective consciousness and public opinion.
Sharpen existing tools or get a new toolbox? Contemporary cluster initiatives...Orkestra
UIIN Conference, Madrid, 27-29 May 2024
James Wilson, Orkestra and Deusto Business School
Emily Wise, Lund University
Madeline Smith, The Glasgow School of Art
0x01 - Newton's Third Law: Static vs. Dynamic AbusersOWASP Beja
f you offer a service on the web, odds are that someone will abuse it. Be it an API, a SaaS, a PaaS, or even a static website, someone somewhere will try to figure out a way to use it to their own needs. In this talk we'll compare measures that are effective against static attackers and how to battle a dynamic attacker who adapts to your counter-measures.
About the Speaker
===============
Diogo Sousa, Engineering Manager @ Canonical
An opinionated individual with an interest in cryptography and its intersection with secure software development.
Acorn Recovery: Restore IT infra within minutesIP ServerOne
Introducing Acorn Recovery as a Service, a simple, fast, and secure managed disaster recovery (DRaaS) by IP ServerOne. A DR solution that helps restore your IT infra within minutes.
This presentation by Morris Kleiner (University of Minnesota), was made during the discussion “Competition and Regulation in Professions and Occupations” held at the Working Party No. 2 on Competition and Regulation on 10 June 2024. More papers and presentations on the topic can be found out at oe.cd/crps.
This presentation was uploaded with the author’s consent.
Supercharge your AI - SSP Industry Breakout Session 2024-v2_1.pdf
Pocket ECG.pdf
1.
2. Pocket ECGs
Bruce Shade, EMT-P, EMS-I, AAS
A Quick Information Guide
Boston Burr Ridge, IL Dubuque, IA New York San Francisco St. Louis
Bangkok Bogotá Caracas Kuala Lumpur Lisbon London Madrid Mexico City
Milan Montreal New Delhi Santiago Seoul Singapore Sydney Taipei Toronto
sha19766_fm.indd i
sha19766_fm.indd i 7/31/06 3:11:19 PM
7/31/06 3:11:19 PM
4. iii
This book is dedicated to my wife Cheri, my daughter Katherine, and my son Christopher. Their love
and support gave me the strength to carry this good idea from concept to a handy pocket guide.
Bruce Shade
Dedication
sha19766_fm.indd iii
sha19766_fm.indd iii 7/31/06 3:11:21 PM
7/31/06 3:11:21 PM
5. Preface
This book, as its title implies, is meant to serve as a
portable, easy to view, quick reference pocket guide. At
your fingertips you have immediate access to the key
characteristics associated with the various dysrhyth-
mias and cardiac conditions. Essential (what you need
to know) information is laid out in visually attractive
color-coded pages making it easy to find the informa-
tion for which you are looking. This allows you to
quickly identify ECG tracings you see in the field or the
clinical setting. It is also a useful tool in the classroom
for quickly looking up key information. Small and
compact, it can be easily carried in a pocket.
Chapter 1 provides a short introduction regard-
ing the location of the heart and lead placement.
Chapter 2 briefly describes the nine-step process for
interpreting the various waveforms and normal and
abnormal features found on ECG tracings. It visually
demonstrates how to calculate the heart rate, identify
irregularities, and identify and measure the various
waveforms, intervals and segments. Key values for each
waveform, interval, and segment are listed. Chapters 3
through 7 lead you through dysrhythmias of the sinus
node, the atria, the AV junction, the ventricles, and
AV heart block. Characteristics for each dysrhythmia
are listed in simple to view tables. Sample tracings
include figures of the heart that illustrate where each
dysrhythmia originates and how it occurs. This helps
you understand the ECG dysrhythmia rather than just
iv
sha19766_fm.indd iv
sha19766_fm.indd iv 2/28/07 12:09:45 PM
2/28/07 12:09:45 PM
6. v
memorize strips. Chapter 8 introduces the concept of
electrical axis. Chapters 9 and 10 introduce concepts
important to 12-lead ECG interpretation and recog-
nizing hypertrophy, bundle branch block, preexcita-
tion and myocardial injury, ischemia, and infarction.
Finally, Chapter 11 discusses other cardiac conditions
and their effects on the ECG.
We hope this learning program is beneficial to
both students and instructors. Greater understanding
of ECG interpretation can only lead to better patient
care everywhere.
Acknowledgments
I would first like to thank Lisa Nicks, Senior Marketing
Manager, and the sales force at McGraw-Hill who
came to Claire Merrick, our Sponsoring Editor and
said the readers were clamoring for a simple to use tool
to go along with our Fast & Easy ECGs textbook. Claire
was quick to put the book on the front burner and
get the project underway. I would like to thank Dave
Culverwell, Publisher at McGraw-Hill. Dave embraced
the idea of this book with great enthusiasm and lent his
support and guidance. I would like to thank Michelle
Zeal, the project’s Developmental Editor. Michelle
did a great job keeping things on track but yet did it
in such a way that she didn’t add a lot of stress to an
already stressful process. Her hard work on the book
shaped its wonderful look and style as well as helped
ensure the accuracy of the content. This book, because
of its dynamic, simplistic, visual approach, required
significant expertise on the part of our production
project manager, Sheila Frank. She helped condense a
wealth of text and figures into a small compact pocket
guide that maintains the warm, stimulating tapestry of
its parent textbook, Fast & Easy ECGs.
sha19766_fm.indd v
sha19766_fm.indd v 7/31/06 3:11:22 PM
7/31/06 3:11:22 PM
7. Publisher’s Acknowledgments
Rosana Darang, MD
Medical Professional Institute, Malden, MA
Carol J. Lundrigan, PhD, APRN, BC
North Carolina A&T State University, Greensboro, NC
Rita F. Waller
Augusta Technical College, Augusta, GA
Robert W. Emery
Philadelphia University, Philadelphia, PA
Gary R. Sharp, PA-C, M.P.H.
University of Oklahoma, Oklahoma City, OK
Lyndal M. Curry, MA, NREMT-P
University of South Alabama, Mobile, AL
vi
sha19766_fm.indd vi
sha19766_fm.indd vi 2/28/07 12:02:32 PM
2/28/07 12:02:32 PM
9. Chapter 1 The Electrocardiogram 2
What is in this chapter
• The ECG
∞ The normal ECG
• The heart
• Conduction system
∞ Waveform direction
• ECG paper
• ECG leads—I, II, III
• Augmented limb leads—aVR,
aVL, and aVF
• Precordial (chest) leads—V1, V2,
V3, V4, V5, and V6
• Modified chest leads (MCL)
sha19766_cp01.indd 2
sha19766_cp01.indd 2 7/24/06 1:19:42 PM
7/24/06 1:19:42 PM
10. Chapter 1 The Electrocardiogram 3
The ECG
• Identifies irregularities in heart
rhythm.
• Reveals injury, death, or other
physical changes in heart
muscle.
• Used as an assessment and
diagnostic tool in prehospital,
hospital, and other clinical
settings.
• Can provide continuous
monitoring of heart’s electrical
activity.
Figure 1-1
The electrocardiograph is the device that detects, measures, and records the ECG.
ECG tracing
sha19766_cp01.indd 3
sha19766_cp01.indd 3 7/24/06 1:19:42 PM
7/24/06 1:19:42 PM
11. Chapter 1 The Electrocardiogram 4
Figure 1-2
The electrocardiogram is the tracing or graphic representation of the heart’s electrical activity.
The normal ECG
• Upright, round P waves occurring at regular intervals at a rate of 60 to 100 beats per minute.
• PR interval of normal duration (0.12 to 0.20 seconds) followed by a QRS complex of normal upright
contour, duration (0.06 to 0.12 seconds), and configuration.
• Flat ST segment followed by an upright, slightly asymmetrical T wave.
T T T
QRS QRS QRS
P P P
QRS
T T T T
QRS QRS QRS
P P P P
sha19766_cp01.indd 4
sha19766_cp01.indd 4 7/24/06 1:19:43 PM
7/24/06 1:19:43 PM
12. Chapter 1 The Electrocardiogram 5
The heart
• About the same size as its
owner’s closed fist.
• Located between the two
lungs in mediastinum behind
the sternum.
• Lies on the diaphragm in front
of the trachea, esophagus, and
thoracic vertebrae.
• About two thirds of it is situ-
ated in the left side of the chest
cavity.
2nd rib
Sternum
Base of the
heart
Diaphragm
5th rib
Apex of the
heart
A
sha19766_cp01.indd 5
sha19766_cp01.indd 5 7/24/06 1:19:43 PM
7/24/06 1:19:43 PM
13. Chapter 1 The Electrocardiogram 6
• Has a front-to-back (anterior-
posterior) orientation.
∞ Its base is directed posteriorly
and slightly superiorly at the
level of the second intercostal
space.
∞ Its apex is directed anteriorly
and slightly inferiorly at the level
of the fifth intercostal space in
the left midclavicular line.
∞ In this position the right ven-
tricle is closer to the front of the
left chest, while the left ventricle
is closer to the left side of the
chest.
Knowing the position and orientation of the heart will help you to
understand why certain ECG waveforms appear as they do when the
electrical impulse moves toward a positive or negative electrode.
Left ventricle
Lungs
Base of
the heart
Thoracic
vertebra
Sternum Right ventricle
Apex of
the heart
Posterior
Anterior
B
Figure 1-3
(a) Position of the heart in the chest.
(b) Cross section of the thorax at the level of the heart.
sha19766_cp01.indd 6
sha19766_cp01.indd 6 7/24/06 1:19:43 PM
7/24/06 1:19:43 PM
14. Chapter 1 The Electrocardiogram 7
Conduction
system
• Sinoatrial (SA) node initiates the
heartbeat.
• Impulse then spreads across the right
and left atrium.
• Atrioventricular (AV) node carries the
impulse from the atria to the ventricles.
• From the AV node the impulse is carried
through the bundle of His, which then
divides into the right and left bundle
branches.
• The right and left bundle branches
spread across the ventricles and even-
tually terminate in the Purkinje fibers.
1
2
4
3
Left atrium
Left ventricle
Apex
Bundle
of His
Atrioventricular
node
Sinoatrial
node
Left and right
bundle branches
Purkinje
fibers
Inherent rate
20–40 beats
per minute
Inherent rate
40–60 beats
per minute
Inherent rate
60–100 beats
per minute
Figure 1-4
Electrical conductive system of the heart.
sha19766_cp01.indd 7
sha19766_cp01.indd 7 7/24/06 1:19:43 PM
7/24/06 1:19:43 PM
15. Chapter 1 The Electrocardiogram 8
Waveform
direction
• Direction an ECG
waveform takes
depends on whether
electrical currents are
traveling toward or
away from a positive
electrode.
Impulses traveling
perpendicular to the
positive electrode
may produce a
biphasic waveform
(one that has both a
positive and negative
deflection).
Positive
electrode
Negative
electrode
– +
Impulses traveling
toward a positive
electrode produce
upward deflections.
Impulses traveling
away from a
positive electrode
and/or toward a
negative
electrode will
produce
downward
deflections.
Figure 1-5
Direction of electrical impulses and waveforms.
sha19766_cp01.indd 8
sha19766_cp01.indd 8 7/24/06 1:19:43 PM
7/24/06 1:19:43 PM
16. Chapter 1 The Electrocardiogram 9
ECG paper
• Grid layout on ECG paper con-
sists of horizontal and vertical
lines.
• Allows quick determination
of duration and amplitude of
waveforms, intervals, and seg-
ments.
• Vertical lines represent ampli-
tude in electrical voltage (mV)
or millimeters.
• Horizontal lines represent time.
Horizontal
Vertical
Voltage
Time
Heated
writing tip
Moving
stylus
Figure 1-6
Recording the ECG.
sha19766_cp01.indd 9
sha19766_cp01.indd 9 7/24/06 1:19:43 PM
7/24/06 1:19:43 PM
17. Chapter 1 The Electrocardiogram 10
• Each small square=0.04
sec in duration and 0.1 mV in
amplitude.
• Five small squares=one
large box and 0.20 seconds
in duration.
• Horizontal measurements
determine heart rate.
• 15 large boxes=3 seconds.
• 30 large boxes=6 seconds.
• On the top or bottom of the
printout there are often vertical
markings to represent 1-, 3-, or
6-second intervals.
Voltage
Time
3 seconds
0.5 mV
(5 mm)
0.2
seconds
0.04
seconds
0.1 mV
(1 mm)
Figure 1-7
ECG paper values.
sha19766_cp01.indd 10
sha19766_cp01.indd 10 7/24/06 1:19:43 PM
7/24/06 1:19:43 PM
18. Chapter 1 The Electrocardiogram 11
ECG leads–
I, II, III
• Bipolar leads
Lead I
• Positive electrode—left arm (or
under left clavicle).
• Negative electrode—right arm
(or below right clavicle).
• Ground electrode—left leg (or
left side of chest in midclavicu-
lar line just beneath last rib).
• Waveforms are positive.
RA
LL
+ +
–
–
G
LA
Impulses
moving
toward
the
positive
lead
A Lead I
view view
or
=
= Upright
waveforms
To properly position the electrodes, use the lettering located on the
top of the lead wire connector for each lead; LL stands for left leg,
LA stands for left arm, and RA stands for right arm.
sha19766_cp01.indd 11
sha19766_cp01.indd 11 7/24/06 1:19:44 PM
7/24/06 1:19:44 PM
19. Chapter 1 The Electrocardiogram 12
Lead II
• Positive electrode—left leg (or on
left side of chest in midclavicular
line just beneath last rib).
• Negative electrode—right arm (or
below right clavicle).
• Ground electrode—left arm (or
below left clavicle).
• Waveforms are positive.
Lead III
• Positive electrode—left leg (or left
side of the chest in midclavicular
line just beneath last rib).
• Negative electrode—left arm (or
below left clavicle).
• Ground electrode—right arm (or
below right clavicle).
• Waveforms are positive or
biphasic.
LA
+
–
RA LA
LL
+
–
+
–
+
–
G
G
RA
LL
= Upright
waveforms
= Upright or
biphasic
waveforms
Impulses
moving
toward
the
positive
lead
Impulses
intersect
with
negative
to positive
layout of
ECG
leads
B
C Lead III
Lead II
v
i
e
w
v
i
e
w
view
view
or
or
=
=
Figure 1-8 (a) Lead I. (b) Lead II. (c) Lead III.
sha19766_cp01.indd 12
sha19766_cp01.indd 12 7/24/06 1:19:44 PM
7/24/06 1:19:44 PM
20. Chapter 1 The Electrocardiogram 13
Augmented limb
leads—aVR, aVL,
and aVF
• Unipolar leads.
• Enhanced by ECG machine because wave-
forms produced by these leads are nor-
mally small.
Lead aVR
• Positive electrode placed on right arm.
• Waveforms have negative deflection.
• Views base of the heart, primarily the atria.
= Downward
waveforms
Impulses
moving
away
from the
positive
lead
+
A Lead aVR
v
i
e
w
sha19766_cp01.indd 13
sha19766_cp01.indd 13 7/24/06 1:19:44 PM
7/24/06 1:19:44 PM
21. Chapter 1 The Electrocardiogram 14
Lead aVL
• Positive electrode placed on
left arm.
• Waveforms have positive
deflection.
• Views the lateral wall of the
left ventricle.
Lead aVF
• Positive electrode located on
left leg.
• Waveforms have a positive
deflection.
• Views the inferior wall of the
left ventricle.
vie
w
Impulses
moving
toward
the
positive
lead
+
B Lead aVL
Impulses
moving
toward
the
positive
lead
+
C Lead aVF
= Upright
waveforms
v
i
e
w
= Upright or
biphasic
waveforms
Figure 1-9 (a) Lead aVR. (b) Lead aVL. (c) Lead aVF.
sha19766_cp01.indd 14
sha19766_cp01.indd 14 7/24/06 1:19:44 PM
7/24/06 1:19:44 PM
22. Chapter 1 The Electrocardiogram 15
Precordial (chest)
leads—V1, V2, V3, V4,
V5, and V6
• Lead V1 electrode is placed on the right side of
the sternum in the fourth intercostal space.
• Lead V2 is positioned on the left side of the
sternum in the fourth intercostal space.
• Lead V3 is located between leads V2 and V4.
• Lead V4 is positioned at the fifth intercostal
space at the midclavicular line.
• Lead V5 is placed in the fifth intercostal space
at the anterior axillary line.
• Lead V6 is located level with V4 at the
midaxillary line.
V1
V1 V2 V3 V4 V5 V6
V2
V3
V4
V5
V6
Figure 1-10 Precordial leads.
sha19766_cp01.indd 15
sha19766_cp01.indd 15 7/24/06 1:19:44 PM
7/24/06 1:19:44 PM
23. Chapter 1 The Electrocardiogram 16
Modified chest leads (MCL)
• MCL1 and MCL6 provide continuous
cardiac monitoring.
• For MCL1, place the positive electrode
in same position as precordial lead V1
(fourth intercostal space to the right
of the sternum).
• For MCL6, place the positive electrode
in same position as precordial lead V6
(fifth intercostal space at the midaxil-
lary line).
Impulses
moving
away
from the
positive
lead
Impulses
moving
toward
the
positive
lead
= Downward
waveforms
= Upright
waveforms
MCL1
MCL6
RA
LL
+
–
A
LA
B
LA
+
–
RA
LL
G
G
Figure 1-11 MCL leads. (a) MCL1 and (b) MCL6.
sha19766_cp01.indd 16
sha19766_cp01.indd 16 7/24/06 1:19:44 PM
7/24/06 1:19:44 PM
25. Chapter 2 Analyzing the ECG 18
What is in this chapter
• Five-step (and nine-step)
process
• Methods for determining the
heart rate
• Dysrhythmias by heart rate
• Determining regularity
• Methods used to determine
regularity
• ECG waveforms
sha19766_cp02.indd 18
sha19766_cp02.indd 18 7/24/06 1:48:20 PM
7/24/06 1:48:20 PM
26. Chapter 2 Analyzing the ECG 19
Five-step (and nine-step) process
• The five-step process (and nine-step) is a logical and systematic process for analyzing
ECG tracings
1. Determine the rate. (Is it normal, fast, or slow?)
2. Determine the regularity. (Is it regular or irregular?)
3. Assess the P waves. (Is there a uniform P wave preceding each QRS complex?)
4. Assess the QRS complexes. (Are the QRS complexes within normal limits? Do they
appear normal?)
5. Assess the PR intervals. (Are the PR intervals identifiable? Within normal limits?
Constant in duration?)
Four more steps can be added to the five-step process making it a nine-step process.
6. Assess the ST segment. (Is it a flat line? Is it elevated or depressed?)
7. Assess the T waves. (Is it slightly asymmetrical? Is it of normal height? Is it oriented in
the same direction as the preceding QRS complex?)
8. Look for U waves. (Are they present?)
9. Assess the QT interval. (Is it within normal limits?)
sha19766_cp02.indd 19
sha19766_cp02.indd 19 7/24/06 1:48:20 PM
7/24/06 1:48:20 PM
27. Chapter 2 Analyzing the ECG 20
Figure 2-1 (a) The five-step process. (b) Nine-step process.
Rate Regularity P waves
Five-step process
QRS complexes PR intervals
Assess
Rate Regularity P waves
Nine-step process
QRS
complexes
PR
intervals
Assess
A
ST
segments
U
waves
T
waves
QT
intervals
B
sha19766_cp02.indd 20
sha19766_cp02.indd 20 7/24/06 1:48:20 PM
7/24/06 1:48:20 PM
28. Chapter 2 Analyzing the ECG 21
Methods for determining the heart rate
Using the 6-second!10 method
• Multiply by 10 the number of QRS complexes (for the ventricular rate) and the P waves (for the atrial
rate) found in a 6-second portion of ECG tracing. The rate in the ECG below is approximately 70
beats per minute.
3-second interval 3-second interval
Multiply the number of QRS complexes or P waves by 10
6-second interval
3-second
marks
1 2 3 4 5 6 7
Figure 2-2 6-second interval!10 method.
sha19766_cp02.indd 21
sha19766_cp02.indd 21 7/24/06 1:48:20 PM
7/24/06 1:48:20 PM
29. Chapter 2 Analyzing the ECG 22
Using the 300, 150, 100, 75, 60, 50 method
Figure 2-3 300, 150, 100, 75, 60, 50 method.
3
0
0
1
5
0
1
0
0
7
5
6
0
5
0
R
wave
End
point
Start
point
The heart rate in the ECG below is
approximately 100 beats per minute.
• Begin by finding an
R wave (or P wave)
located on a bold line
(the start point).
Then find the next
consecutive R wave.
The bold line it falls
on (or is closest to) is
the end point and
represents the
heart rate.
• If the second R wave
does not fall on a bold
line the heart rate must
be approximated.
sha19766_cp02.indd 22
sha19766_cp02.indd 22 7/24/06 1:48:20 PM
7/24/06 1:48:20 PM
30. Chapter 2 Analyzing the ECG 23
Using the thin lines to determine the heart rate
Figure 2-4 Identified values shown for each of the thin lines.
• To more precisely determine the heart rate when the second R wave falls between
two bold lines, you can use the identified values for each thin line.
300 150 100 75 60 50 43 38 33
250
214
188
167
136
125
115
107
94
88
84
79
72
68
65
63
58
56
54
52
48
47
45
44
42
41
40
39
37
36
35
34
Start
point
sha19766_cp02.indd 23
sha19766_cp02.indd 23 7/24/06 1:48:20 PM
7/24/06 1:48:20 PM
31. Chapter 2 Analyzing the ECG 24
Using the 1500 method
• Begin by counting number of small squares between two consecutive R waves and divide 1500 by
that number. Remember, this method cannot be used with irregular rhythms.
End
point
Start
point
38 small
boxes
1500 divided by 38 small boxes = 40 beats per minute
Figure 2-5 The 1500 method.
sha19766_cp02.indd 24
sha19766_cp02.indd 24 7/24/06 1:48:20 PM
7/24/06 1:48:20 PM
32. Chapter 2 Analyzing the ECG 25
Dysrhythmias by heart rate
• Average adult has a heart rate of 60-100 beats per minute (BPM).
• Rates above 100 BPM or below 60 BPM are considered abnormal.
• A heart rate less than 60 BPM is called bradycardia.
∞ It may or may not have an adverse affect on cardiac output.
∞ In the extreme it can lead to severe reductions in cardiac output and eventually deteriorate into
asystole (an absence of heart rhythm).
• A heart rate greater than 100 BPM is called tachycardia.
∞ It has many causes and leads to increased myocardial oxygen consumption, which can
adversely affect patients with coronary artery disease and other medical conditions.
∞ Extremely fast rates can have an adverse affect on cardiac output.
∞ Also, tachycardia that arises from the ventricles may lead to a chaotic quivering of the ventricles
called ventricular fibrillation.
sha19766_cp02.indd 25
sha19766_cp02.indd 25 7/24/06 1:48:21 PM
7/24/06 1:48:21 PM
33. Chapter 2 Analyzing the ECG 26
Figure 2-6 Heart rate algorithm.
Heart rate
Slow Fast
Normal
• Sinus bradycardia
• Sinus arrest*
• Junctional escape
• Idioventricular rhythm
• AV heart block
• Atrial flutter or
fibrillation with slow
ventricular response
• Normal sinus rhythm
• Sinus dysrhythmia
• Wandering atrial
pacemaker
• Accelerated junctional
rhythm
• Atrial flutter or
fibrillation with normal
ventricular response
• Sinus tachycardia
• Junctional tachycardia
• Atrial tachycardia, SVT,
PSVT
• Multifocal atrial
tachycardia (MAT)
• Ventricular tachycardia
• Atrial flutter or
fibrillation with fast
ventricular response
*Heart rate can also be normal
sha19766_cp02.indd 26
sha19766_cp02.indd 26 7/24/06 1:48:21 PM
7/24/06 1:48:21 PM
34. Chapter 2 Analyzing the ECG 27
Determining regularity
Equal R-R and P-P intervals
• Normally the heart beats in a regular, rhythmic fashion. If the distance of the R-R intervals
and P-P intervals is the same, the rhythm is regular.
Figure 2-7 This rhythm is regular as each R-R and P-P interval is 21 small boxes apart.
21
21
21
21
21
21
sha19766_cp02.indd 27
sha19766_cp02.indd 27 7/24/06 1:48:21 PM
7/24/06 1:48:21 PM
35. Chapter 2 Analyzing the ECG 28
Unequal R-R and P-P intervals
• If the distance differs, the rhythm is irregular.
• Irregular rhythms are considered abnormal.
• Use the R wave to measure the distance between QRS complexes as it is typically the tallest
waveform of the QRS complex.
• Remember, an irregular rhythm is considered abnormal. A variety of conditions can produce
irregularities of the heartbeat.
Figure 2-8 In this rhythm, the number of small boxes differs between some of the R-R and P-P intervals.
For this reason it is considered irregular.
21 25 22 21 1/2 21 1/2
15
sha19766_cp02.indd 28
sha19766_cp02.indd 28 7/24/06 1:48:21 PM
7/24/06 1:48:21 PM
36. Chapter 2 Analyzing the ECG 29
Methods used to determine regularity
Using calipers
• Place ECG tracing on a flat surface.
• Place one point of the caliper on a
starting point, either the peak of an
R wave or P wave.
• Open the calipers by pulling the
other leg until the point is positioned
on the next R wave or P wave.
• With the calipers open in that
position, and keeping the point
positioned over the second P wave
or R wave, rotate the calipers across
to the peak of the next consecutive
(the third) P wave or R wave. Figure 2-9 Use of calipers to identify regularity.
Peak of
first R or
P wave
Peak of
second R or
P wave
Peak of
third R or
P wave
Peak of
fourth R or
P wave
Peak of
fifth R or
P wave
sha19766_cp02.indd 29
sha19766_cp02.indd 29 7/24/06 1:48:21 PM
7/24/06 1:48:21 PM
37. Chapter 2 Analyzing the ECG 30
Using paper and pen
• Place the ECG tracing on a flat
surface.
• Position the straight edge of a piece
of paper above the ECG tracing so
that the intervals are still visible.
• Identify a starting point, the peak of an
R wave or P wave, and place a mark
on the paper in the corresponding
position above it.
• Find the peak of the next consecutive
R wave or P wave, and place a mark
on the paper in the corresponding
position above it.
• Move the paper across the ECG trac-
ing, aligning the two marks with suc-
ceeding R-R intervals or P-P intervals. Figure 2-10 Use of paper and pen to identify regularity.
sha19766_cp02.indd 30
sha19766_cp02.indd 30 7/24/06 1:48:22 PM
7/24/06 1:48:22 PM
38. Chapter 2 Analyzing the ECG 31
Counting the small squares between each R-R interval
• Count the number of small squares between the peaks of two consecutive R waves (or P waves)
and then compare that to the other R-R (or P-P) intervals to reveal regularity.
Figure 2-11 Counting the number of small squares to identify regularity.
1+ 5 + 5 + 5 + 5 = 21
This R-R interval is 21
small boxes in duration.
21
sha19766_cp02.indd 31
sha19766_cp02.indd 31 7/24/06 1:48:23 PM
7/24/06 1:48:23 PM
39. Chapter 2 Analyzing the ECG 32
Regular Irregular
Occasional
or very
Slightly
Sudden
acceleration
in heart rate
Patterned Totally
Variable
conduction
ratio
Evaluating regularity
Types of irregularity
• Irregularity can be categorized as:
∞ occasionally irregular or very irregular.
∞ slightly irregular.
∞ sudden acceleration in the heart rate.
∞ patterned irregularly.
∞ irregularly (totally) irregular.
∞ variable conduction ratio.
Figure 2-12 Algorithm for regular and irregular rhythms.
• Each type of irregularity is
associated with certain dys-
rhythmias. Knowing which
irregularity is associated
with which dysrhythmias
makes it easier to later inter-
pret a given ECG tracing.
sha19766_cp02.indd 32
sha19766_cp02.indd 32 7/24/06 1:48:23 PM
7/24/06 1:48:23 PM
40. Chapter 2 Analyzing the ECG 33
Occasionally irregular
• The dysrhythmia is mostly regular but from time to time you see an area of irregularity.
Figure 2-13 An occasionally irregular rhythm.
21 25 21 21 21
15
Area where
it is irregular
Area where
it is regular
Shorter
R-R interval
sha19766_cp02.indd 33
sha19766_cp02.indd 33 7/24/06 1:48:23 PM
7/24/06 1:48:23 PM
41. Chapter 2 Analyzing the ECG 34
Frequently irregular
• A very irregular dysrhythmia has many areas of irregularity.
Figure 2-14 A frequently irregular rhythm.
Shorter
R-R interval
Shorter
R-R interval
Area where
it is irregular
Area where
it is regular
Underlying rhythm against
which the regularity of the
rest of rhythm is measured.
Area where
it is irregular
Shorter
R-R interval
sha19766_cp02.indd 34
sha19766_cp02.indd 34 7/24/06 1:48:23 PM
7/24/06 1:48:23 PM
42. Chapter 2 Analyzing the ECG 35
Slightly irregular
• Rhythm appears to change only slightly with the P-P intervals and R-R intervals
varying somewhat.
Figure 2-15 A slightly irregular rhythm.
Area where it is
regular
Area where it is
slightly irregular
Area where it is
regular
sha19766_cp02.indd 35
sha19766_cp02.indd 35 7/24/06 1:48:23 PM
7/24/06 1:48:23 PM
43. Chapter 2 Analyzing the ECG 36
Paroxsymally irregular
• A normal rate suddenly accelerates to a rapid rate producing an irregularity
in the rhythm.
Figure 2-16 A paroxsymally irregular rhythm.
Area where it is
regular
Area where the heart rate
suddenly accelerates
sha19766_cp02.indd 36
sha19766_cp02.indd 36 7/24/06 1:48:23 PM
7/24/06 1:48:23 PM
44. Chapter 2 Analyzing the ECG 37
Patterned irregularity
• The irregularity repeats in a cyclic fashion.
Figure 2-17 A patterned irregular rhythm.
Area where it is
patterned irregular
sha19766_cp02.indd 37
sha19766_cp02.indd 37 7/24/06 1:48:23 PM
7/24/06 1:48:23 PM
45. Chapter 2 Analyzing the ECG 38
Irregular irregularity
• No consistency to the irregularity.
Figure 2-18 An irregularly irregular rhythm.
Entire tracing is
irregular
sha19766_cp02.indd 38
sha19766_cp02.indd 38 7/24/06 1:48:23 PM
7/24/06 1:48:23 PM
46. Chapter 2 Analyzing the ECG 39
Areas where
the conduction
ratio changes
Variable irregularity
• The number of impulses reaching the ventricles changes, producing
an irregularity.
Figure 2-19 Variably irregular rhythm.
sha19766_cp02.indd 39
sha19766_cp02.indd 39 7/24/06 1:48:23 PM
7/24/06 1:48:23 PM
47. Chapter 2 Analyzing the ECG 40
Regularity
• Normal sinus rhythm
• Sinus bradycardia
• Sinus tachycardia
• Atrial tachycardia
• Junctional escape
• Accelerated junctional
• Junctional tachycardia
• Idioventricular rhythm
• Ventricular tachycardia
• Atrial flutter/constant
• 1st & 3rd degree AV block
• 2nd (Type II)
Regular Irregular
Occasionally or
very
Slightly
Sudden
acceleration in
heart rate
Patterned Totally
Variable
conduction
ratio
• Sinus arrest
• Premature
beats (PACs,
PJCs, PVCs)
• Wandering
atrial
pacemaker
• PSVT,
PAT, PJT
• Sinus
dysrhythmia
• Premature
beats—
(bigeminy,
trigeminy,
quadrigeminy
• 2nd degree AV
block, Type I
• Atrial
fibrillation
• Atrial flutter
• 2nd degree AV
heart block,
Type II
Irregularity algorithm
Figure 2-20 Algorithm showing which
dysrhythmias display which type of irregularity.
sha19766_cp02.indd 40
sha19766_cp02.indd 40 7/24/06 1:48:24 PM
7/24/06 1:48:24 PM
48. Chapter 2 Analyzing the ECG 41
ECG waveforms
P wave
• Begins with its movement away from the base-
line and ends in its return to the baseline.
• Characteristically round and slightly asymmetrical.
• There should be one P wave preceding each
QRS complex.
• In leads I, II, aVF, and V2 through V6, its deflection
is characteristically upright or positive.
• In leads III, aVL, and V1, the P wave is usually
upright but may be negative or biphasic (both
positive and negative).
• In lead aVR, the P wave is negative or inverted.
Figure 2-21 P wave.
Duration is 0.06
to 0.10 seconds
Amplitude is
0.5 to 2.5 mm
P
Usually rounded
and upright
One P wave
precedes
each QRS
Time (duration, rate)
Height/amplitude
(energy)
sha19766_cp02.indd 41
sha19766_cp02.indd 41 7/24/06 1:48:24 PM
7/24/06 1:48:24 PM
49. Chapter 2 Analyzing the ECG 42
QRS complex
• Follows PR segment and consists of:
∞ Q wave—first negative deflection fol-
lowing PR segment. It is always negative.
In some cases it is absent. The amplitude
is normally less than 25% of the ampli-
tude of the R wave in that lead.
∞ R wave—first positive triangular deflec-
tion following Q wave or PR segment.
∞ S wave—first negative deflection that
extends below the baseline in the QRS
complex following the R wave.
• In leads I, II, III, aVL, aVF, and V4 to V6, the deflection
of the QRS complex is characteristically positive or upright.
• In leads aVR and V1 to V3, the QRS complex is usually
negative or inverted.
• In leads III and V2 to V4 the QRS complex may also be biphasic.
Figure 2-22 QRS complex.
Duration is 0.06 to
0.12 seconds
QRS
complex
R
Q S
Time (duration, rate)
Height/amplitude
(energy)
sha19766_cp02.indd 42
sha19766_cp02.indd 42 7/24/06 1:48:24 PM
7/24/06 1:48:24 PM
50. Chapter 2 Analyzing the ECG 43
Differing forms of QRS complexes
• QRS complexes can consist of positive (upright) deflections called R waves and negative
(inverted) deflections called Q and S waves: all three waves are not always seen.
• If the R wave is absent, complex is called a QS complex. Likewise, if the Q wave is absent,
complex is called an RS complex.
• Waveforms of
normal or greater
than normal
amplitude are
denoted with a
large case letter,
whereas wave-
forms less than 5
mm amplitude are
denoted with a
small case letter
(e.g., “q,” “r,” “s”). Figure 2-23 Common QRS complexes.
R
Q
QS
R
q
R
S
q
R
S
R⬘
S
r
S
r⬘
r
R⬘
S
r
Q
r
S
r
sha19766_cp02.indd 43
sha19766_cp02.indd 43 7/24/06 1:48:24 PM
7/24/06 1:48:24 PM
51. Chapter 2 Analyzing the ECG 44
A
0.10 seconds
in duration
0.12 seconds
in duration
S
S
Q
J point
J point
R
R
B
0.08 seconds
in duration
0.08 seconds
in duration
0.14 seconds
in duration
0.22 seconds
in duration
0.18
seconds
in duration
S
S
S
Q
J point
J point
J point
J point
J point
R
R
R
S
S
R
R
Measuring the QRS complex
• First identify the QRS complex with the longest duration and
most distinct beginning and ending.
• Start by finding the beginning of the QRS complex.
∞ This is the point where the first wave of the complex (where
either the Q or R wave) begins to deviate from the baseline.
• Then measure to the point where the last
wave of the complex transitions into the
ST segment (referred to as the J point).
∞ Typically, it is where the S wave or R
wave (in the absence of an S wave)
begins to level out (flatten) at,
above, or below the baseline.
∞ This is considered the end of the
QRS complex.
Figure 2-24 Measuring the QRS complex. (a) These two QRS complexes have easy to see J points. (b) These QRS complexes have
less defined transitions making measurement of the QRS complex more challenging.
sha19766_cp02.indd 44
sha19766_cp02.indd 44 7/24/06 1:48:24 PM
7/24/06 1:48:24 PM
52. Chapter 2 Analyzing the ECG 45
PR interval
• Extends from the beginning of the
P wave to the beginning of the
Q wave or R wave.
• Consists of a P wave and a flat
(isoelectric) line.
• It is normally constant for each
impulse conducted from the atria
to the ventricles.
• The PR segment is the isoelectric
line that extends from the end of the
P wave to the beginning of the Q
wave or R wave.
Figure 2-25 PR interval.
Time (duration, rate)
PR interval
Duration is 0.12
to 0.20 seconds
PR segment
Height/amplitude
(energy)
sha19766_cp02.indd 45
sha19766_cp02.indd 45 7/24/06 1:48:24 PM
7/24/06 1:48:24 PM
53. Chapter 2 Analyzing the ECG 46
Measuring the PR interval
• To measure the width (duration) of a
PR interval, first identify the interval
with the longest duration and the most
distinct beginning and ending.
• Start by finding the beginning of the
interval. This is the point where the
P wave begins to transition from the
isoelectric line.
• Then measure to the point where the
isoelectric line (following the P wave)
transitions into the Q or R wave (in the
absence of an S wave).
• This is considered the end of the
PR interval.
Figure 2-26 Measuring PR intervals.
Time (duration, rate)
This PR interval 0.16 seconds in duration
Height/amplitude
(energy)
Start
measurement
here
End
measurement
here
sha19766_cp02.indd 46
sha19766_cp02.indd 46 7/24/06 1:48:24 PM
7/24/06 1:48:24 PM
54. Chapter 2 Analyzing the ECG 47
ST segment
• The line that follows the QRS complex and
connects it to the T wave.
• Begins at the isoelectric line extending from the
S wave until it gradually curves upward to the
T wave.
• Under normal circumstances, it appears as a flat
line (neither positive nor negative), although it may
vary by 0.5 to 1.0 mm in some precordial leads.
• The point that marks the end of the QRS and
the beginning of the ST segment is known as
the J point.
• The PR segment is used as the baseline from
which to evaluate the degree of displacement
of the ST segment from the isoelectric line.
• Measure at a point 0.04 seconds (one small box) after the J point. The ST segment is considered
elevated if it is above the baseline and considered depressed if it is below it.
Figure 2-27 ST segment, T wave, and QT interval.
J point
ST
segment
T wave
QT interval
Time (duration, rate)
Height/amplitude
(energy)
sha19766_cp02.indd 47
sha19766_cp02.indd 47 7/24/06 1:48:24 PM
7/24/06 1:48:24 PM
55. Chapter 2 Analyzing the ECG 48
T wave
• Larger, slightly asymmetrical waveform that follows the ST segment.
• Peak is closer to the end than the beginning, and the first half has a more gradual slope than
the second half.
• Normally not more than 5 mm in height in the limb leads or 10 mm in any precordial lead.
• Normally oriented in the same direction as the preceding QRS complex.
• Normally positive in leads I, II, and V2 to V6 and negative in lead aVR. They are also positive in
aVL and aVF but may be negative if the QRS complex is less that 6 mm in height. In leads III and
V1, the T wave may be positive or negative.
QT interval
• Distance from onset of QRS complex until end of T wave.
• Measures time of ventricular depolarization and repolarization.
• Normal duration of 0.36 to 0.44 seconds.
U wave
• Small upright (except in lead aVL) waveform sometimes seen fol-
lowing the T wave, but before the next P wave. Figure 2-28 U waves.
QRS
P P
T T
QRS
U
wave
sha19766_cp02.indd 48
sha19766_cp02.indd 48 7/24/06 1:48:24 PM
7/24/06 1:48:24 PM
56. Chapter 2 Analyzing the ECG 49
One for
every
QRS
More P
waves than
QRS
Absent
Normal,
round
Unusual
looking
Inverted
Peaked,
notched,
enlarged
Differing
morphology
Sawtooth Chaotic
baseline
Evaluate P waves
Present
Abnormal P waves
• P waves seen with impulses that originate in the SA node but travel
through altered or damaged atria (or atrial conduction pathways) appear
tall and rounded or peaked, notched, wide and notched or biphasic.
Figure 2-29 Algorithm for normal and abnormal
P waves.
• P waves appear different than sinus P waves when
the impulse arises from the atria instead of the sinus
node.
• Sawtooth appearing waveforms (flutter waves) occur
when an ectopic site in the atria fires rapidly.
• A chaotic-looking baseline (no discernible P waves)
occurs when many ectopic atrial sites rapidly fire.
• P waves are inverted, absent, or follow the QRS com-
plex when the impulse arises from the left atria, low
in the right atria, or in the AV junction.
• More P waves than QRS complexes occur when
impulses arise from the SA node, but do not all reach
the ventricles due to a blockage.
sha19766_cp02.indd 49
sha19766_cp02.indd 49 7/24/06 1:48:25 PM
7/24/06 1:48:25 PM
57. Chapter 2 Analyzing the ECG 50
Figure 2-30 Types of waveforms: (a) abnormal sinus P waves, (b) atrial P wave associated with a PAC, (c) flutter waves,
(d) no discernible P waves, (e) inverted P wave, (f) absent P wave, (g) P wave that follows QRS, and (h) P waves that are
not all followed by a QRS complex.
P
P⬘
P
Tall, rounded Tall, peaked Notched Wide, notched Biphasic
P P P P
P⬘
P⬘
A B C
E
“f ”
waves
“F”
waves
more P waves than
QRS complexes
F G H
D
sha19766_cp02.indd 50
sha19766_cp02.indd 50 7/24/06 1:48:25 PM
7/24/06 1:48:25 PM
58. Chapter 2 Analyzing the ECG 51
Abnormal QRS complexes
• Abnormally tall due to ventricular hypertrophy
or abnormally small due to obesity, hyperthy-
roidism, or pleural effusion.
• Slurred (delta wave) due to ventricular
preexcitation.
• Vary from being only slightly abnormal to
extremely wide and notched due to bundle
branch block, intraventricular conduction distur-
bance, or aberrant ventricular conduction.
• Wide due to ventricular pacing by a cardiac
pacemaker.
• Wide and bizarre looking due to electrical
impulses originating from an ectopic or escape
pacemaker site in the ventricles.
Follow
each
P wave
More P
waves than
QRS
complexes
Present Absent
Normal
0.06–0.12
seconds
Unusual
looking
Inverted
Tall, low
voltage Notched
Wide (greater
than 0.12
seconds),
bizarre
appearance
Chaotic
Evaluate QRS
complexes
Figure 2-31 Algorithm
for normal and abnor-
mal QRS complexes.
sha19766_cp02.indd 51
sha19766_cp02.indd 51 7/24/06 1:48:25 PM
7/24/06 1:48:25 PM
59. Delta
wave
A B C D E F G
H
P„
Figure 2-32 Types of QRS complexes: (a) tall, (b) low amplitude, (c) slurred, (d) wide due to intraventricular conduction defect,
(e) wide due to aberrant conduction, (f) wide due to bundle branch block, (g) wide due to ventricular cardiac pacemaker, and
(h) various wide and bizarre complexes due to ventricular origin.
Chapter 2 Analyzing the ECG 52
sha19766_cp02.indd 52
sha19766_cp02.indd 52 7/24/06 1:48:25 PM
7/24/06 1:48:25 PM
60. Chapter 2 Analyzing the ECG 53
Abnormal PR intervals
• Abnormally short or absent due to impulse arising
from low in the atria or in the AV junction.
• Abnormally short due to ventricular preexcitation.
• Absent due to ectopic site in the atria firing rap-
idly or many sites in the atria firing chaotically.
• Absent due to impulse arising from the ventricles.
• Longer than normal due to a delay in AV
conduction.
• Vary due to changing atrial pacemaker site.
• Progressively longer due to a weakened AV node
that fatigues more and more with each conduct-
ed impulse until finally it is so tired that it fails to
conduct an impulse through to the ventricles.
• Absent due to the P waves having no relationship
to the QRS complexes.
Figure 2-33 Algorithm for normal and abnormal PR
intervals.
Normal
0.12–0.20
seconds
Abnormal
Present Absent
Shorter
than 0.12
seconds
Longer
than 0.20
seconds
Absent Vary in
duration
Evaluate PR
intervals
sha19766_cp02.indd 53
sha19766_cp02.indd 53 7/24/06 1:48:25 PM
7/24/06 1:48:25 PM
61. Chapter 2 Analyzing the ECG 54
Figure 2-34 Types of PR intervals: (a) shortened, (b) absent, (c) longer than normal, (d) progressively longer in a cyclical
manner, (e) varying, and (f) absent due to an absence in the relationship between the atrial impulses and ventricular impulses.
0.18 0.10
Premature
atrial
complex
P⬘ P
0.30 0.35 0.42 absent 0.19
P P P P
0.20
P⬘
0.16
P⬘
0.12
P⬘
0.14
P⬘ P P P P P P P
A B C D
E F
sha19766_cp02.indd 54
sha19766_cp02.indd 54 7/24/06 1:48:25 PM
7/24/06 1:48:25 PM
63. Chapter 3 Sinus Dysrhythmias 56
What is in this chapter
• Normal sinus rhythm
characteristics
• Sinus bradycardia
characteristics
• Sinus tachycardia
characteristics
• Sinus dysrhythmia
characteristics
• Sinus arrest characteristics
Characteristics common to sinus dysrhythmias
• Arise from SA node.
• Normal P wave precedes each QRS complex.
• PR intervals are normal at 0.12 to 0.20 seconds in duration.
• QRS complexes are normal.
sha19766_cp03.indd 56
sha19766_cp03.indd 56 7/24/06 11:37:14 AM
7/24/06 11:37:14 AM
64. Chapter 3 Sinus Dysrhythmias 57
Figure 3-1
Summary of characteristics of normal sinus rhythm.
Normal sinus rhythm characteristics
Rate: 60 to 100 beats per minute
Regularity: It is regular
P waves: Present and normal; all the P waves are followed by a QRS
complex
QRS complexes: Normal
PR interval: Within normal range (0.12 to 0.20 seconds)
QT interval: Within normal range (0.36 to 0.44 seconds)
sha19766_cp03.indd 57
sha19766_cp03.indd 57 7/24/06 11:37:14 AM
7/24/06 11:37:14 AM
65. Chapter 3 Sinus Dysrhythmias 58
Normal sinus rhythm arises from the SA node. Each impulse travels down through the conduction system
in a normal manner.
Figure 3-2
Normal sinus rhythm.
sha19766_cp03.indd 58
sha19766_cp03.indd 58 7/24/06 11:37:15 AM
7/24/06 11:37:15 AM
66. Chapter 3 Sinus Dysrhythmias 59
Sinus bradycardia characteristics
Rate: Less than 60 beats per minute
Regularity: It is regular
P waves: Present and normal; all the P waves are followed by a QRS
complex
QRS complexes: Normal
PR interval: Within normal range (0.12 to 0.20 seconds)
QT interval: Within normal range (0.36 to 0.44 seconds) but may be
prolonged
Figure 3-3
Summary of characteristics of sinus bradycardia.
sha19766_cp03.indd 59
sha19766_cp03.indd 59 7/24/06 11:37:15 AM
7/24/06 11:37:15 AM
67. Chapter 3 Sinus Dysrhythmias 60
Sinus bradycardia arises from the SA node. Each impulse travels down through the conduction system in
a normal manner.
Figure 3-4
Sinus bradycardia.
sha19766_cp03.indd 60
sha19766_cp03.indd 60 7/24/06 11:37:15 AM
7/24/06 11:37:15 AM
68. Chapter 3 Sinus Dysrhythmias 61
Sinus tachycardia characteristics
Rate: 100 to 160 beats per minute
Regularity: It is regular
P waves: Present and normal; all the P waves are followed by a QRS
complex
QRS complexes: Normal
PR interval: Within normal range (0.12 to 0.20 seconds)
QT interval: Within normal range (0.36 to 0.44 seconds) but commonly
shortened
Figure 3-5
Summary of characteristics of sinus tachycardia.
sha19766_cp03.indd 61
sha19766_cp03.indd 61 7/24/06 11:37:16 AM
7/24/06 11:37:16 AM
69. Chapter 3 Sinus Dysrhythmias 62
Sinus tachycardia arises from the SA node. Each impulse travels down through the conduction system
in a normal manner.
Figure 3-6
Sinus tachycardia.
sha19766_cp03.indd 62
sha19766_cp03.indd 62 7/24/06 11:37:16 AM
7/24/06 11:37:16 AM
70. Chapter 3 Sinus Dysrhythmias 63
Sinus dysrhythmia characteristics
Rate: Typically 60 to 100 beats per minute
Regularity: It is regularly irregular (patterned irregularity); seems to speed
up, slow down, and speed up in a cyclical fashion
P waves: Present and normal; all the P waves are followed by a QRS
complex
QRS complexes: Normal
PR interval: Within normal range (0.12 to 0.20 seconds)
QT interval: May vary slightly but usually within normal range (0.36 to 0.44
seconds)
Figure 3-7
Summary of characteristics of sinus dysrhythmia.
sha19766_cp03.indd 63
sha19766_cp03.indd 63 7/24/06 11:37:16 AM
7/24/06 11:37:16 AM
71. Chapter 3 Sinus Dysrhythmias 64
Sinus dysrhythmia arises from the SA node. Each impulse travels down through the conduction system in
a normal manner.
Figure 3-8
Sinus dysrhythmia.
sha19766_cp03.indd 64
sha19766_cp03.indd 64 7/24/06 11:37:16 AM
7/24/06 11:37:16 AM
72. Chapter 3 Sinus Dysrhythmias 65
Sinus arrest characteristics
Rate: Typically 60 to 100 beats per minute, but may be slower
depending on frequency and length of arrest
Regularity: It is irregular where there is a pause in the rhythm (the SA node
fails to initiate a beat)
P waves: Present and normal; all the P waves are followed by a QRS
complex
QRS complexes: Normal
PR interval: Within normal range (0.12 to 0.20 seconds)
QT interval: Within normal range (0.36 to 0.44 seconds); unmeasurable
during a pause
Figure 3-9
Summary of characteristics of sinus arrest.
sha19766_cp03.indd 65
sha19766_cp03.indd 65 7/24/06 11:37:17 AM
7/24/06 11:37:17 AM
73. Chapter 3 Sinus Dysrhythmias 66
Sinus arrest occurs when the SA node fails to initiate an impulse.
Figure 3-10
Summary of characteristics of sinus arrest.
SA node fails to
initiate impulse
sha19766_cp03.indd 66
sha19766_cp03.indd 66 7/24/06 11:37:17 AM
7/24/06 11:37:17 AM
75. Chapter 4 Atrial Dysrhythmias 68
What is in this chapter
• Premature atrial complexes
(PACs) characteristics
• Wandering atrial pacemaker
characteristics
• Atrial tachycardia characteristics
• Multifocal atrial tachycardia
characteristics
• Atrial flutter characteristics
• Atrial fibrillatrion characteristics
Characteristics common to atrial dysrhythmias
• Arise from atrial tissue or internodal pathways.
• P’ waves (if present) that differ in appearance from normal sinus P waves
precede each QRS complex.
• P’R intervals may be normal, shortened, or prolonged.
• QRS complexes are normal (unless there is also an interventricular
conduction defect or aberrancy).
sha19766_cp04.indd 68
sha19766_cp04.indd 68 7/24/06 11:52:56 AM
7/24/06 11:52:56 AM
76. Chapter 4 Atrial Dysrhythmias 69
Wandering atrial pacemaker characteristics
Rate: Usually within normal limits
Regularity: Slightly irregular
P waves: Continuously change in appearance
QRS complexes: Normal
PR interval: Varies
QT interval: Usually within normal limits but may vary
Figure 4-1
Summary of characteristics of wandering atrial pacemaker.
sha19766_cp04.indd 69
sha19766_cp04.indd 69 7/24/06 11:52:57 AM
7/24/06 11:52:57 AM
77. Chapter 4 Atrial Dysrhythmias 70
Wandering atrial pacemaker arises from different sites in the atria.
Figure 4-2
Wandering atrial pacemaker.
sha19766_cp04.indd 70
sha19766_cp04.indd 70 7/24/06 11:52:57 AM
7/24/06 11:52:57 AM
78. Chapter 4 Atrial Dysrhythmias 71
Premature atrial complexes (PAC) characteristics
Rate: Depends on the underlying rhythm
Regularity: May be occasionally irregular or frequently irregular (depends
on the number of PACs present). It may also be seen as pat-
terned irregularity if bigeminal, trigeminal, or quadrigeminal
PACs are seen.
P waves: May be upright or inverted, will appear different than those of
the underlying rhythm
QRS complexes: Normal
PR interval: Will be normal duration if ectopic beat arises from the upper- or
middle-right atrium. It is shorter than 0.12 seconds in duration
if the ectopic impulse arises from the lower right atrium or in
the upper part of the AV junction. In some cases it can also be
prolonged
QT interval: Usually within normal limits but may vary
Figure 4-3
Summary of characteristics of premature atrial complexes.
sha19766_cp04.indd 71
sha19766_cp04.indd 71 7/24/06 11:52:57 AM
7/24/06 11:52:57 AM
79. Chapter 4 Atrial Dysrhythmias 72
Premature atrial complexes arise from somewhere in the atrium.
Figure 4-4
Premature atrial complexes.
sha19766_cp04.indd 72
sha19766_cp04.indd 72 7/24/06 11:52:57 AM
7/24/06 11:52:57 AM
80. Chapter 4 Atrial Dysrhythmias 73
The pause that follows a
premature beat is called
a noncompensatory pause
if the space between the
complex before and after
the premature beat is less
than the sum of two R-R
intervals.
Non-compensatory
pauses are typically seen
with premature atrial
and junctional complexes
(PACs, PJCs).
When the tip of the
right caliper leg
fails to line up with
the next R wave it
is considered a
noncompensatory
pause
Measure first
R-R interval
that precedes
the early beat
Rotate or slide
the calipers
over until
the left leg is
lined up with
the second
R wave —
mark the point
where the tip
of the right
leg falls
Rotate or slide
the calipers
over until the
left leg is lined
up with your
first mark
Figure 4-5
Premature beats with a noncompensatory pause.
sha19766_cp04.indd 73
sha19766_cp04.indd 73 7/24/06 11:52:57 AM
7/24/06 11:52:57 AM
81. Chapter 4 Atrial Dysrhythmias 74
When the tip of the
right caliper leg lines up
with the next R wave it
is considered a
compensatory pause
Measure first R-R
interval that precedes
the early beat
Compensatory pauses are typically
associated with premature ventricular
complexes (PVCs)
Rotate or slide the calipers
over until the left leg is
lined up with the second
R wave —mark the point
where the tip of the right
leg falls
Rotate or slide the calipers
over until the left leg is
lined up with your first mark
Figure 4-6
Premature beats with a compensatory pause.
sha19766_cp04.indd 74
sha19766_cp04.indd 74 7/24/06 11:52:58 AM
7/24/06 11:52:58 AM
82. Chapter 4 Atrial Dysrhythmias 75
Premature beats occurring in a pattern
One way to describe PACs is how they are intermingled among the normal beats. When every other beat
is a PAC, it is called bigeminal PACs, or atrial bigeminy. If every third beat is a PAC, it is called trigeminal
PACs, or atrial trigeminy. Likewise, if a PAC occurs every fourth beat, it is called quadrigeminal PACs, or
atrial quadrigeminy. Regular PACs at greater intervals than every fourth beat have no special name.
Figure 4-7
Premature atrial complexes: (a) bigeminal PACs, (b) trigeminal PACs, and (c) quadrigeminal
PACs.
Normal
a)
Normal Normal Normal PAC
PAC
PAC
PAC
sha19766_cp04.indd 75
sha19766_cp04.indd 75 7/24/06 11:52:58 AM
7/24/06 11:52:58 AM
83. Chapter 4 Atrial Dysrhythmias 76
Normal
Normal
b)
c)
Normal Normal Normal Normal PAC
PAC
PAC
Normal Normal Normal Normal PAC
PAC
sha19766_cp04.indd 76
sha19766_cp04.indd 76 7/24/06 11:52:58 AM
7/24/06 11:52:58 AM
84. Chapter 4 Atrial Dysrhythmias 77
Narrow complex
tachycardia that
has a sudden,
witnessed onset
and abrupt
termination is
called paroxys-
mal tachycardia.
Atrial tachycardia characteristics
Rate: 150 to 250 beats per minute
Regularity: Regular unless the onset is witnessed (thereby
producing paroxysmal irregularity)
P waves: May be upright or inverted, will appear differ-
ent than those of the underlying rhythm
QRS complexes: Normal
PR interval: Will be normal duration if ectopic beat arises
from the upper- or middle-right atrium. It is
shorter than 0.12 seconds in duration if the
ectopic impulse arises from the lower-right
atrium or in the upper part of the AV junc-
tion
QT interval: Usually within normal limits but may be
shorter due to the rapid rate
Narrow com-
plex tachycardia
that cannot be
clearly identi-
fied as atrial
or junctional
tachycardia is
referred to as
supraventricular
tachycardia.
Figure 4-8
Summary of characteristics of atrial tachycardia.
sha19766_cp04.indd 77
sha19766_cp04.indd 77 7/24/06 11:52:58 AM
7/24/06 11:52:58 AM
85. Chapter 4 Atrial Dysrhythmias 78
Atrial tachycardia arises from a single focus in the atria.
Figure 4-9
Atrial tachycardia.
sha19766_cp04.indd 78
sha19766_cp04.indd 78 7/24/06 11:52:58 AM
7/24/06 11:52:58 AM
86. Chapter 4 Atrial Dysrhythmias 79
Multifocal atrial tachycardia characteristics
Rate: 120 to 150 beats per minute
Regularity: Irregular
P waves: P„ waves change in morphology (appearance) from beat to beat
(at least three different shapes)
QRS complexes: Normal
PR interval: Varies
QT interval: Usually within normal limits but may vary
Figure 4-10
Summary of characteristics of multifocal atrial tachycardia.
sha19766_cp04.indd 79
sha19766_cp04.indd 79 7/24/06 11:52:58 AM
7/24/06 11:52:58 AM
87. Chapter 4 Atrial Dysrhythmias 80
In multifocal atrial tachycardia, the pacemaker site shifts between the SA node, atria, and/or
the AV junction.
Figure 4-11
Multifocal atrial tachycardia.
sha19766_cp04.indd 80
sha19766_cp04.indd 80 7/24/06 11:52:58 AM
7/24/06 11:52:58 AM
88. Chapter 4 Atrial Dysrhythmias 81
Atrial flutter characteristics
Rate: Ventricular rate may be slow, normal, or fast; atrial rate is
between 250 and 350 beats per minute
Regularity: May be regular or irregular (depending on whether the
conduction ratio stays the same or varies)
P waves: Absent, instead there are flutter waves; the ratio of atrial
waveforms to QRS complexes may be 2:1, 3:1, or 4:1. An
atrial-to-ventricular conduction ratio of 1:1 is rare
QRS complexes: Normal
PR interval: Not measurable
QT interval: Not measurable
Figure 4-12
Summary of characteristics of atrial flutter.
sha19766_cp04.indd 81
sha19766_cp04.indd 81 7/24/06 11:52:58 AM
7/24/06 11:52:58 AM
89. Chapter 4 Atrial Dysrhythmias 82
Atrial flutter arises from rapid depolarization of a single focus in the atria.
Figure 4-13
Atrial flutter.
sha19766_cp04.indd 82
sha19766_cp04.indd 82 7/24/06 11:52:59 AM
7/24/06 11:52:59 AM
90. Chapter 4 Atrial Dysrhythmias 83
Atrial fibrillation characteristics
Rate: Ventricular rate may be slow, normal, or fast; atrial rate is
greater than 350 beats per minute
Regularity: Totally (chaotically) irregular
P waves: Absent; instead there is a chaotic-looking baseline
QRS complexes: Normal
PR interval: Absent
QT interval: Unmeasurable
Figure 4-14
Summary of characteristics of atrial fibrillation.
sha19766_cp04.indd 83
sha19766_cp04.indd 83 7/24/06 11:52:59 AM
7/24/06 11:52:59 AM
91. Chapter 4 Atrial Dysrhythmias 84
Atrial fibrillation arises from many different sites in the atria.
Figure 4-15
Atrial fibrillation.
sha19766_cp04.indd 84
sha19766_cp04.indd 84 7/24/06 11:52:59 AM
7/24/06 11:52:59 AM
93. Chapter 5 Junctional Dysrhythmias 86
What is in this chapter
• Premature junctional complexes (PJCs)
characteristics
• Junctional escape rhythm characteristics
• Accelerated junctional rhythm
characteristics
• Junctional tachycardia characteristics
Characteristics common to junctional dysrhythmias
• Arise from the AV junction, the area around the AV node, or the bundle of His.
• P’ wave may be inverted (when they would otherwise be upright) with a short P’R interval
(less than 0.12 seconds in duration).
• Alternatively, the P’ wave may be absent (as it is buried by the QRS complex), or it may
follow the QRS complex. If the P’ wave is buried in the QRS complex it can change the
morphology of the QRS complex.
• If present, P’R intervals are shortened.
• QRS complexes are normal (unless there is an interventricular conduction defect or
aberrancy).
sha19766_cp05.indd 86
sha19766_cp05.indd 86 7/24/06 1:51:31 PM
7/24/06 1:51:31 PM
94. Chapter 5 Junctional Dysrhythmias 87
Premature junctional complexes (PJCs) characteristics
Rate: Depends on the underlying rhythm
Regularity: May be occasionally irregular or frequently irregular (depends
on the number of PJCs present). It may also be seen as patterned
irregularity if bigeminal, trigeminal, or quadrigeminal PJCs are
seen.
P waves: Inverted—may immediately precede, occur during (absent), or
follow the QRS complex
QRS complexes: Normal
PR interval: Will be shorter than normal if the P„ wave precedes the QRS
complex and absent if the P„ wave is buried in the QRS; referred
to as the RP„ interval if the P„ wave follows the QRS complex
QT interval: Usually within normal limits
Figure 5-1
Summary of characteristics of premature junctional complexes (PJCs).
PJCs are typically followed by a non-compensatory pause.
sha19766_cp05.indd 87
sha19766_cp05.indd 87 7/24/06 1:51:31 PM
7/24/06 1:51:31 PM
95. Chapter 5 Junctional Dysrhythmias 88
Premature junctional complex arises from somewhere in the AV junction.
Figure 5-2
Summary of characteristics of premature junctional complexes (PJCs).
sha19766_cp05.indd 88
sha19766_cp05.indd 88 7/24/06 1:51:32 PM
7/24/06 1:51:32 PM
96. Chapter 5 Junctional Dysrhythmias 89
Junctional escape rhythm characteristics
Rate: 40 to 60 beats per minute
Regularity: Regular
P waves: Inverted—may immediately precede, occur during (absent), or
follow the QRS complex
QRS complexes: Normal
PR interval: Will be shorter than normal if the P„wave precedes the QRS
complex and absent if the P„ wave is buried in the QRS; referred
to as the RP„ interval if the P„ wave follows the QRS complex
QT interval: Usually within normal limits
Figure 5-3
Summary of characteristics of junctional escape rhythm.
sha19766_cp05.indd 89
sha19766_cp05.indd 89 7/24/06 1:51:32 PM
7/24/06 1:51:32 PM
97. Chapter 5 Junctional Dysrhythmias 90
Junctional escape rhythm arises from a single site in the AV junction.
Figure 5-4
Junctional escape rhythm.
Junctional escape rhythm
40 to 60 beats per minute
Accelerated junctional rhythm
60 to 100 beats per minute
Junctional tachycardia
100 to 180 beats per minute
sha19766_cp05.indd 90
sha19766_cp05.indd 90 7/24/06 1:51:32 PM
7/24/06 1:51:32 PM
98. Chapter 5 Junctional Dysrhythmias 91
Accelerated junctional rhythm characteristics
Rate: 60 to 100 beats per minute
Regularity: Regular
P waves: Inverted—may immediately precede, occur during (absent), or
follow the QRS complex
QRS complexes: Normal
PR interval: Will be shorter than normal if the P„ wave precedes the QRS
complex and absent if the P„ wave is buried in the QRS; referred
to as the RP„ interval if the P„ wave follows the QRS complex
QT interval: Usually within normal limits
Figure 5-5
Summary of characteristics of accelerated junctional rhythm.
sha19766_cp05.indd 91
sha19766_cp05.indd 91 7/24/06 1:51:32 PM
7/24/06 1:51:32 PM
99. Chapter 5 Junctional Dysrhythmias 92
Accelerated junctional rhythm arises from a single site in the AV junction.
Figure 5-6
Accelerated junctional rhythm.
Junctional escape rhythm
40 to 60 beats per minute
Accelerated junctional rhythm
60 to 100 beats per minute
Junctional tachycardia
100 to 180 beats per minute
sha19766_cp05.indd 92
sha19766_cp05.indd 92 7/24/06 1:51:32 PM
7/24/06 1:51:32 PM
100. Chapter 5 Junctional Dysrhythmias 93
Junctional tachycardia characteristics
Rate: 100 to 180 beats per minute
Regularity: Regular
P waves: Inverted—may immediately precede, occur during (absent), or
follow the QRS complex
QRS complexes: Normal
PR interval: Will be shorter than normal if the P„ wave precedes the QRS
complex and absent if the P„ wave is buried in the QRS; referred
to as the RP„ interval if the P„ wave follows the QRS complex
QT interval: Usually within normal limits
Figure 5-7
Summary of characteristics of junctional tachycardia.
sha19766_cp05.indd 93
sha19766_cp05.indd 93 7/24/06 1:51:33 PM
7/24/06 1:51:33 PM
101. Chapter 5 Junctional Dysrhythmias 94
Junctional tachycardia arises from a single focus in the AV junction.
Figure 5-8
Junctional tachycardia.
Junctional escape rhythm
40 to 60 beats per minute
Accelerated junctional rhythm
60 to 100 beats per minute
Junctional tachycardia
100 to 180 beats per minute
sha19766_cp05.indd 94
sha19766_cp05.indd 94 7/24/06 1:51:33 PM
7/24/06 1:51:33 PM
103. Chapter 6 Ventricular Dysrhythmias 96
What is in this chapter
• Premature ventricular complexes (PVCs)
characteristics
• Idioventricular rhythm characteristics
• Accelerated idioventricular rhythm
characteristics
• Ventricular tachycardia characteristics
Characteristics common to ventricular dysrhythmias
• Arise from the ventricles below the bundle of His.
• QRS complexes are wide (greater than 0.12 seconds in duration) and bizarre looking.
• Ventricular beats have T waves in the opposite direction of the R wave.
• P waves are not visible as they are hidden in the QRS complexes.
sha19766_cp06.indd 96
sha19766_cp06.indd 96 7/24/06 1:55:30 PM
7/24/06 1:55:30 PM
104. Chapter 6 Ventricular Dysrhythmias 97
Premature ventricular complexes (PVCs) characteristics
Rate: Depends on the underlying rhythm
Regularity: May be occasionally irregular or frequently irregular (depends
on the number of PVCs present). It may also be seen as pat-
terned irregularity if bigeminal, trigeminal, or quadrigeminal
PVCs are seen.
P waves: Not preceded by a P wave (if seen, they are dissociated)
QRS complexes: Wide, large, and bizarre looking
PR interval: Not measurable
QT interval: Usually prolonged with the PVC
Figure 6-1
Summary of characteristics of premature ventricular complexes.
PVCs are followed by a compensatory pause.
Sometimes, PVCs originate from only one location in the ventricle. These beats look the same and are called
uniform (also referred to as unifocal) PVCs. Other times, PVCs arise from different sites in the ventricles. These
beats tend to look different from each other and are called multiformed (multifocal) PVCs.
sha19766_cp06.indd 97
sha19766_cp06.indd 97 7/24/06 1:55:31 PM
7/24/06 1:55:31 PM
106. Chapter 6 Ventricular Dysrhythmias 99
PVCs that occur one
after the other (two
PVCs in a row) are
called a couplet, or
pair.
Three or more PVCs
in a row at a ventricu-
lar rate of at least 100
BPM is called ven-
tricular tachycardia. It
may be called a salvo,
run, or burst of ven-
tricular tachycardia.
Figure 6-4
Run of PVCs.
Figure 6-3
Couplet of PVCs.
sha19766_cp06.indd 99
sha19766_cp06.indd 99 7/24/06 1:55:31 PM
7/24/06 1:55:31 PM
107. Chapter 6 Ventricular Dysrhythmias 100
Figure 6-6 R-on-T PVC.
An interpolated PVC
occurs when a PVC
does not disrupt the
normal cardiac cycle.
It appears as a PVC
squeezed between two
regular complexes.
A PVC occurring on
or near the previous
T wave is called an
R-on-T PVC.
PVC that occurs on or near the T wave can
precipitate ventricular tachycardia or fibrillation
Figure 6-5 Interpolated PVC.
sha19766_cp06.indd 100
sha19766_cp06.indd 100 7/24/06 1:55:31 PM
7/24/06 1:55:31 PM
108. Chapter 6 Ventricular Dysrhythmias 101
Idioventricular rhythm characteristics
Rate: 20 to 40 beats per minute (may be slower)
Regularity: Regular
P waves: Not preceded by a P wave (if seen, they are dissociated and
would therefore be a 3rd-degree heart block with an idioven-
tricular escape)
QRS complexes: Wide, large, and bizarre looking
PR interval: Not measurable
QT interval: Usually prolonged
Figure 6-7
Summary of characteristics of idioventricular rhythm.
sha19766_cp06.indd 101
sha19766_cp06.indd 101 7/24/06 1:55:31 PM
7/24/06 1:55:31 PM
109. Chapter 6 Ventricular Dysrhythmias 102
Idioventricular rhythm arises from a single site in the ventricles(s).
Figure 6-8
Idioventricular rhythm.
Idioventricular rhythm arises from a single site in the ventricles.
Rate is 20 to
40 beats per
minute
Rhythm is
regular
P waves are not visible as
they are hidden in the QRS
complexes
QRS complexes are
wide and bizarre in
appearance, have T
waves in the
opposite direction of
the R wave
PR intervals
are absent
Idioventricular rhythm
20 to 40 beats per minute
Accelerated idioventricular rhythm
40 to 100 beats per minute
Ventricular tachycardia
100 to 250 beats per minute
sha19766_cp06.indd 102
sha19766_cp06.indd 102 7/24/06 1:55:32 PM
7/24/06 1:55:32 PM
110. Chapter 6 Ventricular Dysrhythmias 103
Accelerated idioventricular rhythm characteristics
Rate: 40 to 100 beats per minute
Regularity: Regular
P waves: Not preceded by a P wave
QRS complexes: Wide, large, and bizarre looking
PR interval: Not measurable
QT interval: Usually prolonged
Figure 6-9
Summary of characteristics of accelerated idioventricular rhythm.
sha19766_cp06.indd 103
sha19766_cp06.indd 103 7/24/06 1:55:32 PM
7/24/06 1:55:32 PM
111. Chapter 6 Ventricular Dysrhythmias 104
Accelerated idioventricular rhythm arises from a single site in the ventricles(s).
Figure 6-10
Accelerated idioventricular rhythm.
Idioventricular rhythm
20 to 40 beats per minute
Accelerated idioventricular rhythm
40 to 100 beats per minute
Ventricular tachycardia
100 to 250 beats per minute
sha19766_cp06.indd 104
sha19766_cp06.indd 104 7/24/06 1:55:32 PM
7/24/06 1:55:32 PM
112. Chapter 6 Ventricular Dysrhythmias 105
Ventricular tachycardia characteristics
Rate: 100 to 250 beats per minute
Regularity: Regular
P waves: Not preceded by a P wave (if seen, they are dissociated)
QRS complexes: Wide, large, and bizarre looking
PR interval: Not measurable
QT interval: Not measurable
Ventricular tachycardia may be monomorphic, where the appearance of each QRS complex is similar, or
polymorphic, where the appearance varies considerably from complex to complex.
Figure 6-11
Summary of characteristics of ventricular tachycardia.
sha19766_cp06.indd 105
sha19766_cp06.indd 105 7/24/06 1:55:33 PM
7/24/06 1:55:33 PM
113. Chapter 6 Ventricular Dysrhythmias 106
Ventricular tachycardia arises from a single site in the ventricles(s).
Idioventricular rhythm
20 to 40 beats per minute
Accelerated idioventricular rhythm
40 to 100 beats per minute
Ventricular tachycardia
100 to 250 beats per minute
Two other conditions to be familiar with:
Ventricular fibrillation (VF)—results from chaotic firing of multiple sites in the ventricles. This causes the
heart muscle to quiver, much like a handful of worms, rather than contracting efficiently. On the ECG monitor
it appears like a wavy line, totally chaotic, without any logic.
Asystole—is the absense of any cardiac activity. It appears as a flat (or nearly flat) line on the monitor screen.
Figure 6-12
Ventricular tachycardia.
sha19766_cp06.indd 106
sha19766_cp06.indd 106 7/24/06 1:55:33 PM
7/24/06 1:55:33 PM
115. Chapter 7 AV Heart Blocks 108
What is in this chapter
• 1st-degree AV heart block characteristics
• 2nd-degree AV heart block, Type I
(Wenckebach) characteristics
• 2nd-degree AV heart block, Type II
characteristics
• 3rd-degree AV heart block characteristics
Characteristics common to AV heart blocks
• P waves are upright and round. In 1st-degree AV block all the P waves are followed
by a QRS complex. In 2nd-degree AV block not all the P waves are followed by a QRS
complex, and in 3rd-degree block there is no relationship between the P waves and
QRS complexes.
• In 1st-degree AV block PR interval is longer than normal and constant. In 2nd-degree
AV block, Type I, in a cyclical manner the PR interval is progressively longer until a
QRS complex is dropped. In 2nd-degree AV block, Type II, the PR interval of the con-
ducted beats is constant. In 3rd-degree block there is no PR interval.
• QRS complexes may be normal or wide.
sha19766_cp07.indd 108
sha19766_cp07.indd 108 7/24/06 1:59:52 PM
7/24/06 1:59:52 PM
116. Chapter 7 AV Heart Blocks 109
1st-degree AV heart block characteristics
Rate: Underlying rate may be slow, normal, or fast
Regularity: Underlying rhythm is usually regular
P waves: Present and normal and all are followed by a QRS complex
QRS complexes: Should be normal
PR interval: Longer than 0.20 seconds and is constant (the same each time)
QT interval: Usually within normal limits
Figure 7-1
Summary of characteristics of 1st-degree AV block.
sha19766_cp07.indd 109
sha19766_cp07.indd 109 7/24/06 1:59:52 PM
7/24/06 1:59:52 PM
117. Chapter 7 AV Heart Blocks 110
In 1st-degree AV heart block impulses arise from the SA node but their passage through the AV node is
delayed.
Figure 7-2
1st-degree AV block.
Delay
Delay
Delay
Delay
Delay
Delay
sha19766_cp07.indd 110
sha19766_cp07.indd 110 7/24/06 1:59:52 PM
7/24/06 1:59:52 PM
118. Chapter 7 AV Heart Blocks 111
2nd-degree AV heart block, Type I (Wenckebach) characteristics
Rate: Ventricular rate may be slow, normal, or fast; atrial rate is within
normal range
Regularity: Patterned irregularity
P waves: Present and normal; not all the P waves are followed by a QRS
complex
QRS complexes: Should be normal
PR interval: Progressively longer until a QRS complex is dropped; the cycle
then begins again
QT interval: Usually within normal limits
Figure 7-3
Summary of characteristics of 2nd-degree AV block, Type I.
sha19766_cp07.indd 111
sha19766_cp07.indd 111 7/24/06 1:59:52 PM
7/24/06 1:59:52 PM
119. Chapter 7 AV Heart Blocks 112
In 2nd-degree AV heart block, Type I (Wenckebach), impulses arise from the SA node but their passage
through the AV node is progressively delayed until the impulse is blocked.
Figure 7-4
2nd-degree AV block, Type I. Delay
Mor
e
dela
y
Even
more
delay
Impulse
is
blocked
Blocked
Delay
More
delay
sha19766_cp07.indd 112
sha19766_cp07.indd 112 7/24/06 1:59:52 PM
7/24/06 1:59:52 PM
120. Chapter 7 AV Heart Blocks 113
2nd-degree AV heart block, Type II characteristics
Rate: Ventricular rate may be slow, normal, or fast; atrial rate is within
normal range
Regularity: May be regular or irregular (depends on whether conduction
ratio remains the same)
P waves: Present and normal; not all the P waves are followed by a QRS
complex
QRS complexes: Should be normal
PR interval: Constant for all conducted beats
QT interval: Usually within normal limits
Figure 7-5
Summary of characteristics of 2nd-degree AV block, Type II.
sha19766_cp07.indd 113
sha19766_cp07.indd 113 7/24/06 1:59:52 PM
7/24/06 1:59:52 PM
121. Chapter 7 AV Heart Blocks 114
In 2nd-degree AV heart block, Type II, impulses arise from the SA node but some are blocked
in the bundle of His or bundle branches.
Figure 7-6
2nd-degree AV block, Type II.
Blocked
Blocked
Blocked
sha19766_cp07.indd 114
sha19766_cp07.indd 114 7/24/06 1:59:52 PM
7/24/06 1:59:52 PM
122. Chapter 7 AV Heart Blocks 115
3rd-degree AV heart block characteristics
Rate: Ventricular rate may be slow, normal, or fast; atrial rate is within
normal range
Regularity: Atrial rhythm and ventricular rhythms are regular but not relat-
ed to one another
P waves: Present and normal; not related to the QRS complexes; appear to
march through the QRS complexes
QRS complexes: Normal if escape focus is junctional and widened if escape focus
is ventricular
PR interval: Not measurable
QT interval: May or may not be within normal limits
Figure 7-7
Summary of characteristics of 3rd-degree AV block.
sha19766_cp07.indd 115
sha19766_cp07.indd 115 7/24/06 1:59:53 PM
7/24/06 1:59:53 PM
123. Chapter 7 AV Heart Blocks 116
In 3rd-degree AV heart block there is a complete block at the AV node resulting in the atria being
depolarized by an impulse that arises from the SA node and the ventricles being depolarized by an
escape pacemaker that arises somewhere below the AV node.
Figure 7-8
3rd-degree AV block.
Blocked
Blocked
Blocked
Blocked
Blocked
Blocked
Blocked
Blocked
E
s
c
a
p
e
E
sc
a
p
e
Escape
E
s
c
a
p
e
sha19766_cp07.indd 116
sha19766_cp07.indd 116 7/24/06 1:59:53 PM
7/24/06 1:59:53 PM
125. Chapter 8 Electrical Axis 118
What is in this chapter
• Direction of ECG waveforms
• Mean QRS Vector
• Methods for Determining
QRS axis
• Lead I
• Lead aVF
• Axis Deviation
sha19766_cp08.indd 118
sha19766_cp08.indd 118 7/24/06 2:05:47 PM
7/24/06 2:05:47 PM
126. Chapter 8 Electrical Axis 119
Direction of ECG waveforms
• Depolarization and repolarization of
the cardiac cells produce many small
electrical currents called instanta-
neous vectors.
• The mean, or average, of all the
instantaneous vectors is called the
mean vector.
• When an impulse is traveling toward
a positive electrode, the ECG machine
records it as a positive or upward
deflection.
• When the impulse is traveling away
from a positive electrode and toward
a negative electrode, the ECG
machine records it as a negative or
downward deflection.
Negative
electrode
Positive
electrode
–
+
Impulses traveling
toward a positive
electrode produce
an upward
deflection
Impulses traveling
away from a
positive electrode
and/or toward a
negative
electrode
produce
downward
deflections
Figure 8-1
Direction of ECG waveforms when the electrical cur-
rent is traveling toward a positive ECG electrode or
away from it.
sha19766_cp08.indd 119
sha19766_cp08.indd 119 7/24/06 2:05:47 PM
7/24/06 2:05:47 PM
127. Chapter 8 Electrical Axis 120
Mean QRS Vector
• The sum of all the small vectors of ventricular
depolarization is called the mean QRS vector.
• Because the depolarization vectors of the
thicker left ventricle are larger, the mean QRS
axis points downward and toward the patient’s
left side.
• Changes in the size or condition of the heart
muscle and/or conduction system can affect
the direction of the mean QRS vector.
• If an area of the heart is enlarged or damaged,
specific ECG leads can provide a view of that
portion of the heart.
• While there are several methods used to
determine the direction of the patient’s elec-
trical axis, the easiest is the four-quadrant
method.
Figure 8-2
Direction of of the mean QRS axis.
A
V
n
o
d
e
Mean QRS axis
Impulse originates in SA
sha19766_cp08.indd 120
sha19766_cp08.indd 120 7/24/06 2:05:47 PM
7/24/06 2:05:47 PM
128. Chapter 8 Electrical Axis 121
+180°
+150°
+120°
+90°
+60°
+30°
0°
–30°
–60°
–90°
–120°
–150°
M
ean
QRS
axis
Lead aVF
Lead I
AV
node
Method for determining QRS axis
• The four-quadrant method works in the following
manner:
∞ An imaginary circle is drawn over the patient’s
chest; it represents the frontal plane.
∞ Within the circle are six bisecting lines, each
representing one of the six limb leads.
∞ The intersection of all lines divides the circle
into equal, 30-degree segments.
• The mean QRS axis normally remains
between 0 and +90° degrees.
∞ As long as it stays in this range it is
considered normal.
∞ If it is outside this range, it is considered
abnormal.
∞ Leads I and aVF can be used to determine
if the mean QRS is in its normal position.
Figure 8-3
Normal direction of the mean QRS axis.
sha19766_cp08.indd 121
sha19766_cp08.indd 121 7/24/06 2:05:48 PM
7/24/06 2:05:48 PM
129. Chapter 8 Electrical Axis 122
Lead I
• Lead I is oriented at 0° (located at
the three o’clock position).
• A positive QRS complex indicates
the mean QRS axis is moving from
right to left in a normal manner and
directed somewhere between –90°
and +90° (the right half of the circle).
• If the QRS complex points down
(negative), then the impulses are
moving from left to right; this is
considered abnormal.
Figure 8-4
A positive QRS complex is seen in lead I if the mean QRS axis is
directed anywhere between –90 and +90.
+
+ +
+
+
+
+ +
+
+
+
+
+
+
+
+ +
–
–
–
–
–
–
–
–
– –
– –
+
Right
+90°
Left
–90°
Lead I
– +
QRS
in lead I
AV
node
Mean QRS axis
Left arm electrode
sha19766_cp08.indd 122
sha19766_cp08.indd 122 7/24/06 2:05:48 PM
7/24/06 2:05:48 PM
130. Chapter 8 Electrical Axis 123
+
+
+
+
+
+
+ +
+
+
+
+
+
+
+
+
+
–
–
–
–
–
–
–
–
–
–
–
–
–
–
+
+180° 0°
Top
+
AV
node
Bottom
Lead aVF
QRS
in lead
aVF
Mean QRS axis
Lead aVF
• Lead aVF is oriented at +90° and is
located at the six o’clock position.
• If the mean QRS axis is directed any-
where between 0° and –180° (the
bottom half of the circle), you can
expect aVF lead to record a positive
QRS complex.
• If the mean QRS is directed toward the
top half of the circle, the QRS complex
points downward.
Figure 8-5
A positive QRS complex is seen in lead aVF if the mean QRS
axis is directed anywhere between 0 and 180 degrees.
sha19766_cp08.indd 123
sha19766_cp08.indd 123 8/17/06 11:56:47 AM
8/17/06 11:56:47 AM
131. Chapter 8 Electrical Axis 124
Axis deviation
• Positive QRS complexes in lead I and aVF indi-
cate a normal QRS axis.
• A negative QRS complex in lead I and an upright
QRS complex in lead aVF indicates right axis
deviation.
• An upright QRS complex in lead I and a nega-
tive QRS complex in lead aVF indicates left axis
deviation.
• Negative QRS complexes in both lead I and lead
aVF indicates extreme axis deviation.
• Persons who are thin, obese, or pregnant can
have axis deviation due to a shift in the position
of the apex of the heart.
• Myocardial infarction, enlargement, or hypertro-
phy of one or both of the heart’s chambers, and
hemiblock can also cause axis deviation.
Figure 8-6
Direction of QRS complexes in lead I and aVF indicate
changes in size or condition of the heart muscle and/or
conduction system.
+180°
+150°
+120°
+90°
+60°
+30°
0°
–30°
–60°
–90°
–120°
–150°
Lead I
+
+
I
I
aVF aVF
I
I
aVF aVF
Lead aVF
Extreme
axis
deviation
Left axis
deviation
Right axis
deviation
Normal
axis
sha19766_cp08.indd 124
sha19766_cp08.indd 124 7/24/06 2:05:49 PM
7/24/06 2:05:49 PM
133. Chapter 9 Hypertrophy, Bundle Branch Block, and Preexcitation 126
What is in this chapter
• Right atrial enlargement
• Right ventricular hypertrophy
• Right bundle branch block
• Left atrial enlargement
• Left ventricular hypertrophy
• Left bundle branch block
• Left anterior hemiblock
• Left posterior hemiblock
• Wolff-Parkinson-White (WPW)
syndrome
• Lown-Ganong-Levine (LGL) syndrome
sha19766_cp09.indd 126
sha19766_cp09.indd 126 7/24/06 2:10:00 PM
7/24/06 2:10:00 PM
134. Chapter 9 Hypertrophy, Bundle Branch Block, and Preexcitation 127
Right atrial enlargement
• Leads II and V1 provide the necessary infor-
mation to assess atrial enlargement.
• Indicators of right atrial enlargement
include:
∞ An increase in the amplitude of the first
part of the P wave.
∞ The P wave is taller than 2.5 mm.
∞ If the P wave is biphasic, the initial
component is taller than the terminal
component.
• The width of the P wave, however, stays
within normal limits because its terminal
part originates from the left atria, which
depolarizes normally if left atrial enlarge-
ment is absent.
+
+
Right atrial
enlargement
Lead II
Lead
V1
P pulmonale
II, III, and aVF
Biphasic P wave
V1
Figure 9-1
Right atrial enlargement leads to an increase in the
amplitude of the first part of the P wave.
sha19766_cp09.indd 127
sha19766_cp09.indd 127 7/24/06 2:10:00 PM
7/24/06 2:10:00 PM
135. Chapter 9 Hypertrophy, Bundle Branch Block, and Preexcitation 128
Left atrial enlargement
• Indicators of left atrial enlargement include:
∞ The amplitude of the terminal portion of the
P wave may increase in V1.
∞ The terminal (left atrial) portion of the P
wave drops at least 1 mm below the iso-
electric line (in lead V1).
∞ There is an increase in the duration or
width of the terminal portion of the P wave
of at least one small square (0.04 seconds).
• Often the presence of ECG evidence of left
atrial enlargement only reflects a nonspecific
conduction irregularity. However, it may also
be the result of mitral valve stenosis causing
the left atria to enlarge to force blood across
the stenotic (tight) mitral valve.
Figure 9-2
Left atrial enlargement leads to an increase in the amplitude
and width of the terminal part of the P wave.
+
+
Left atrial
enlargement
P wave
Lead II
Lead V1
Broad
P wave
Biphasic
P wave
V1–V2
Notched P wave
(P mitrale)
I, II, and V4–V6
sha19766_cp09.indd 128
sha19766_cp09.indd 128 7/24/06 2:10:00 PM
7/24/06 2:10:00 PM
136. Chapter 9 Hypertrophy, Bundle Branch Block, and Preexcitation 129
Right ventricular hypertrophy
• Key indicators of right ventricular hyper-
trophy include:
∞ The presence of right axis deviation
(with the QRS axis exceeding +100°).
• The R wave larger than the S wave in lead
V1, whereas the S wave is larger than the
R wave in lead V6.
Left ventricular hypertrophy
• Key ECG indicators of left ventricular
hypertrophy include:
∞ Increased R wave amplitude in those
leads overlying the left ventricle.
∞ The S waves are smaller in leads over-
lying the left ventricle, but larger in
leads overlying the right ventricle.
Figure 9-3
In right ventricular hypertrophy the QRS axis moves to
between +90 and +180 degrees. The QRS complexes in right
ventricular hypertrophy are slightly more negative in lead I
and positive in lead aVF.
+
+
+180° 0°
+90°
–90°
Lead I
Lead aVF
Right ventricular
hypertrophy
aVF
M
ean
Q
RS
axis
sha19766_cp09.indd 129
sha19766_cp09.indd 129 7/24/06 2:10:00 PM
7/24/06 2:10:00 PM
137. Chapter 9 Hypertrophy, Bundle Branch Block, and Preexcitation 130
Right ventricular
hypertrophy
Starting with V1, the waveforms take an
upward deflection but then moving toward
V6 the waveforms take a downward
deflection
V1 V2 V3 V4
S
R
Figure 9-4
The thick wall of the enlarged right ventricle causes
the R waves to be more positive in the leads that lie
closer to lead V1.
Mean QRS axis
+180° 0°
–90°
The mean QRS axis moves
farther leftward resulting in
left axis deviation
R
S
V1 V2 V3 V4 V5 V6
+90°
Left ventricular
hypertrophy
Figure 9-5
The thick wall of the enlarged left ventricle causes the R waves to be
more positive in the leads that lie closer to lead V6 and the S waves to
be larger in the leads closer to V1.
V1 V2 V3 V4 V5 V6
S
R
sha19766_cp09.indd 130
sha19766_cp09.indd 130 7/24/06 2:10:00 PM
7/24/06 2:10:00 PM
138. Chapter 9 Hypertrophy, Bundle Branch Block, and Preexcitation 131
Right bundle branch block
• The best leads for identifying right bundle
branch are V1 and V2.
• Right bundle block causes the QRS com-
plex to have a unique shape — its appear-
ance has been likened to rabbit ears or the
letter “M.”
∞ As the left ventricle depolarizes, it pro-
duces the initial R and S waves, but as
the right ventricle begins its delayed
depolarization, it produces a tall R wave
(called the R„).
• In the left lateral leads overlying the left
ventricle (I, aVL, V5, and V6), late right ven-
tricular depolarization causes reciprocal
late broad S waves to be generated.
Figure 9-6
In right bundle branch block, conduction through the
right bundle is blocked causing depolarization of the
right ventricle to be delayed; it does not start until the
left ventricle is almost fully depolarized.
+ +
+
+
V1 V2
V5 V6
R
R R
S
S
S
R⬘ R⬘
r⬘
Block
QRS
configuration
in V5, V6, I, aVL
QRS
configuration
in V1, V2
Late broad S waves
Different M-shaped configurations
that may be seen
sha19766_cp09.indd 131
sha19766_cp09.indd 131 7/24/06 2:10:01 PM
7/24/06 2:10:01 PM
139. Chapter 9 Hypertrophy, Bundle Branch Block, and Preexcitation 132
Left bundle branch block
• Leads V5 and V6 are best for identifying left
bundle branch block.
∞ QRS complexes in these leads normally
have tall R waves, whereas delayed
left ventricular depolarization leads to a
marked prolongation in the rise of those
tall R waves, which will either be flat-
tened on top or notched (with two tiny
points), referred to as an R, R„ wave.
∞ True rabbit ears are less likely to be seen
than in right bundle branch block.
• Leads V1 and V2 (leads overlying the right
ventricle) will show reciprocal, broad, deep
S waves.
V1 V2
V5
V6
R⬘
+
+ +
+
Block
R
R
R⬘ R⬘ R⬘
R
R R
QRS
configuration
in V1, V2
QRS
configuration
in V5, V6
Different configurations
that may be seen
QS Deep S
Figure 9-7
In left bundle branch block, conduction through the left bundle is
blocked causing depolarization of the left ventricle to be delayed; it
does not start until the right ventricle is almost fully depolarized.
sha19766_cp09.indd 132
sha19766_cp09.indd 132 7/24/06 2:10:02 PM
7/24/06 2:10:02 PM
140. Chapter 9 Hypertrophy, Bundle Branch Block, and Preexcitation 133
Left anterior hemiblock
• With left anterior hemiblock, depolar-
ization of the left ventricle occurs pro-
gressing in an inferior-to-superior and
right-to-left direction.
∞ This causes the axis of ventricu-
lar depolarization to be redirected
upward and slightly to the left, pro-
ducing tall positive R waves in the
left lateral leads and deep S waves
inferiorly.
∞ This results in left axis deviation with
an upright QRS complex in lead I and
a negative QRS in lead aVF.
+
+
Block
Left axis
deviation
Deep S
Small R
QRS
configuration
in lead III
Small Q
QRS
configuration
in lead I
+180° 0°
+90°
–90°
Lead aVF
Lead I
Tall R
Figure 9-8
With left anterior hemiblock, conduction down the left anterior fas-
cicle is blocked resulting in all the current rushing down the left poste-
rior fascicle to the inferior surface of the heart.
sha19766_cp09.indd 133
sha19766_cp09.indd 133 7/24/06 2:10:02 PM
7/24/06 2:10:02 PM
141. Chapter 9 Hypertrophy, Bundle Branch Block, and Preexcitation 134
Left posterior hemiblock
• In left posterior hemiblock, ventricular
myocardial depolarization occurs in
a superior-to-inferior and left-to-right
direction.
∞ This causes the main electrical axis
to be directed downward and to the
right, producing tall R waves infe-
riorly and deep S waves in the left
lateral leads.
∞ This results in right axis deviation.
With a negative QRS in lead I and a
positive QRS in lead aVF.
• In contrast to complete left and right
bundle branch block, in hemiblocks,
the QRS complex is not prolonged.
+
+
Block
Right axis
deviation
Small Q
Tall R
QRS
configuration
in lead III
Deep S
Small
R
QRS
configuration
in lead I
Lead aVF
Figure 9-9
With left posterior hemiblock, conduction down the left
posterior fascicle is blocked resulting in all the current
rushing down the left anterior fascicle to the myocardium.
sha19766_cp09.indd 134
sha19766_cp09.indd 134 7/24/06 2:10:02 PM
7/24/06 2:10:02 PM
142. Chapter 9 Hypertrophy, Bundle Branch Block, and Preexcitation 135
Wolff-Parkinson-White
(WPW) syndrome
• WPW is identified through the
following ECG features:
∞ Rhythm is regular.
∞ P waves are normal.
∞ QRS complexes are wid-
ened due to a characteristic
slurred initial upstroke,
called the delta wave.
∞ PR interval is usually short-
ened (less than 0.12 sec-
onds).
• WPW can predispose the
patient to various tachydys-
rhythmias; the most common
is PSVT.
Figure 9-10
In WPW, the bundle of Kent, an accessory pathway, connects the atrium to the
ventricles, bypassing the AV node. The QRS complex is widened due to premature
activation of the ventricles.
Instead of the
impulse traveling
through the AV node,
it travels down an
accessory pathway
to the ventricles
Bundle of Kent
Delta
wave
Delta
wave
Delta
wave
Delta
wave
Delta
wave
Delta
wave
sha19766_cp09.indd 135
sha19766_cp09.indd 135 7/24/06 2:10:03 PM
7/24/06 2:10:03 PM
143. Chapter 9 Hypertrophy, Bundle Branch Block, and Preexcitation 136
Instead of traveling
through the AV node,
the impulse is carried
to the ventricles by
way of an intranodal
accessory pathway
James fibers
Impulse travels
down through
the atria
Lown-Ganong-Levine
(LGL) syndrome
• LGL is identified through the
following ECG features:
• Rhythm is regular.
∞ P waves are normal.
∞ The PR interval is less than
0.12 seconds.
∞ The QRS complex is not
widened.
∞ There is no delta wave.
• WPW and LGL are called
preexcitation syndromes and
are the result of accessory
conduction pathways between
the atria and ventricles.
Figure 9-11
In LGL, the impulse travels through an intranodal accessory pathway, referred
to as the James fibers, bypassing the normal delay within the AV node. This pro-
duces a shortening of the PR interval but no widening of the QRS complex.
sha19766_cp09.indd 136
sha19766_cp09.indd 136 7/24/06 2:10:03 PM
7/24/06 2:10:03 PM
145. Chapter 10 Myocardial Ischemia and Infarction 138
What is in this chapter
• ECG changes associated with
ischemia, injury, and infarction
• Identifying the location of myo-
cardial ischemia, injury, and
infarction
∞ Anterior
∞ Septal
∞ Lateral
∞ Inferior
∞ Posterior
sha19766_cp10.indd 138
sha19766_cp10.indd 138 7/24/06 2:17:15 PM
7/24/06 2:17:15 PM
146. Chapter 10 Myocardial Ischemia and Infarction 139
ECG changes associated with ischemia,
injury, and infarction
• The ECG can help identify the presence of ischemia,
injury, and/or infarction of the heart muscle.
• The three key ECG indicators are:
∞ Changes in the T wave (peaking or inversion).
∞ Changes in the ST segment (depression or
elevation).
∞ Enlarged Q waves or appearance of new Q waves.
• ST segment elevation is the earliest reliable sign that
myocardial infarction has occurred and tells us the
myocardial infarction is acute.
• Pathologic Q waves indicate the presence of irrevers-
ible myocardial damage or past myocardial infarction.
• Myocardial infarction can occur without the develop-
ment of Q waves.
Ischemia ST segment
changes
Inverted
T wave
Tall,
peaked
T wave
Depressed
ST segment
Elevated
ST
segment
T wave
changes
Q wave
changes
Injury
Infarction
Figure 10-1
Key ECG changes with ischemia, injury, or
infarction
sha19766_cp10.indd 139
sha19766_cp10.indd 139 7/24/06 2:17:15 PM
7/24/06 2:17:15 PM
147. Chapter 10 Myocardial Ischemia and Infarction 140
Figure 10-2
Leads V1, V2, V3, and V4 are used to identify ante-
rior myocardial infarction.
+
+
+
V1 V2 V3
V4
+
Anterior infarction
V1 V2 V3 V4
Identifying the location of myocardial
ischemia, injury, and infarction
• Leads V1, V2, V3, and V4 provide the best view for identi-
fying anterior myocardial infarction.
• Leads V1, V2, and V3 overlie the ventricular septum, so
ischemic changes seen in these leads, and possibly in
the adjacent precordial leads, are often considered to
be septal infarctions.
• Lateral infarction is identified by ECG changes such as ST
segment elevation; T wave inversion; and the develop-
ment of significant Q waves in leads I, aVL, V5, and V6.
• Inferior infarction is determined by ECG changes such as
ST segment elevation; T wave inversion; and the develop-
ment of significant Q waves in leads II, III, and aVF.
• Posterior infarctions can be diagnosed by looking for
reciprocal changes in leads V1 and V2.
sha19766_cp10.indd 140
sha19766_cp10.indd 140 7/24/06 2:17:15 PM
7/24/06 2:17:15 PM
148. Chapter 10 Myocardial Ischemia and Infarction 141
Figure 10-3
Leads V1, V2, and V3 are used to identify septal
myocardial infarction.
+
+
+
V1
V2 V3
V1 V2 V3
Septal infarction
+
+
+
+
aVL
V5
I
V6
aVL
V5 V6
I
Lateral infarction
Figure 10-4
Leads I, aVL, V5, and V6 are used to iden-
tify lateral myocardial infarction.
sha19766_cp10.indd 141
sha19766_cp10.indd 141 7/24/06 2:17:16 PM
7/24/06 2:17:16 PM
149. Chapter 10 Myocardial Ischemia and Infarction 142
Figure 10-5
Leads II, III, and aVF are used to identify infe-
rior myocardial infarction.
Figure 10-6
Leads V1 and V2 are used to identify posterior myocardial infarction.
+ + +
Inferior infarction
II III aVF
II III aVF
+
+
V1 V2 V3
Posterior infarction
Posterior view of heart
+
V1
V2 V3
sha19766_cp10.indd 142
sha19766_cp10.indd 142 7/24/06 2:17:16 PM
7/24/06 2:17:16 PM
151. Chapter 11 Other Cardiac Conditions 144
What is in this chapter
• Pericarditis
• Pericardial effusion with low-
voltage QRS complexes
• Pericardial effusion with electri-
cal alternans
• Pulmonary embolism
• Pacemakers
• Electrolyte imbalances
• Digoxin effects seen on the ECG
sha19766_cp11.indd 144
sha19766_cp11.indd 144 7/24/06 2:39:38 PM
7/24/06 2:39:38 PM
152. Chapter 11 Other Cardiac Conditions 145
Pericarditis
• Initially with pericarditis the T wave is upright
and may be elevated. During the recovery
phase it inverts.
• The ST segment is elevated and usually flat or
concave.
• While the signs and symptoms of pericarditis
and myocardial infarction are similar, certain
features of the ECG can be helpful in differenti-
ating between the two:
∞ The ST segment and T wave changes in
pericarditis are diffuse resulting in ECG
changes being present in all leads.
∞ In pericarditis, T wave inversion usually
occurs only after the ST segments have
returned to base line. In myocardial infarc-
tion, T wave inversion is usually seen before
ST segment normalization. (continued)
Effects on ECG
Effects of pericarditis on the heart
Normal
pericardium
Enlarged view
Inflamed
pericardium
ST segments and T waves are off the baseline,
gradually angling back down to the next QRS complex
Elevated ST segment is flat or concave
Figure 11-1
Pericarditis and ST segment elevation.
sha19766_cp11.indd 145
sha19766_cp11.indd 145 7/24/06 2:39:38 PM
7/24/06 2:39:38 PM
153. Chapter 11 Other Cardiac Conditions 146
∞ In pericarditis, Q wave development does not
occur.
Pericardial effusion with low-voltage
QRS complexes
• Pericardial effusion is a buildup of an abnormal
amount of fluid and/or a change in the character of
the fluid in the pericardial space.
∞ The pericardial space is the space between the
heart and the pericardial sac.
• Formation of a substantial pericardial effusion damp-
ens the electrical output of the heart, resulting in
low-voltage QRS complex in all leads.
• However, the ST segment and T wave changes of
pericarditis may still be seen.
I
aVR
aVL
aVF
II
III
Pericardial
sac
Collection
of fluid
Normal pericardium Pericardial effusion
Dampened
electrical
output
Figure 11-2
Pericardial effusion with low-voltage QRS complexes.
sha19766_cp11.indd 146
sha19766_cp11.indd 146 7/24/06 2:39:39 PM
7/24/06 2:39:39 PM
154. Chapter 11 Other Cardiac Conditions 147
Pericardial effusion with
electrical alternans
• If a pericardial effusion is large
enough, the heart may rotate freely
within the fluid-filled sac.
• This can cause electrical alternans, a
condition in which the electrical axis
of the heart varies with each beat.
• A varying axis is most easily recog-
nized on the ECG by the presence of
QRS complexes that change in height
with each successive beat.
• This condition can also affect the
P and T waves.
Figure 11-3 Pericardial effusion with electrical alternans.
Pericardial effusion
H
e
a
r
t
r
o
t
a
t
e
s
f
r
e
e
l
y
Pericardial
sac
Collection of
fluid
II
sha19766_cp11.indd 147
sha19766_cp11.indd 147 7/24/06 2:39:39 PM
7/24/06 2:39:39 PM
155. Chapter 11 Other Cardiac Conditions 148
Pulmonary embolism
• ECG changes that suggest the development of a
massive pulmonary embolus include:
∞ Tall, symmetrically peaked P waves in leads
II, III, and aVF and sharply peaked biphasic
P waves in leads V1 and V2.
∞ A large S wave in lead I, a deep Q wave in
lead III, and an inverted T wave in lead III.
This is called the S1 Q3 T3 pattern.
∞ ST segment depression in lead II.
∞ Right bundle branch block (usually subsides
after the patient improves).
∞ The QRS axis is greater than
+90° (right axis deviation).
∞ The T waves are inverted in leads V1–V4.
∞ Q waves are generally limited to lead III.
Embolus S1Q3T3
Large S wave
in lead I
ST segment
depression
in lead II
Large Q wave
in lead III with
T wave inversion
Right bundle branch
block in leads V1–V4
T wave inversion
in leads V1–V4
V1 V2 V3 V4
Figure 11-4
ECG changes seen with pulmonary embolism.
sha19766_cp11.indd 148
sha19766_cp11.indd 148 7/24/06 2:39:39 PM
7/24/06 2:39:39 PM
156. Chapter 11 Other Cardiac Conditions 149
Pacemakers
• A pacemaker is an artificial device
that produces an impulse from a
power source and conveys it to the
myocardium.
• It provides an electrical stimulus
for hearts whose intrinsic ability to
generate an impulse or whose abil-
ity to conduct electrical current is
impaired.
• The power source is generally
positioned subcutaneously, and the
electrodes are threaded to the right
atrium and right ventricle through
veins that drain to the heart.
• The impulse flows throughout the
heart causing the muscle to depolar-
ize and initiate a contraction.
Figure 11-5
Pacemakers are used to provide electrical stimuli for hearts with an
impaired ability to conduct an electrical impulse.
Impulses initiated
by the SA node do
not reach the ventricles
BLOCKED
Pacemaker initiates
impulses that stimulate
the ventricles to contract
Pacemaker
spike
Pacemaker
sha19766_cp11.indd 149
sha19766_cp11.indd 149 7/24/06 2:39:39 PM
7/24/06 2:39:39 PM