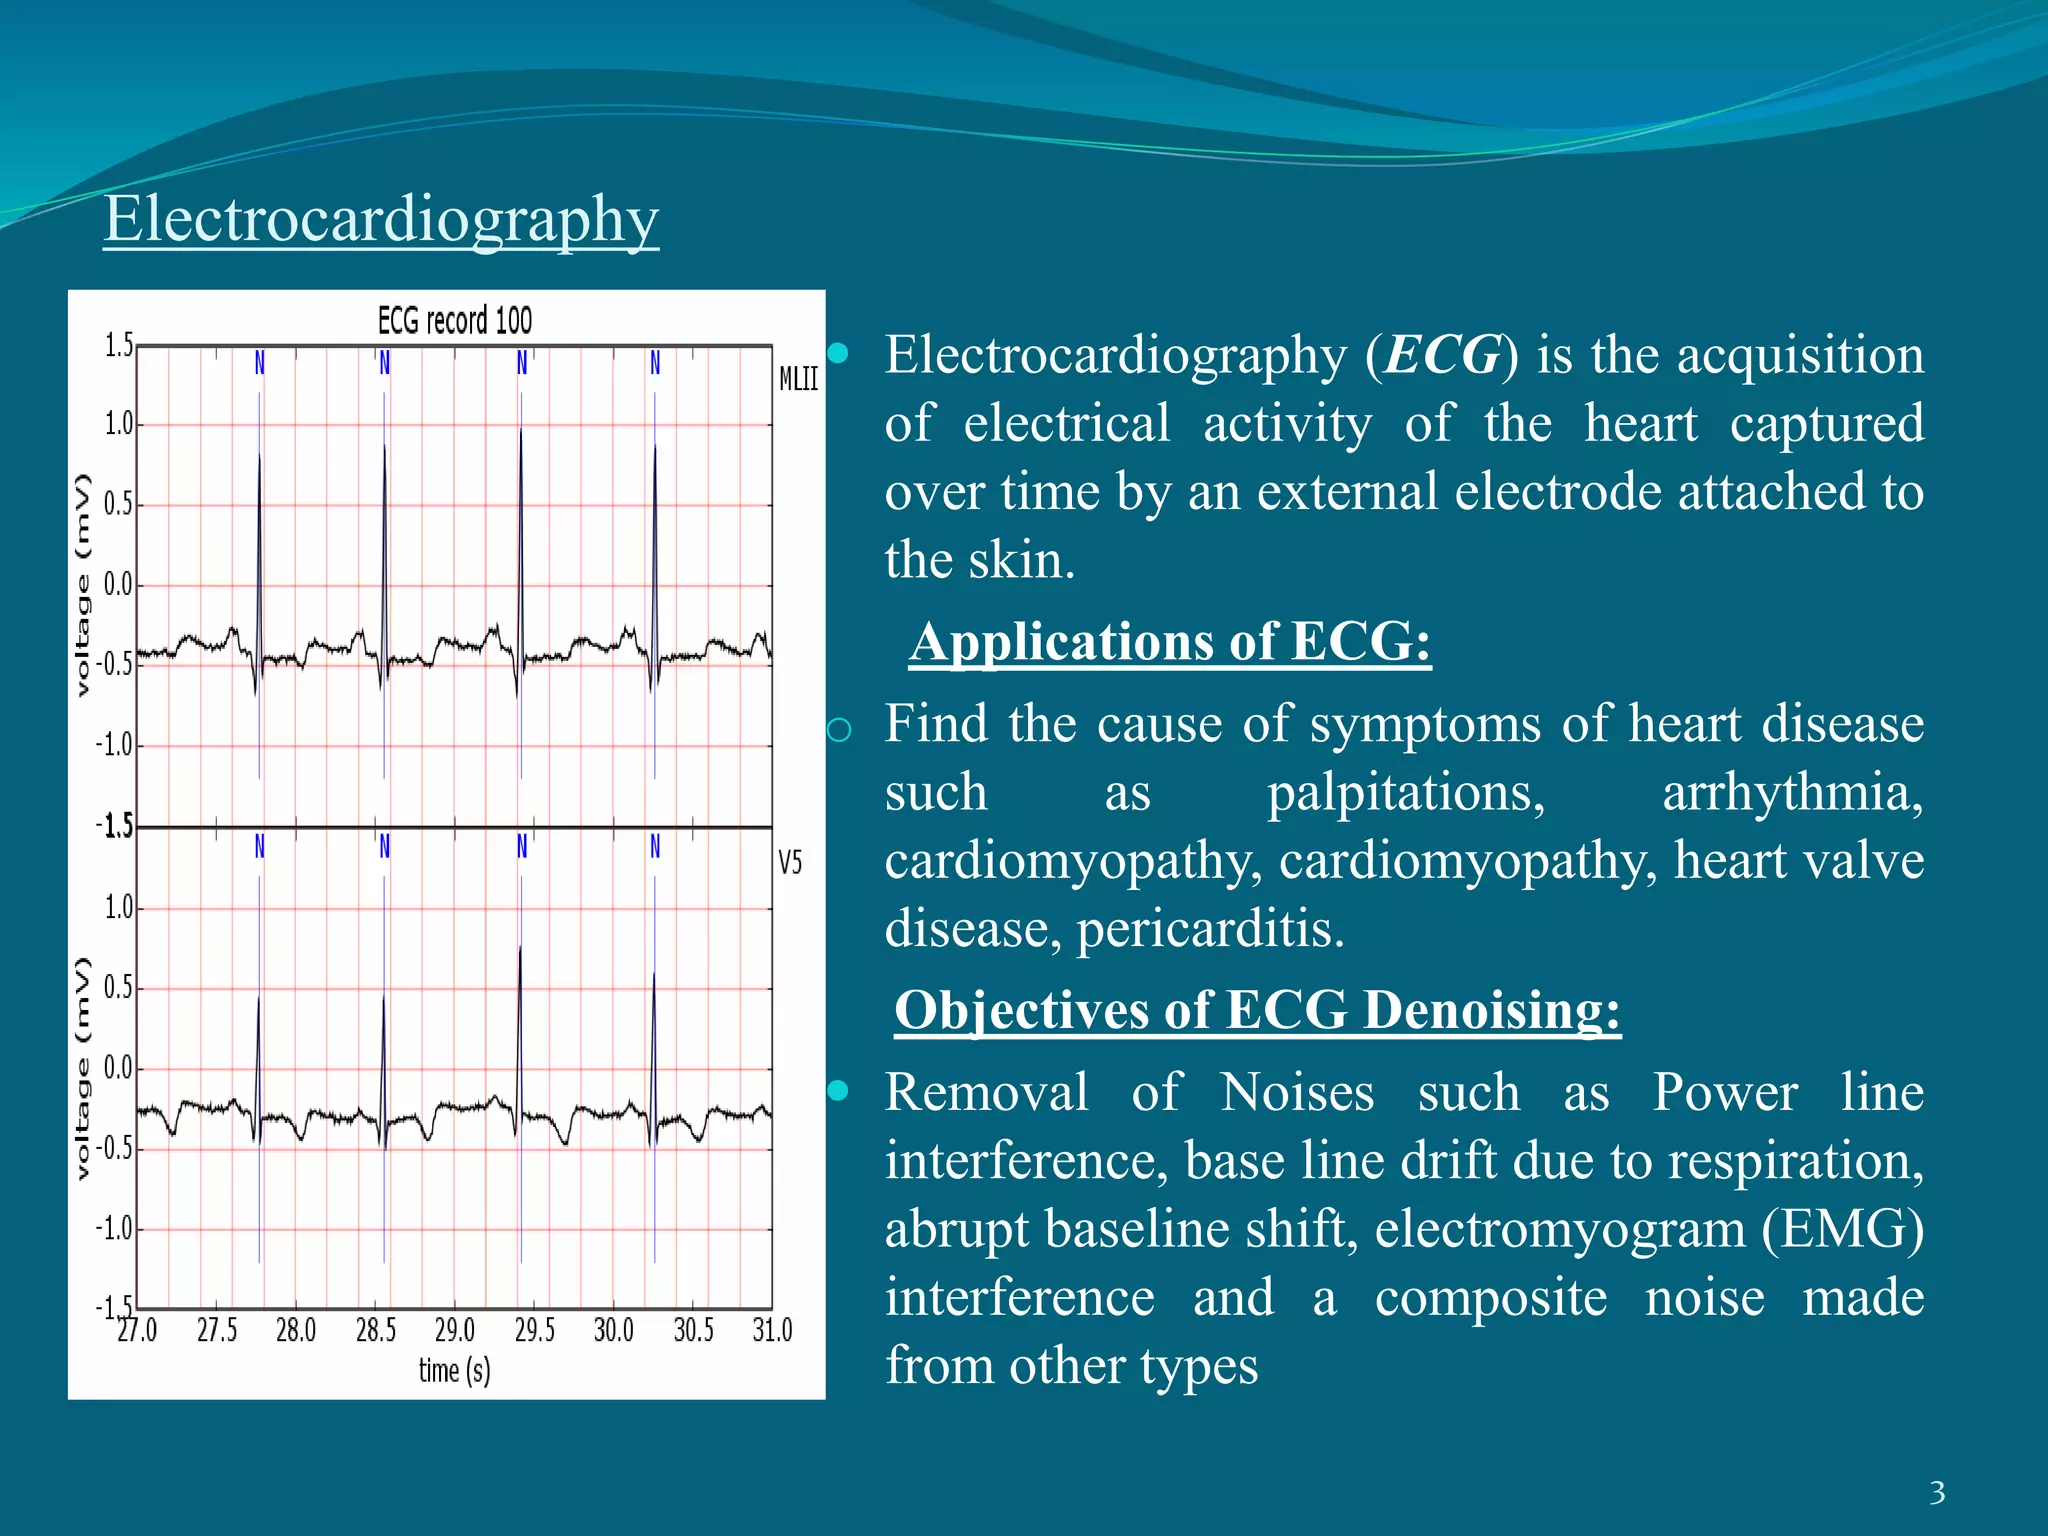
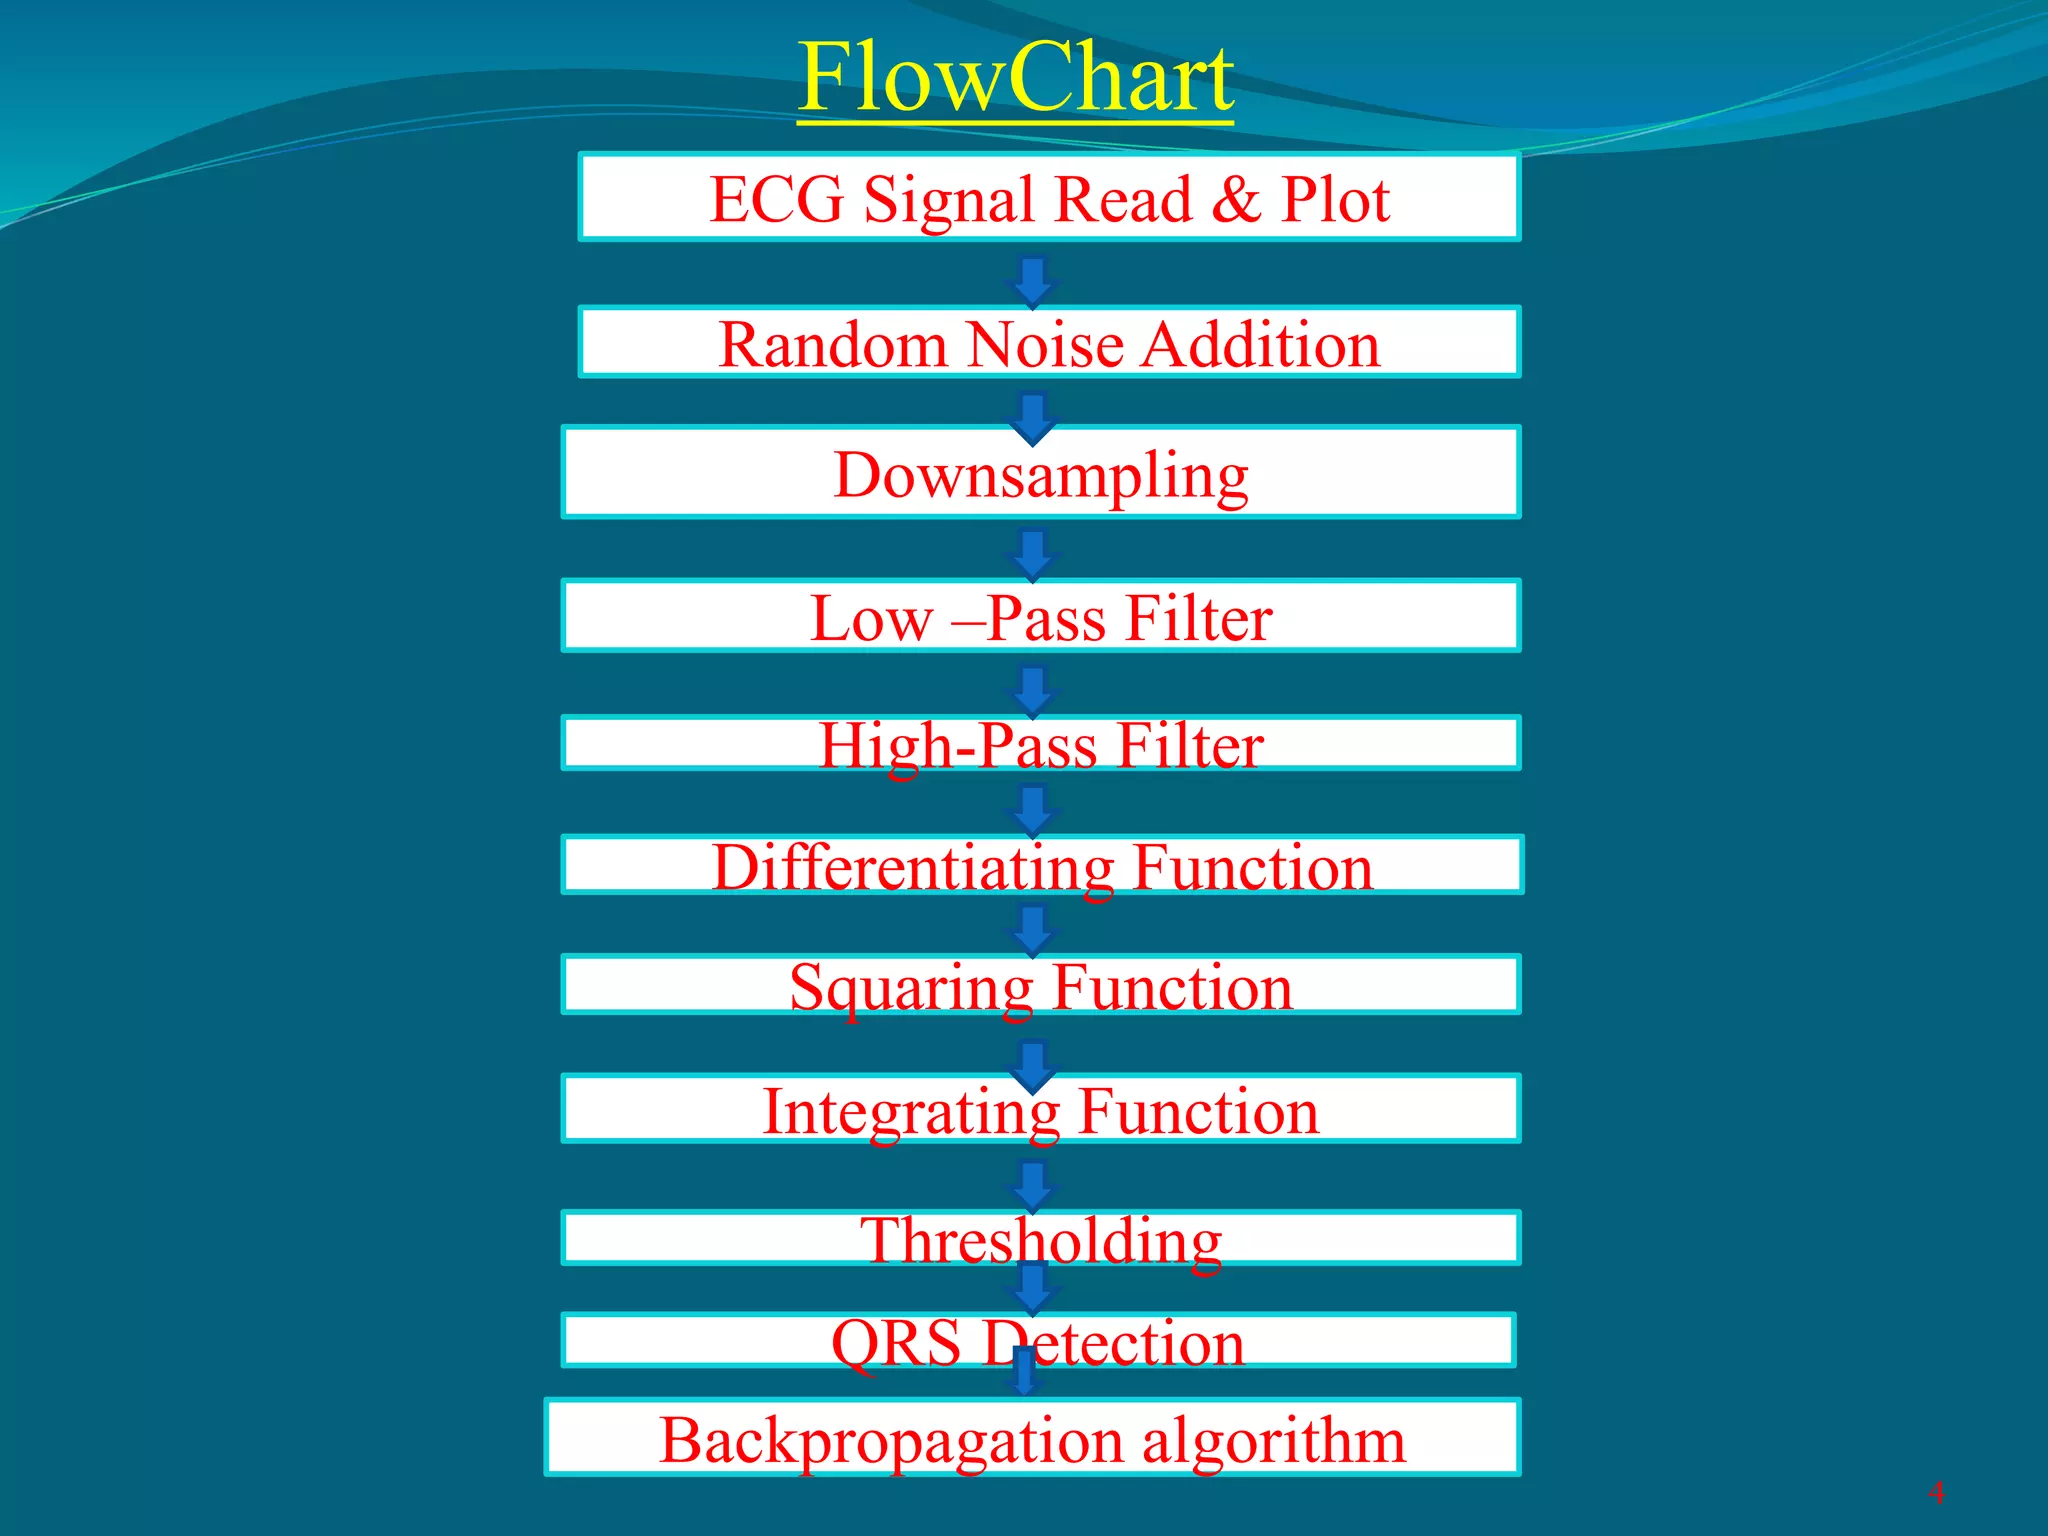
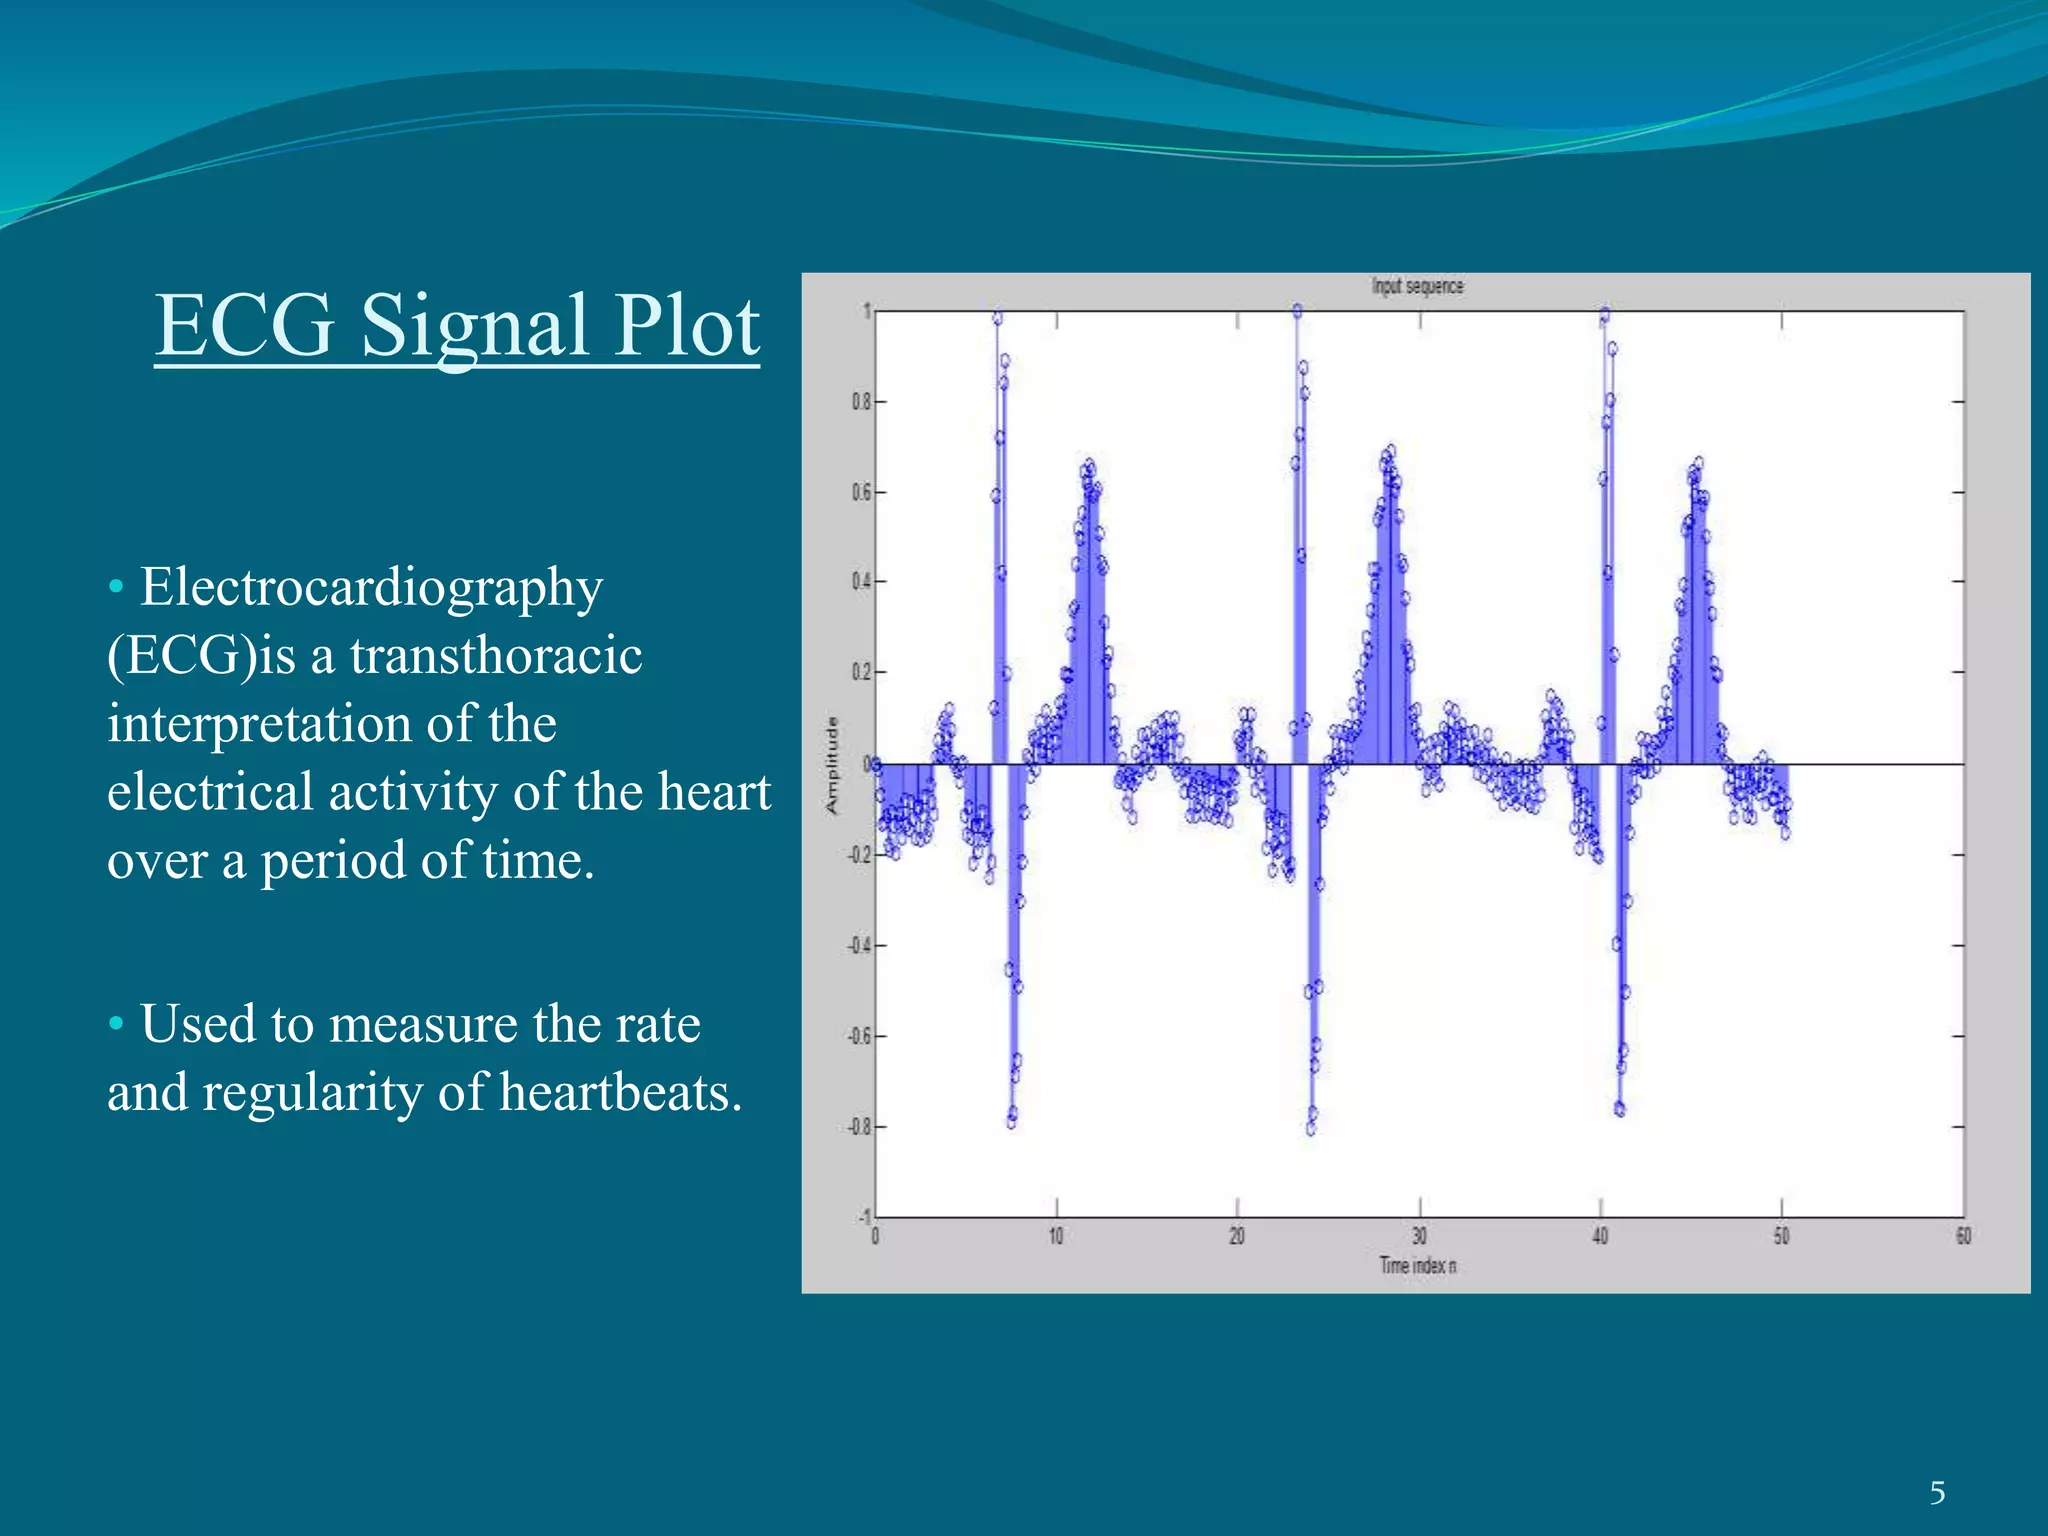
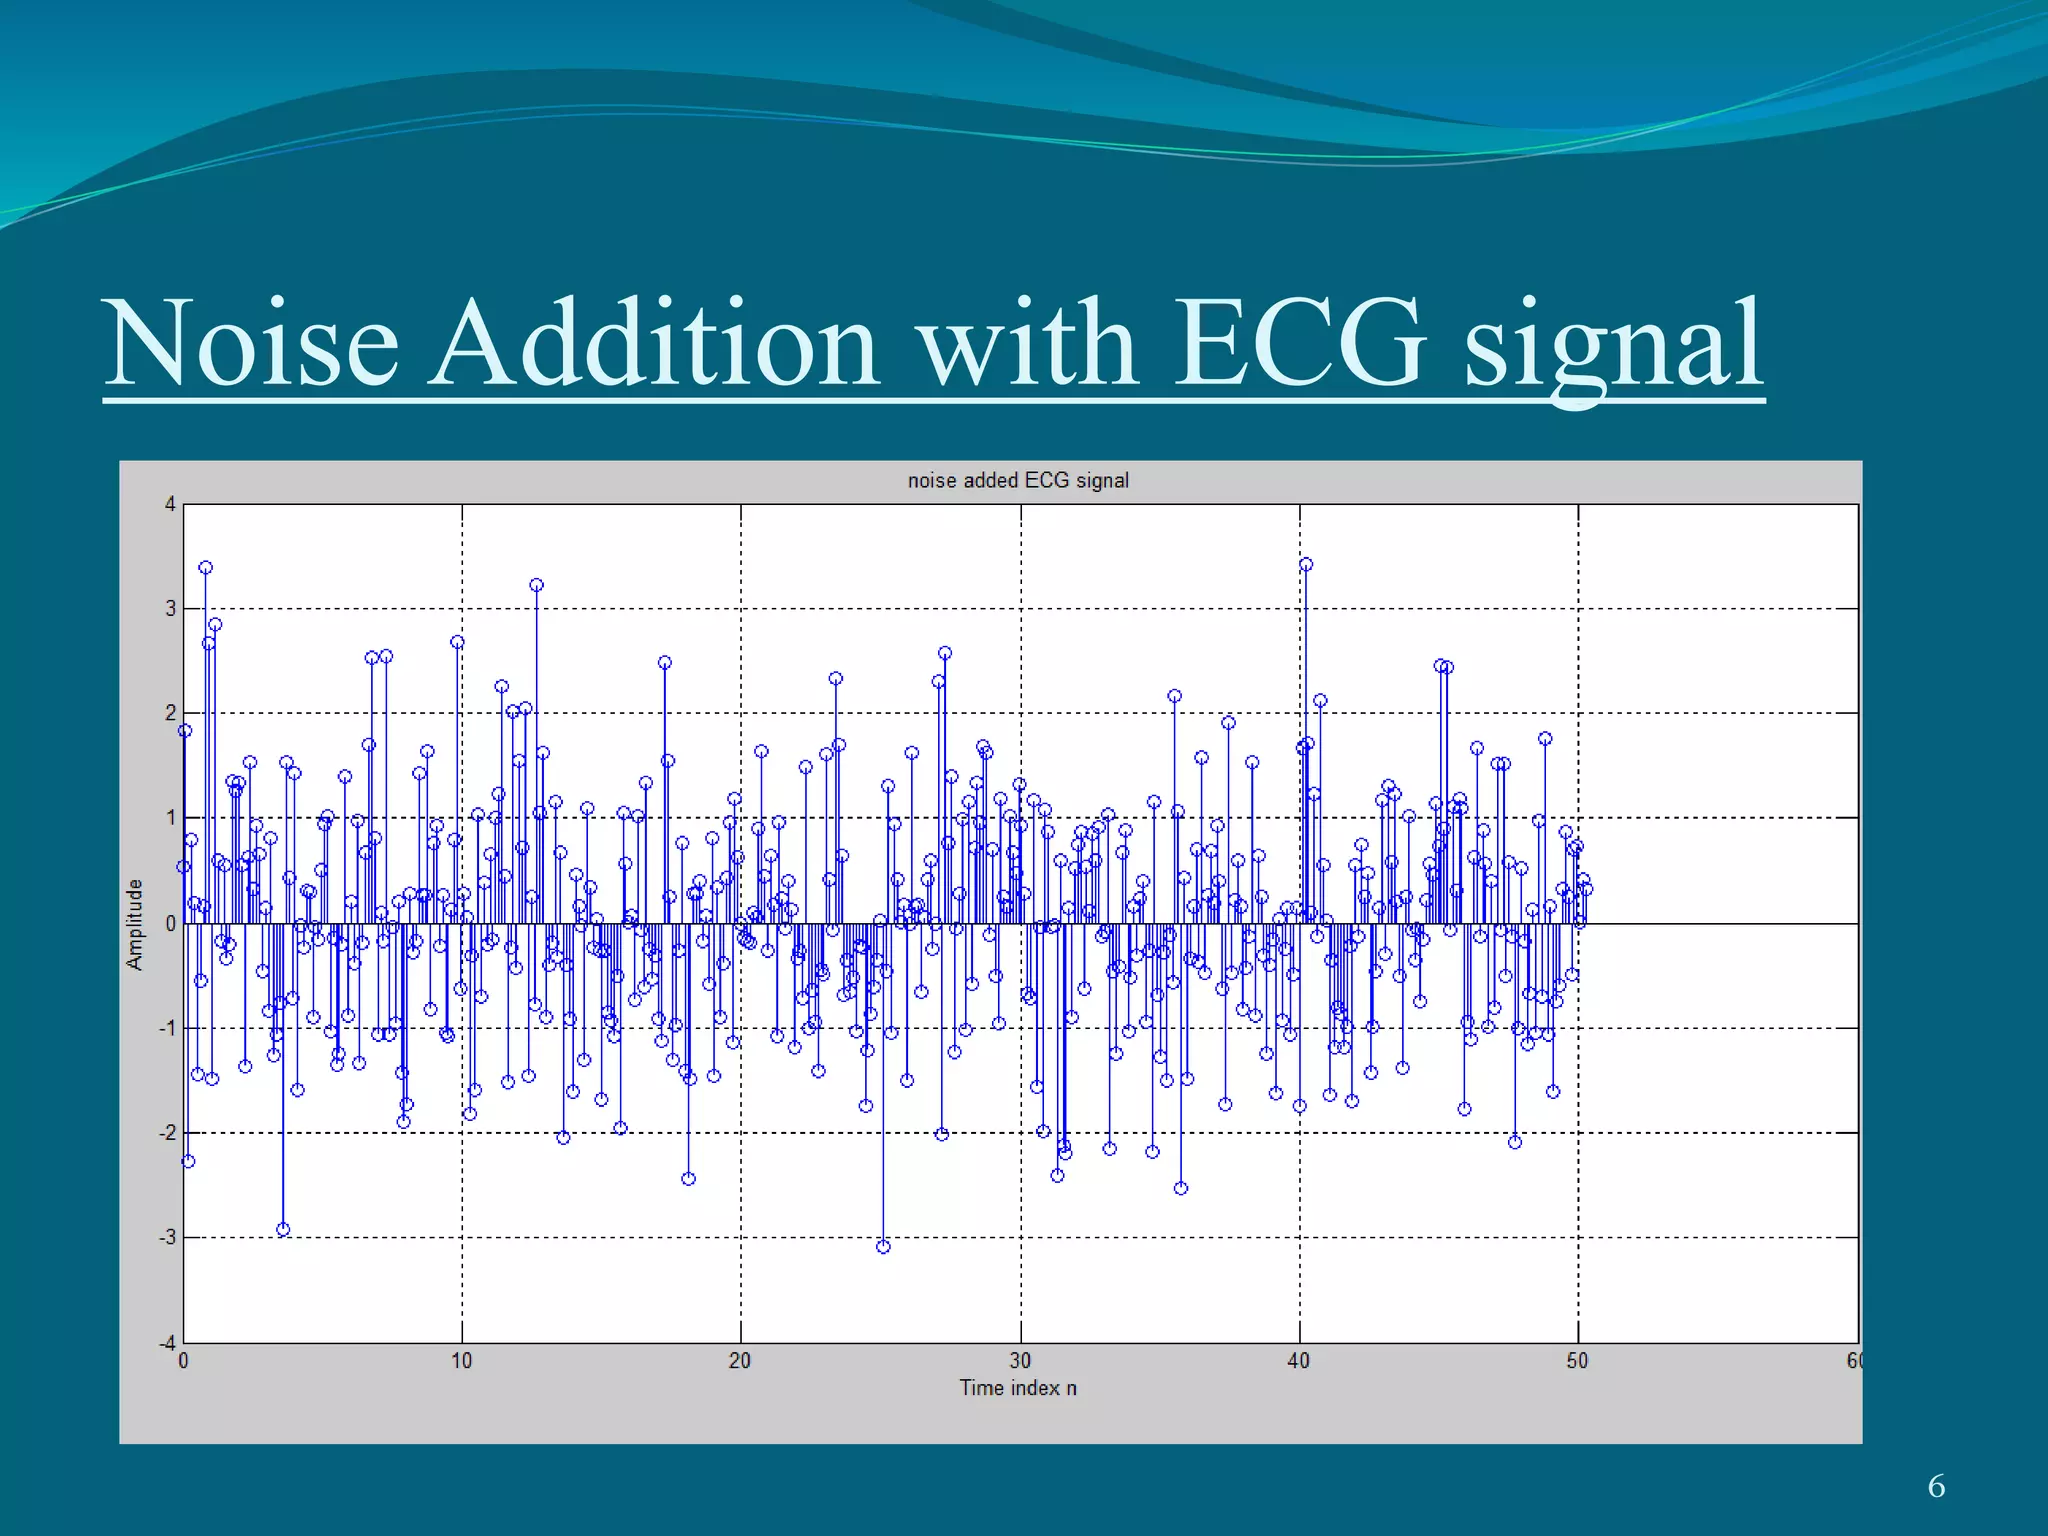
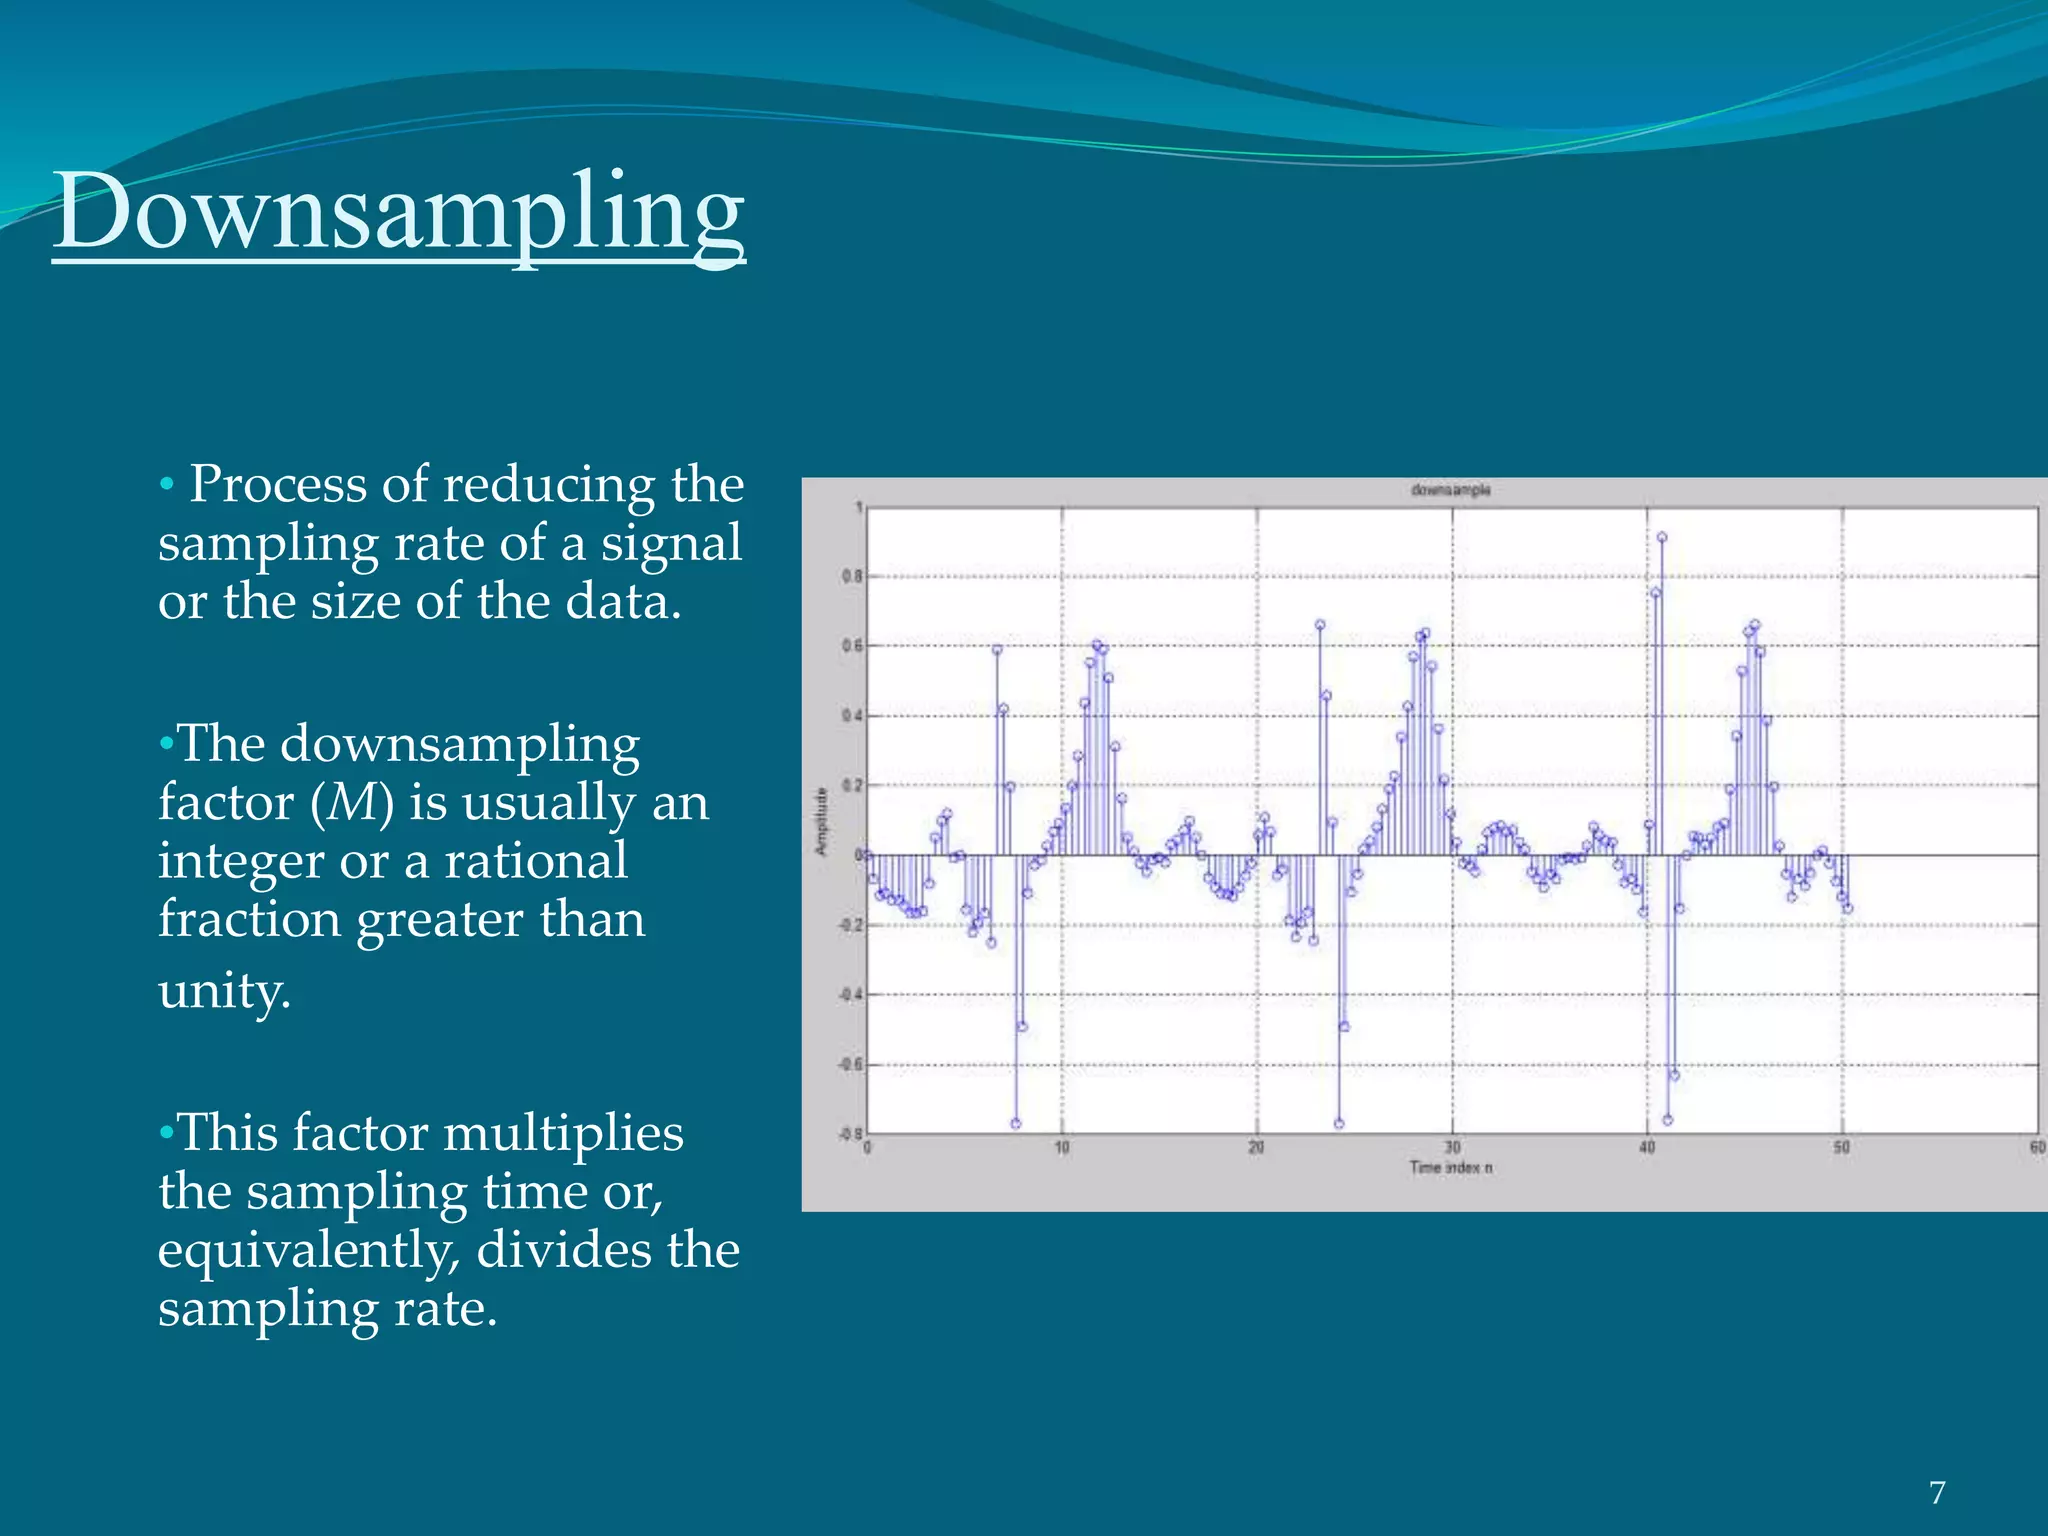
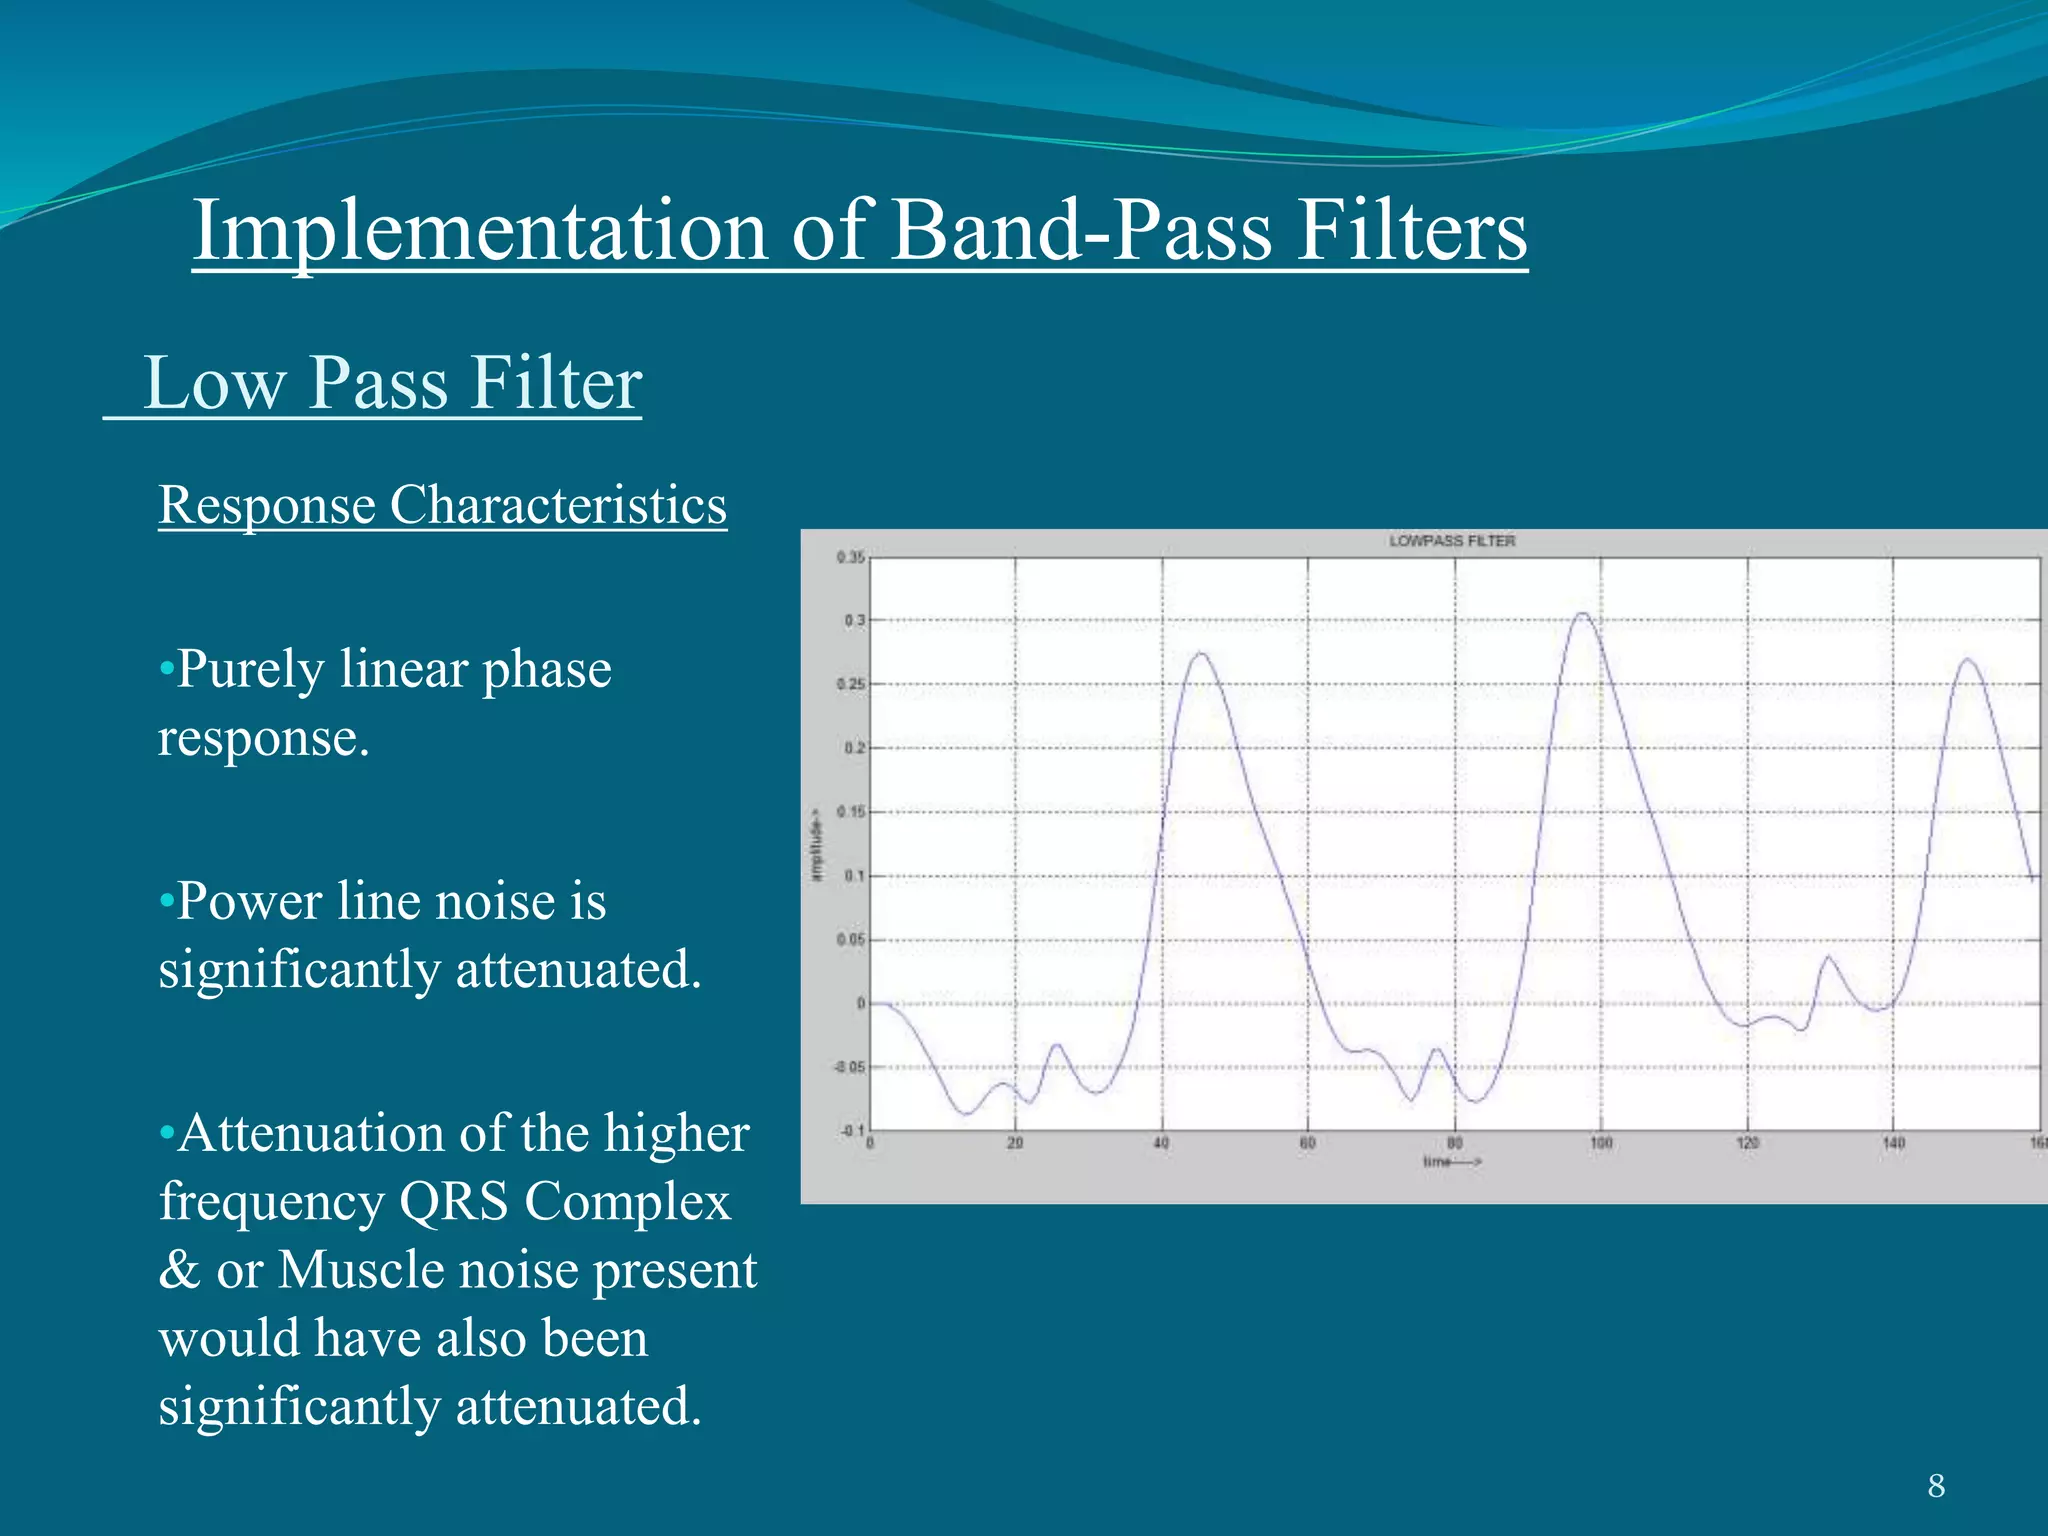
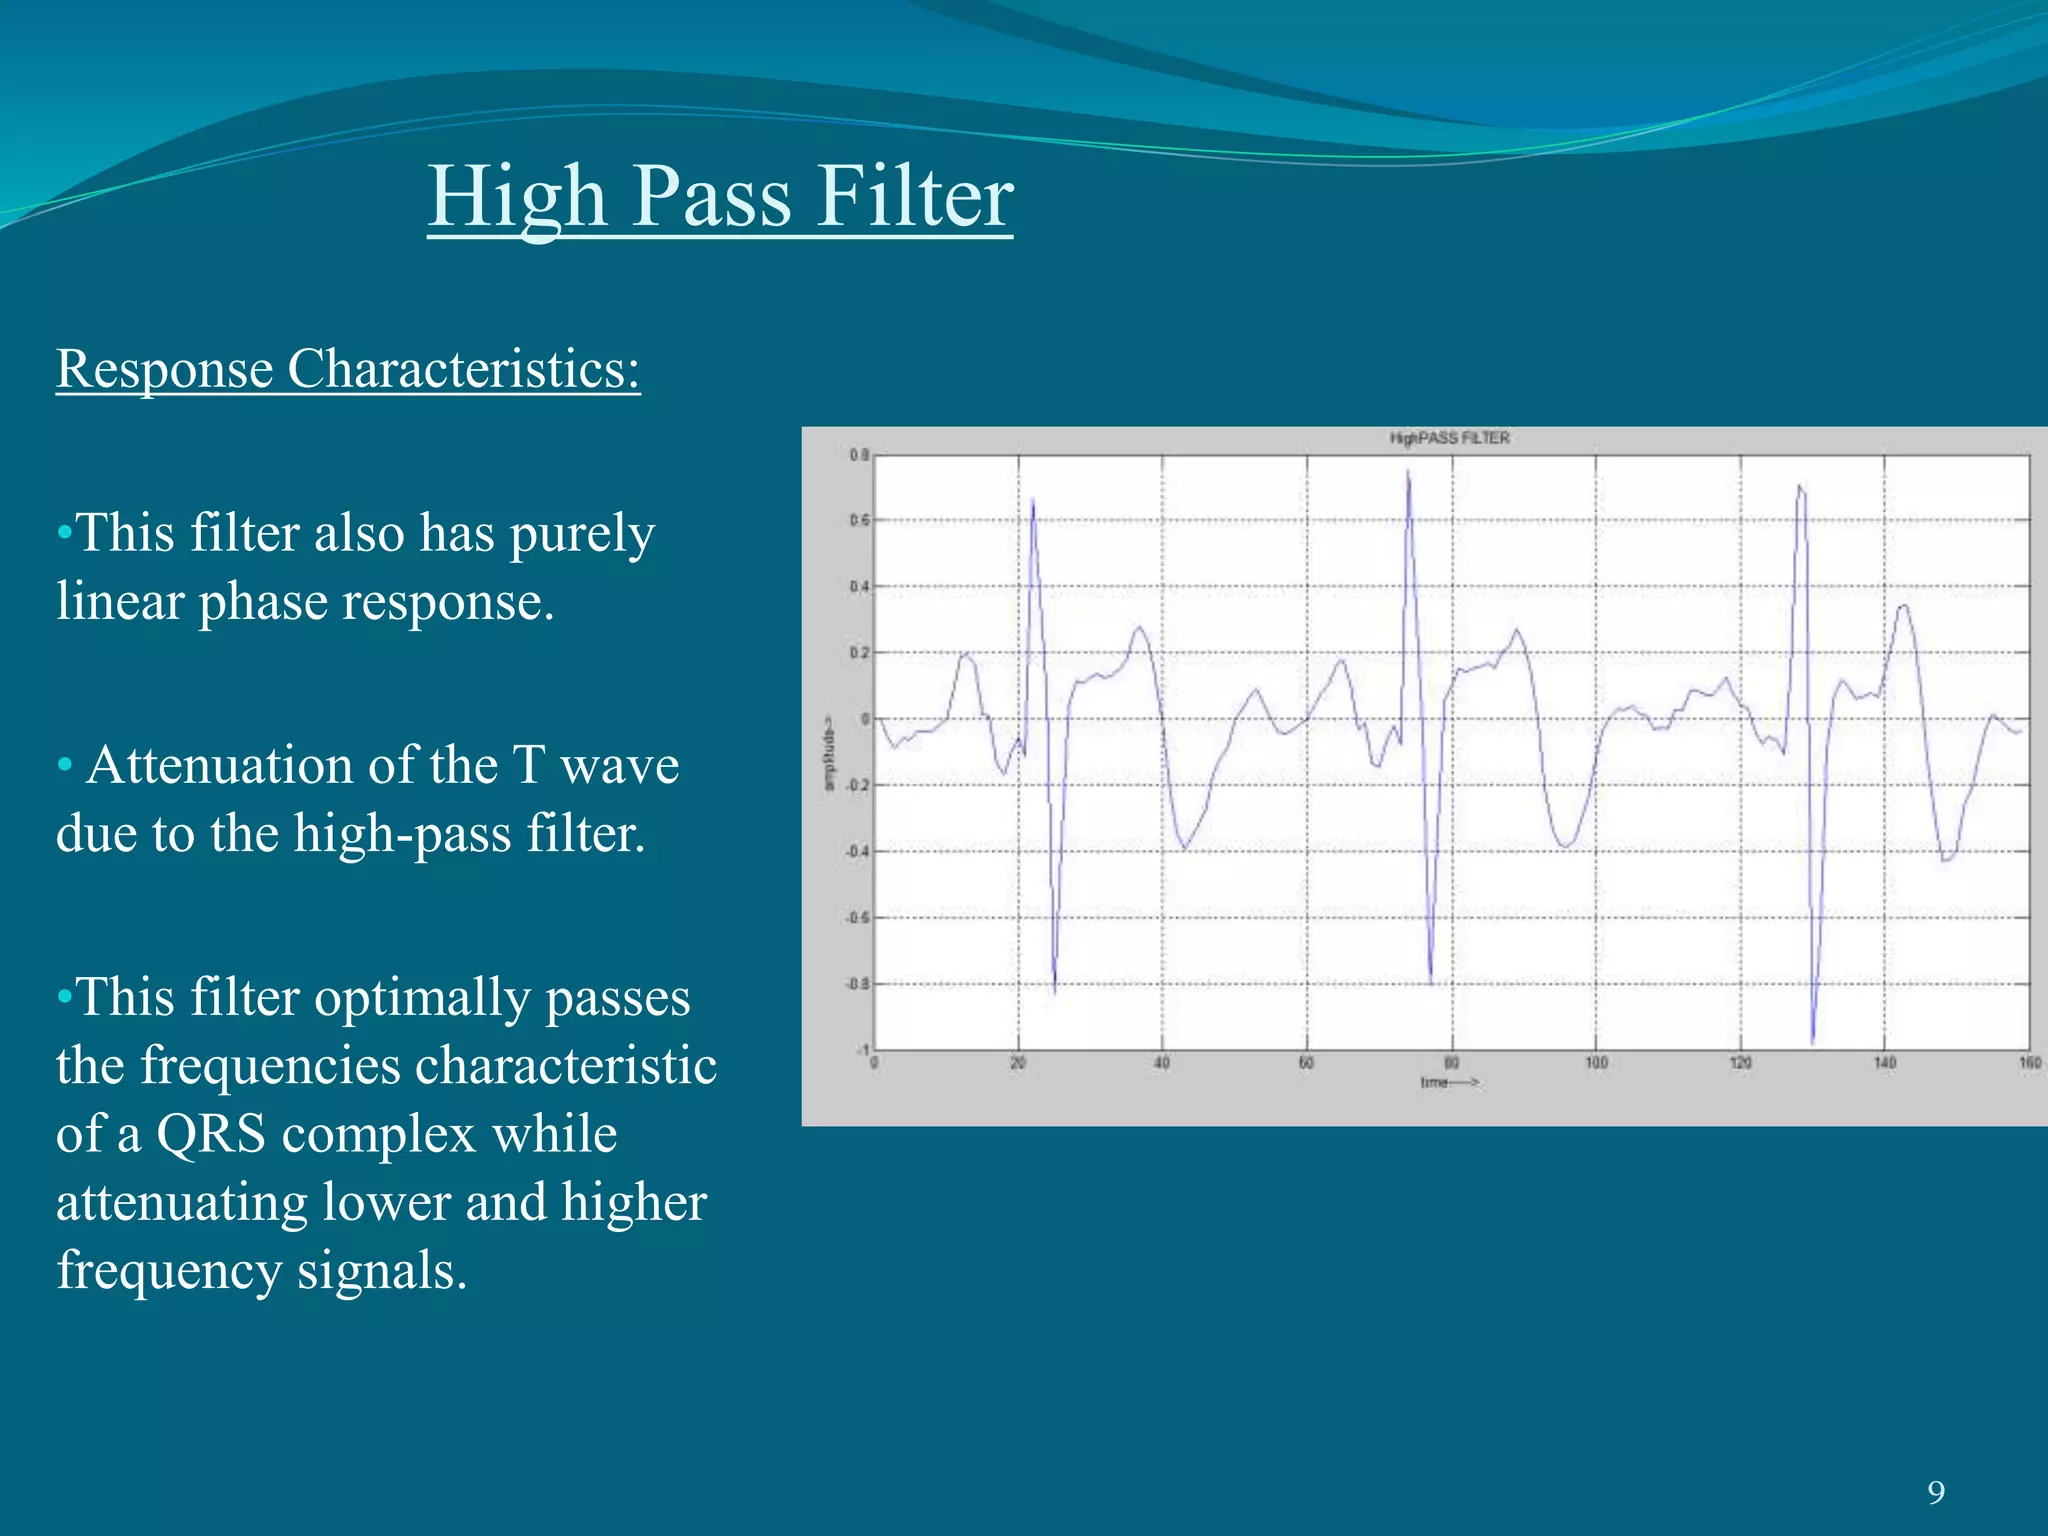
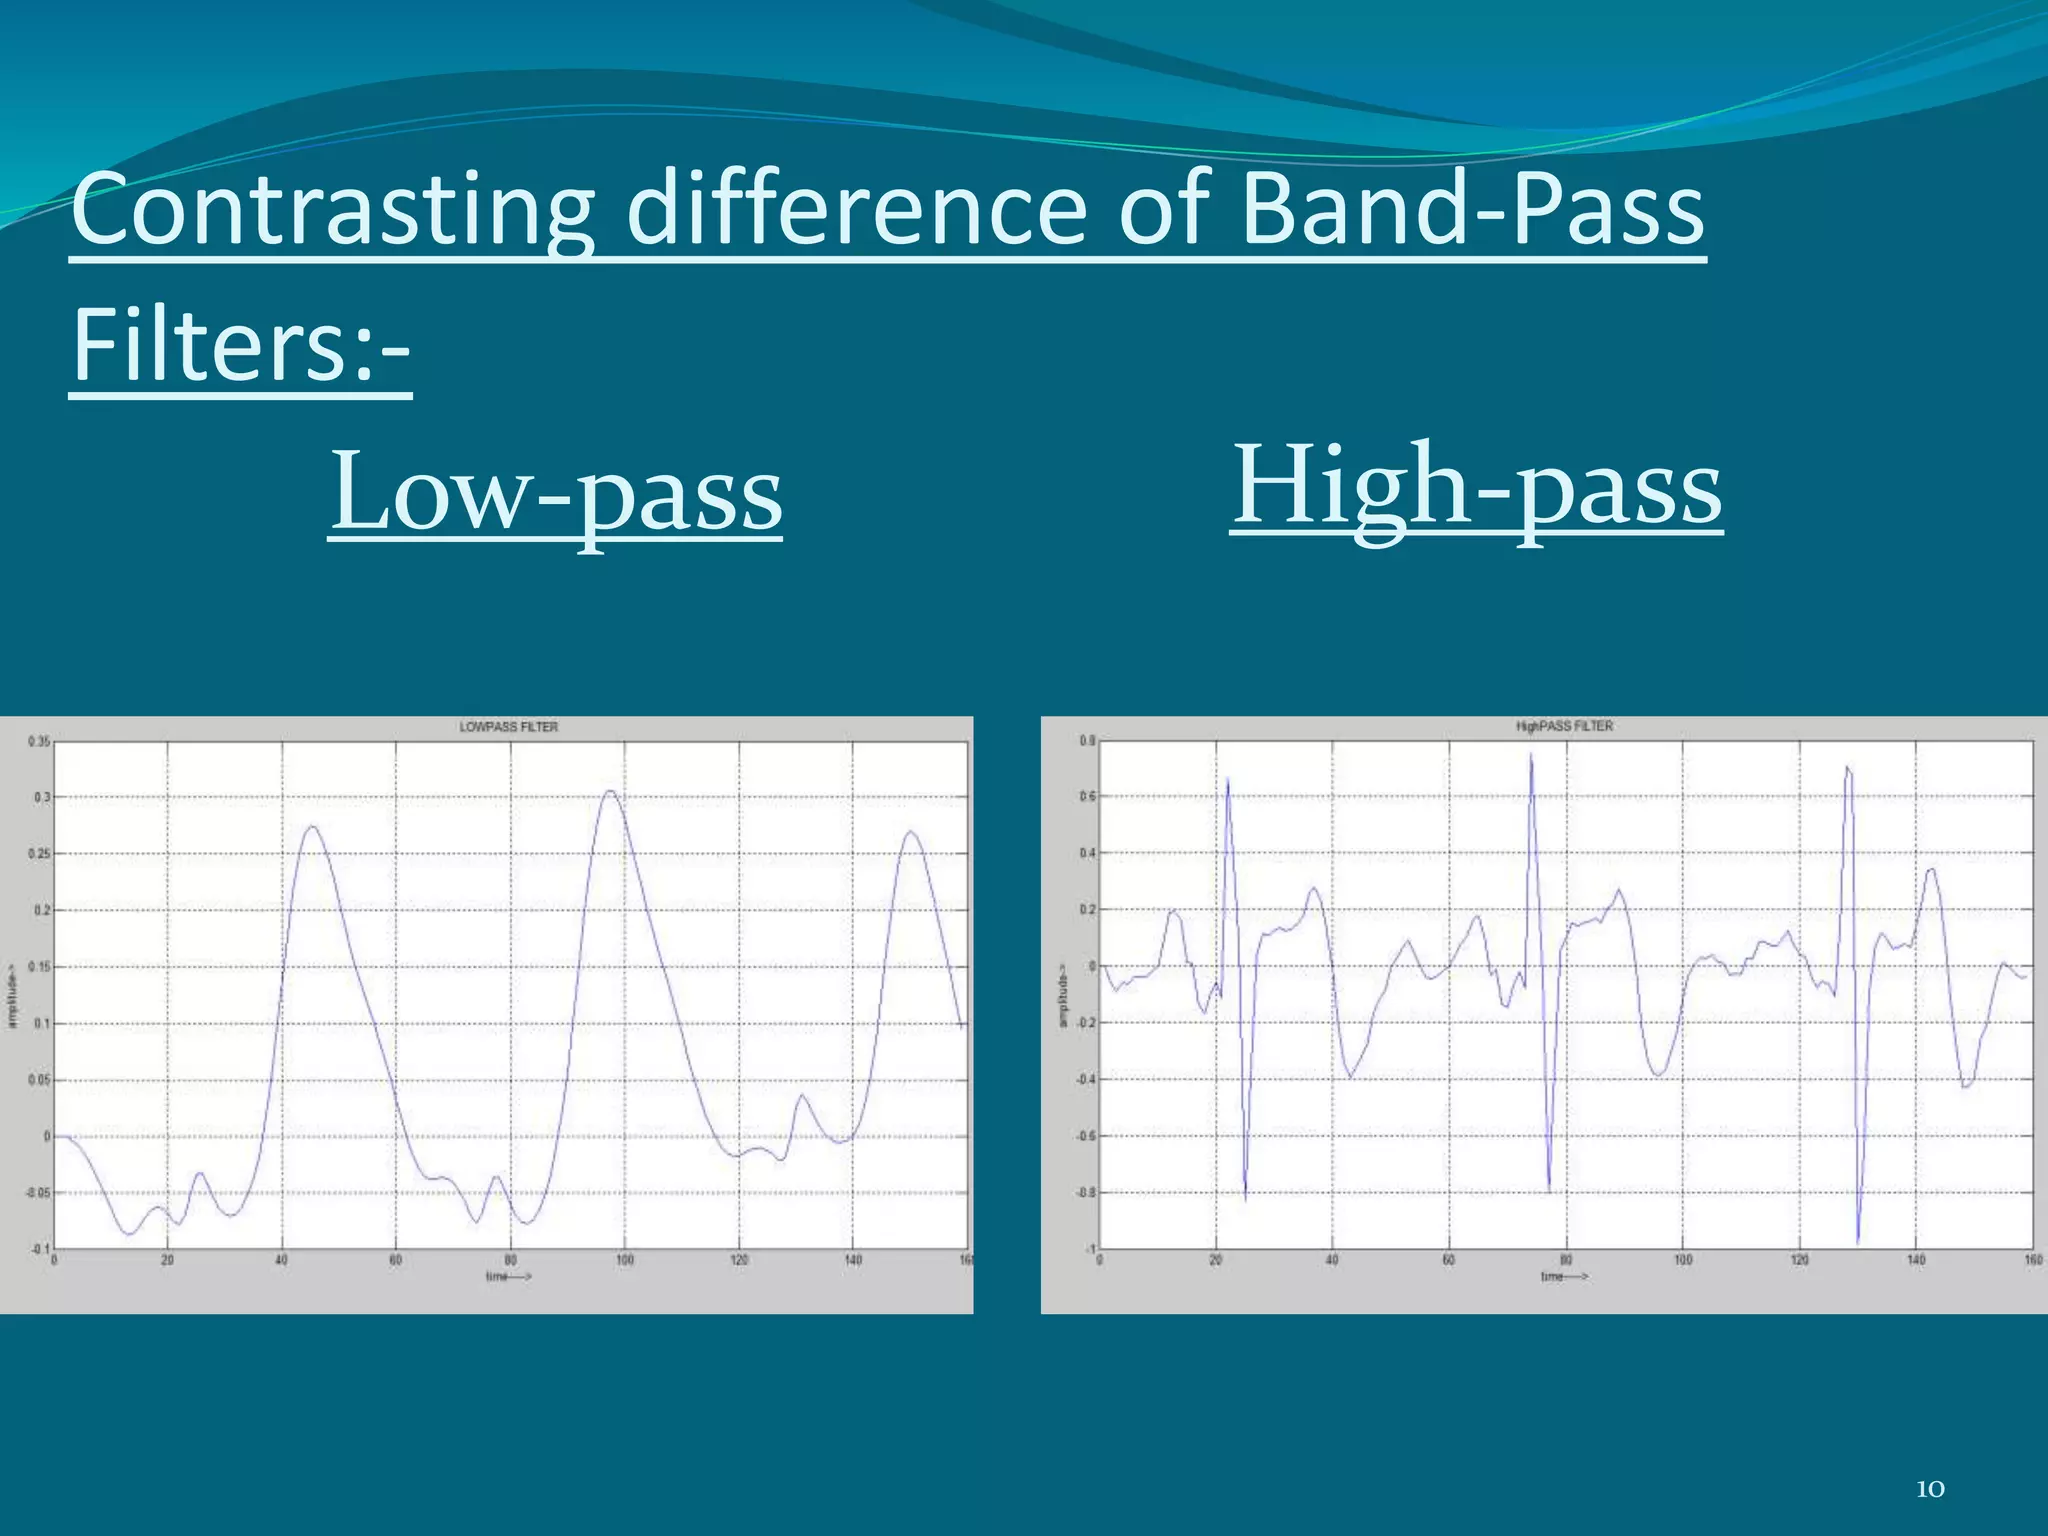
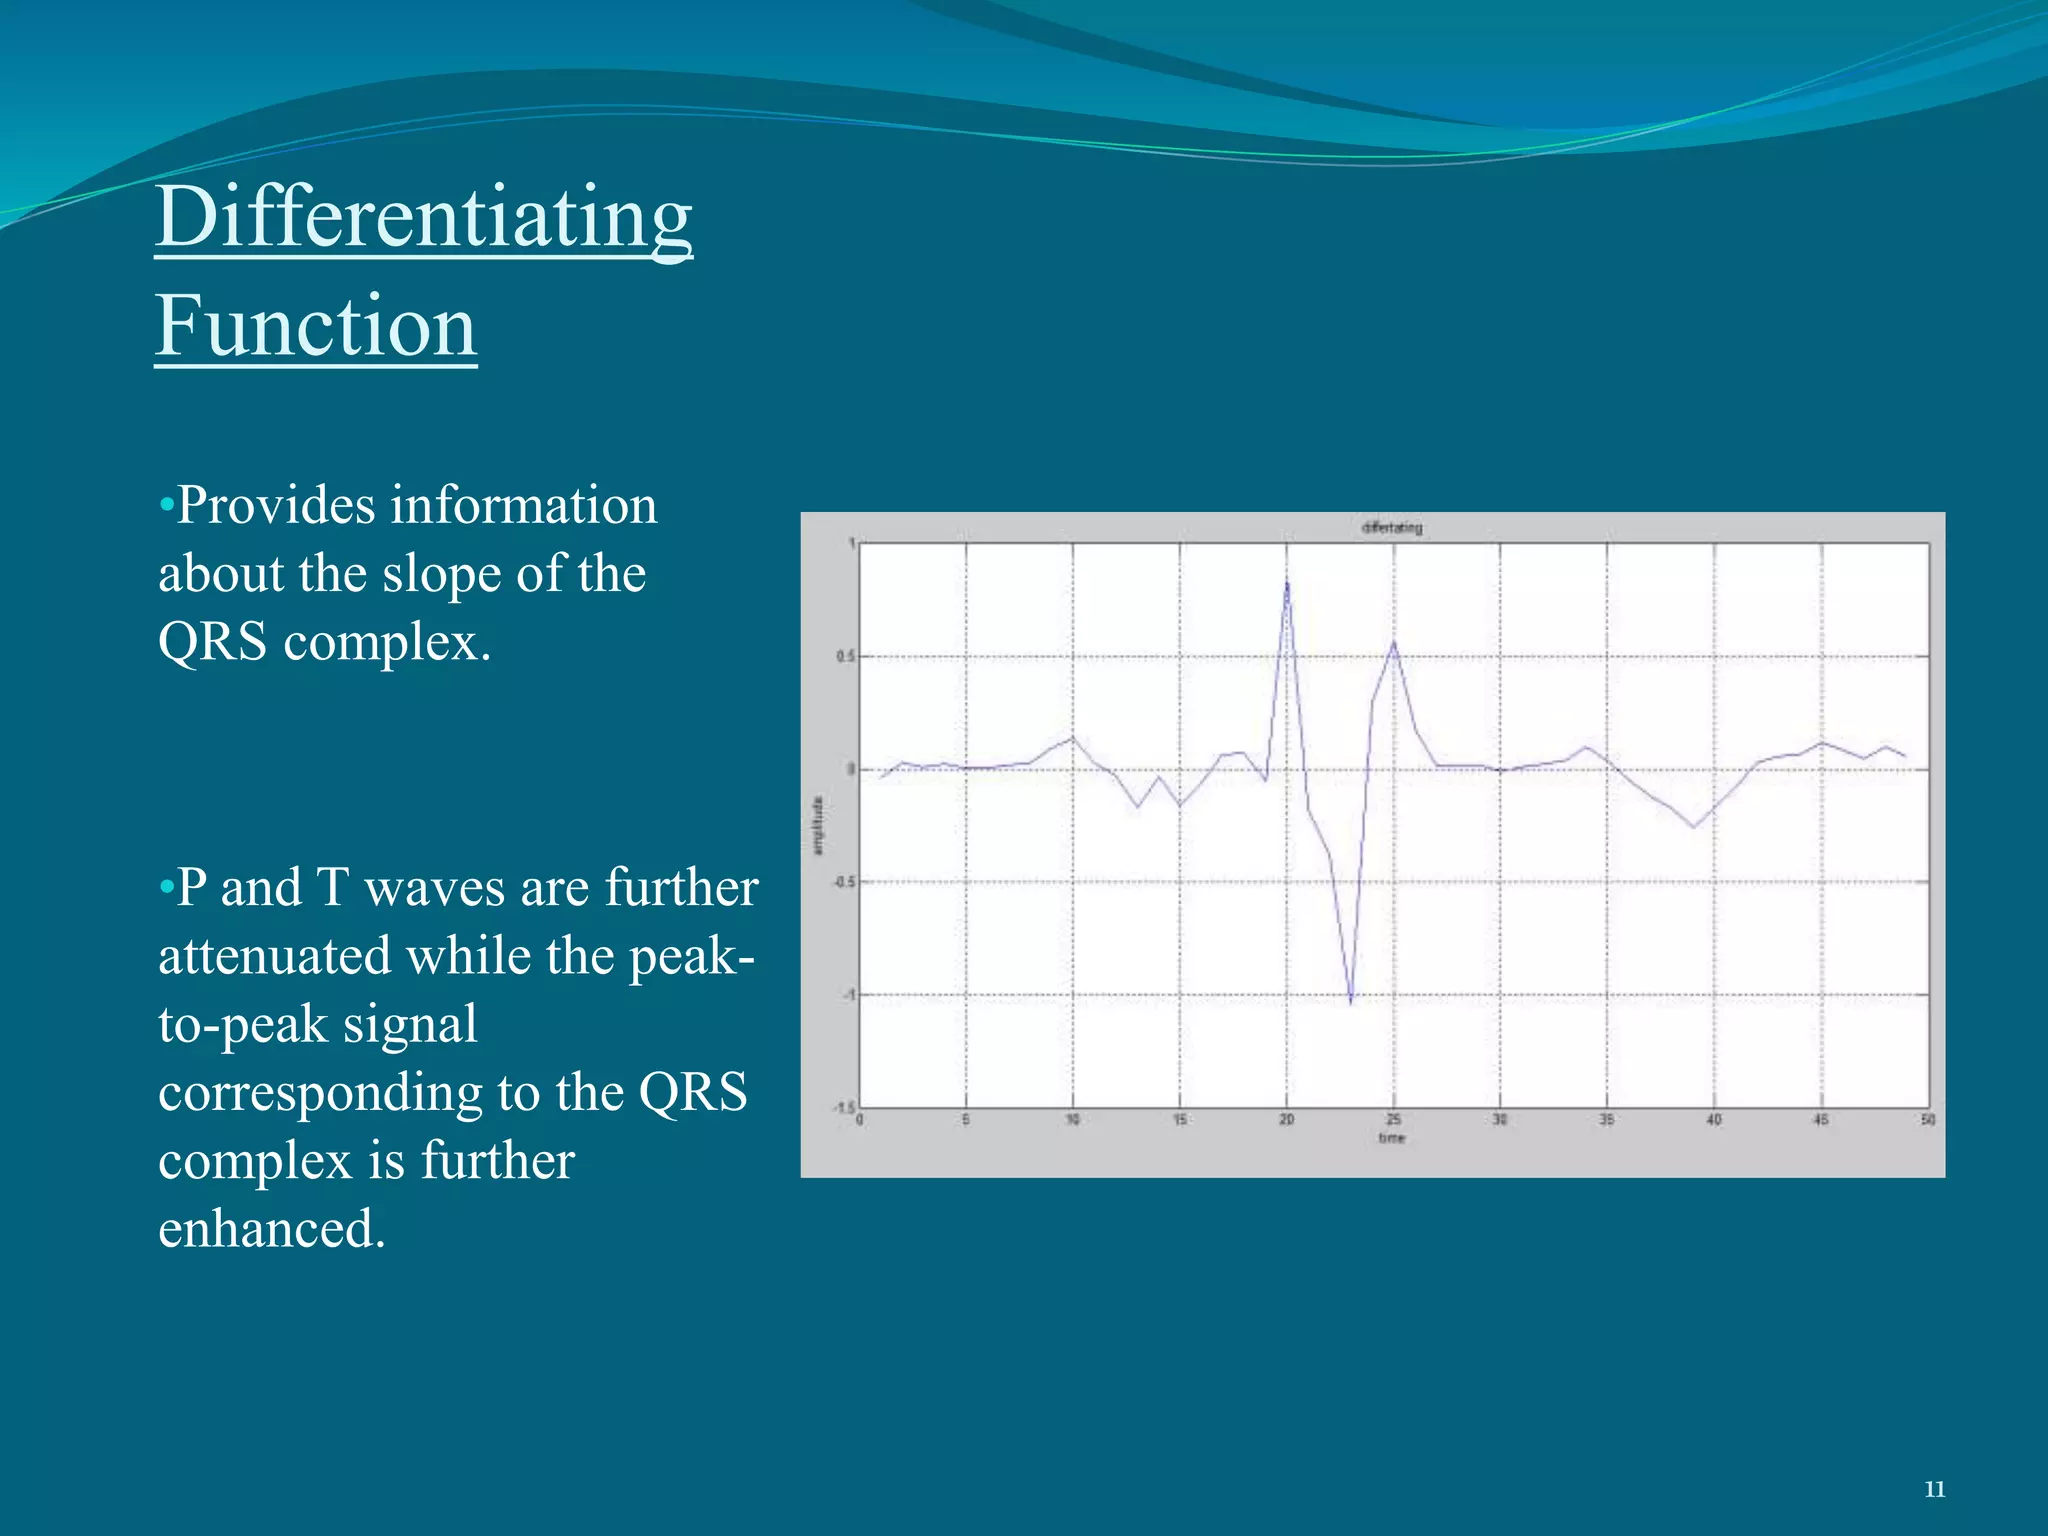
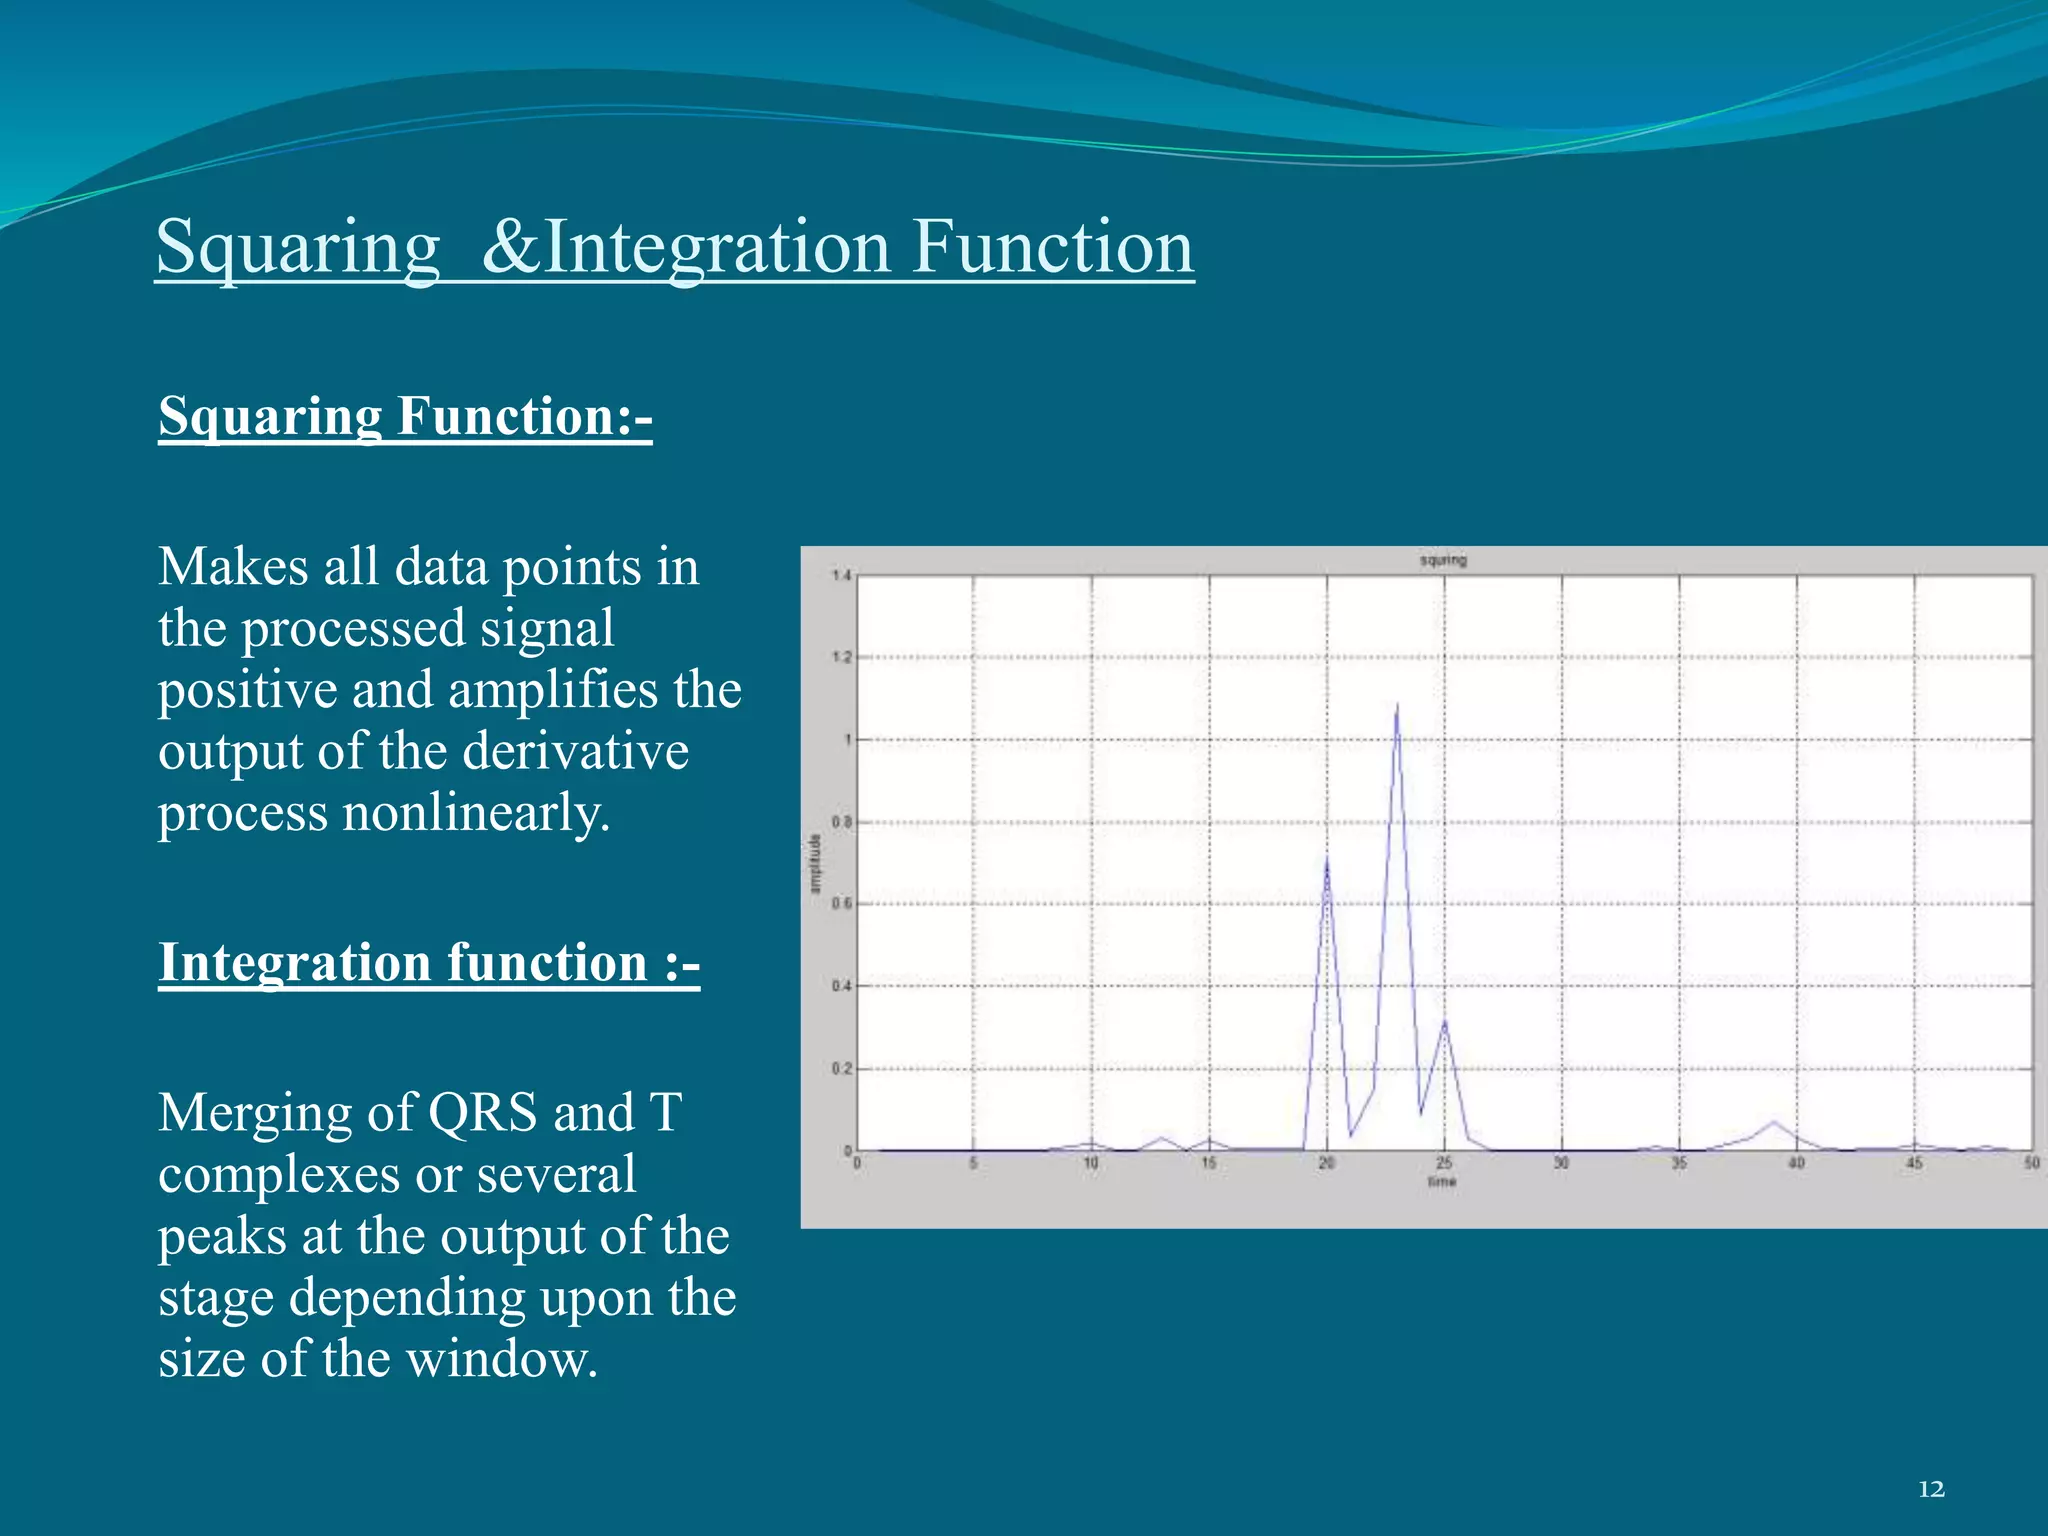
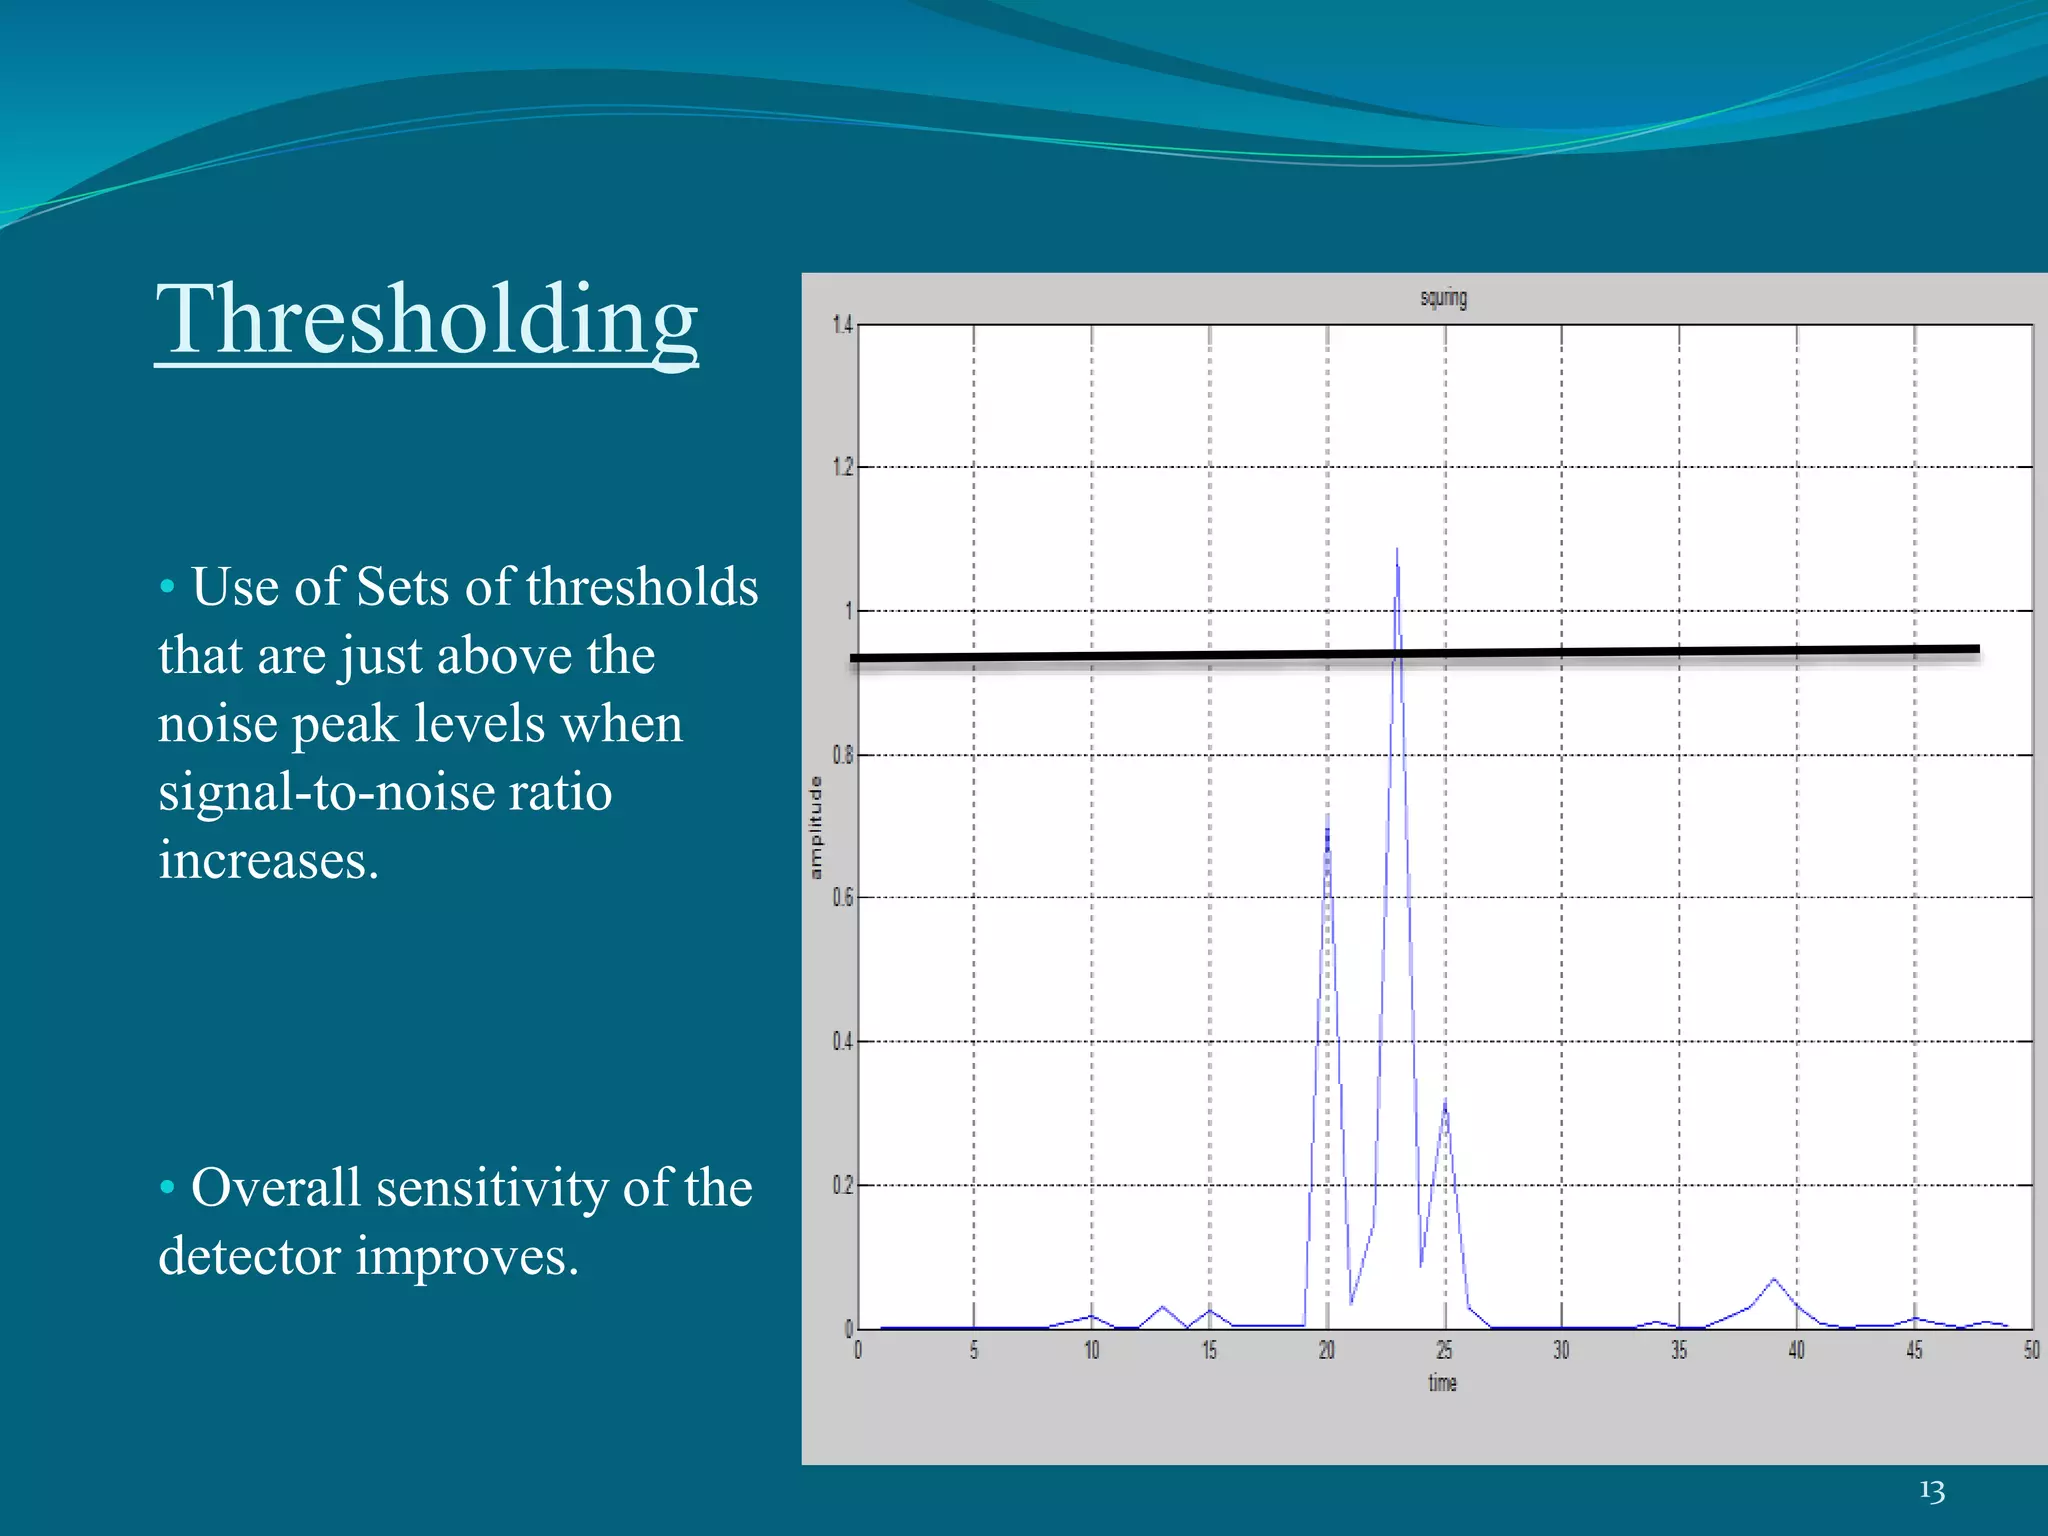
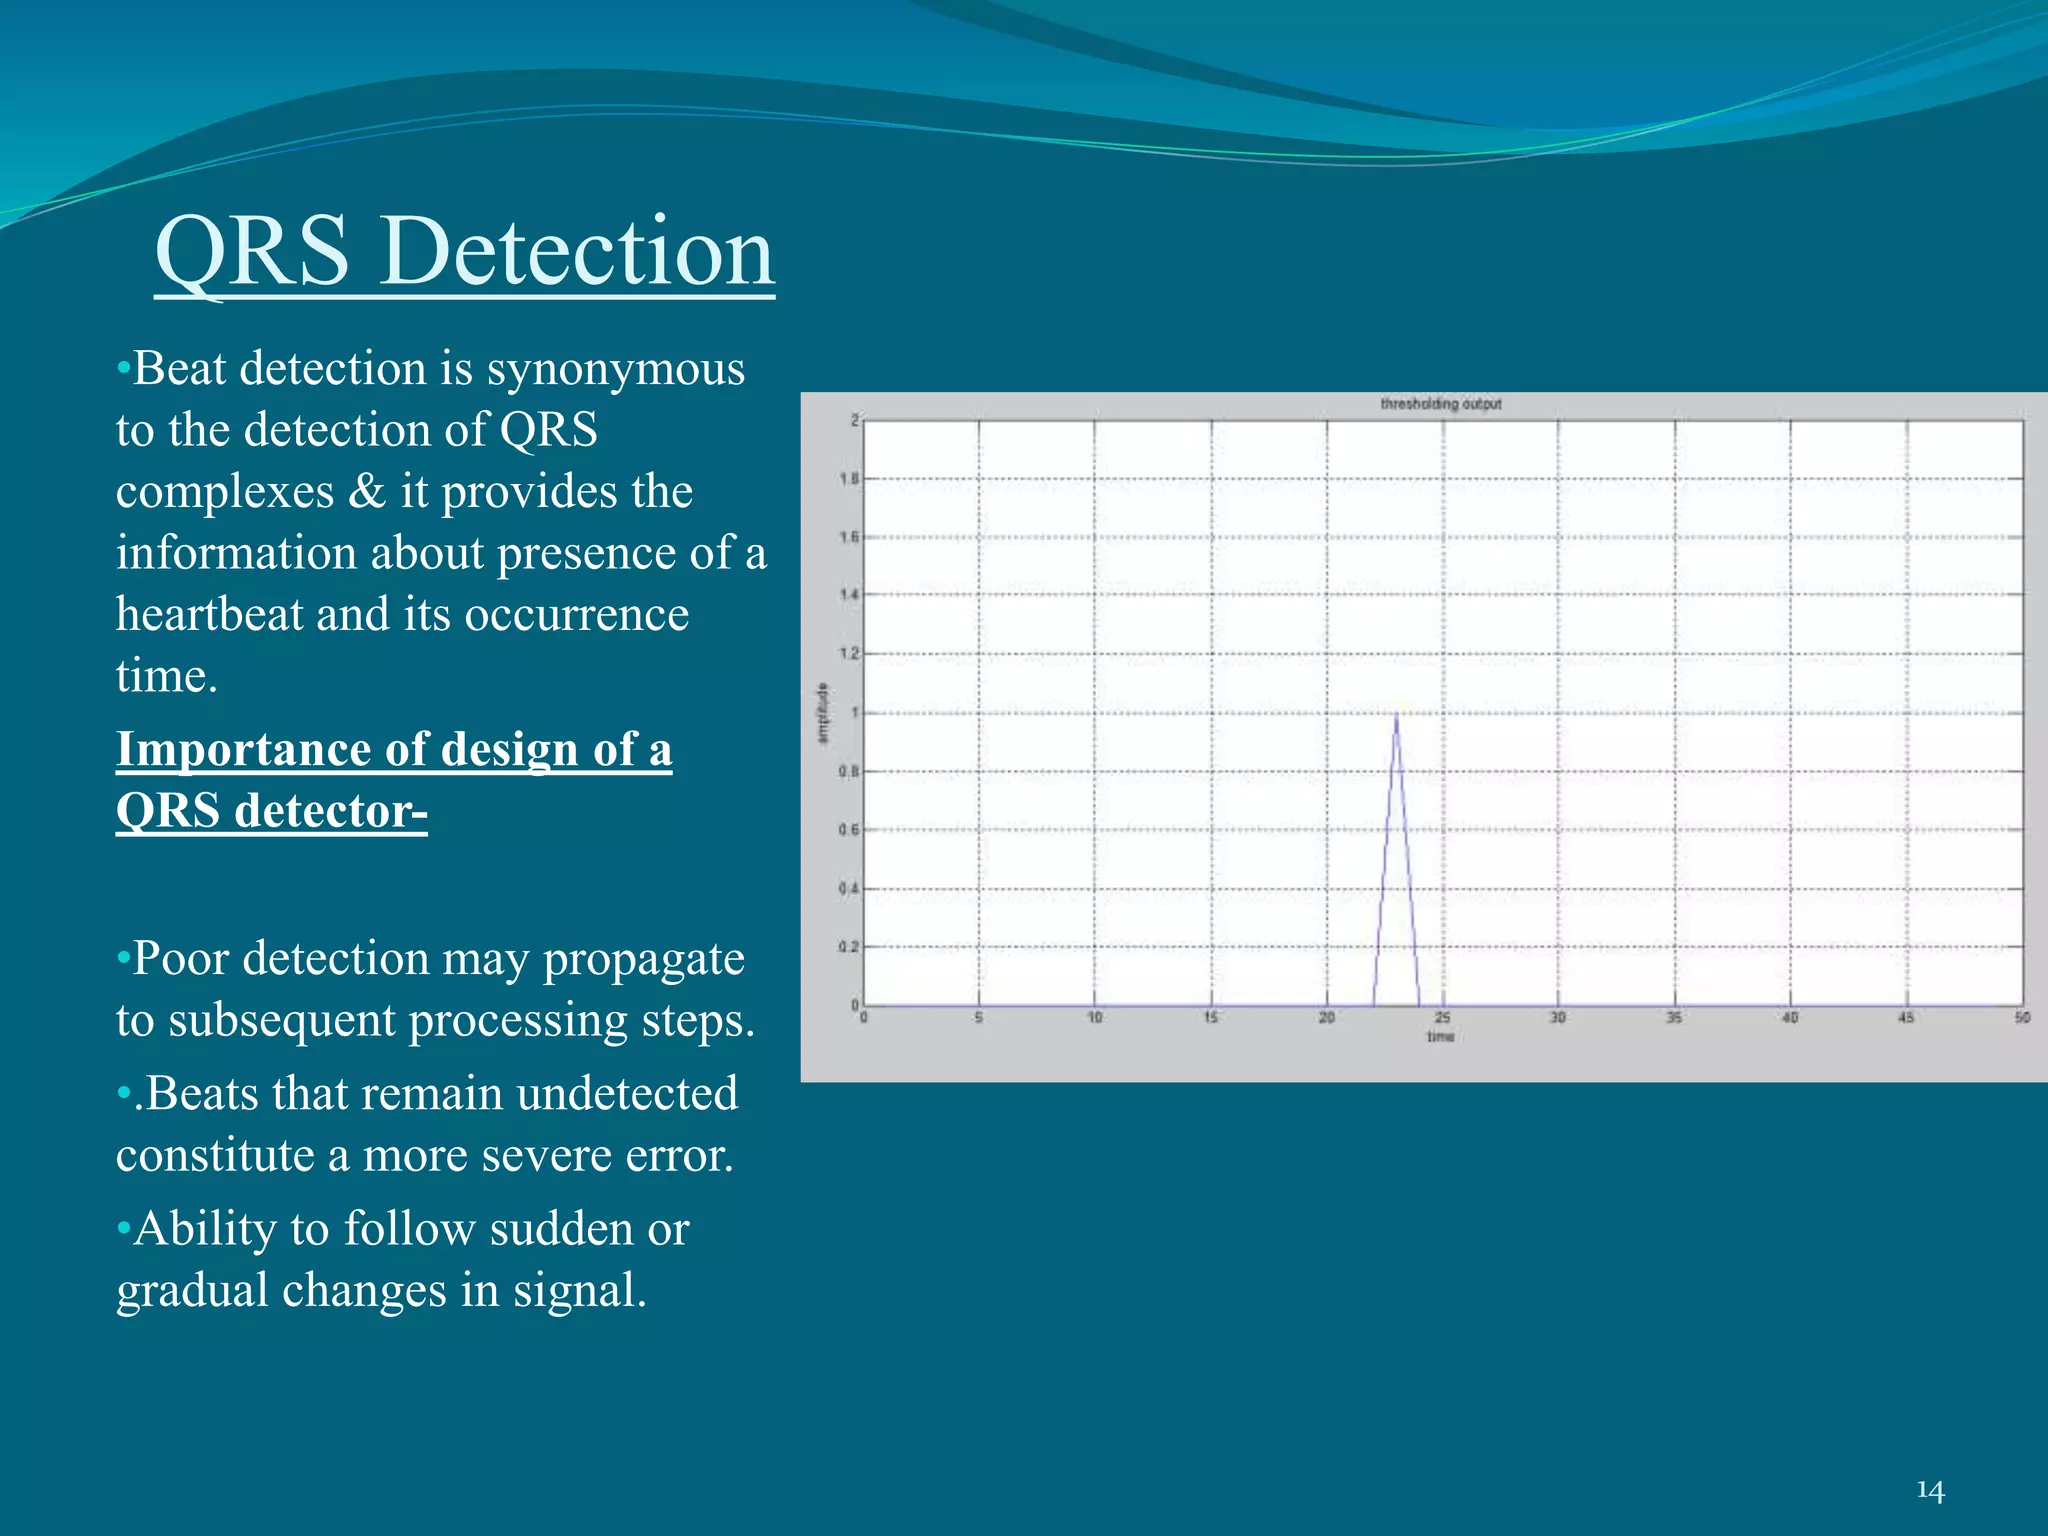
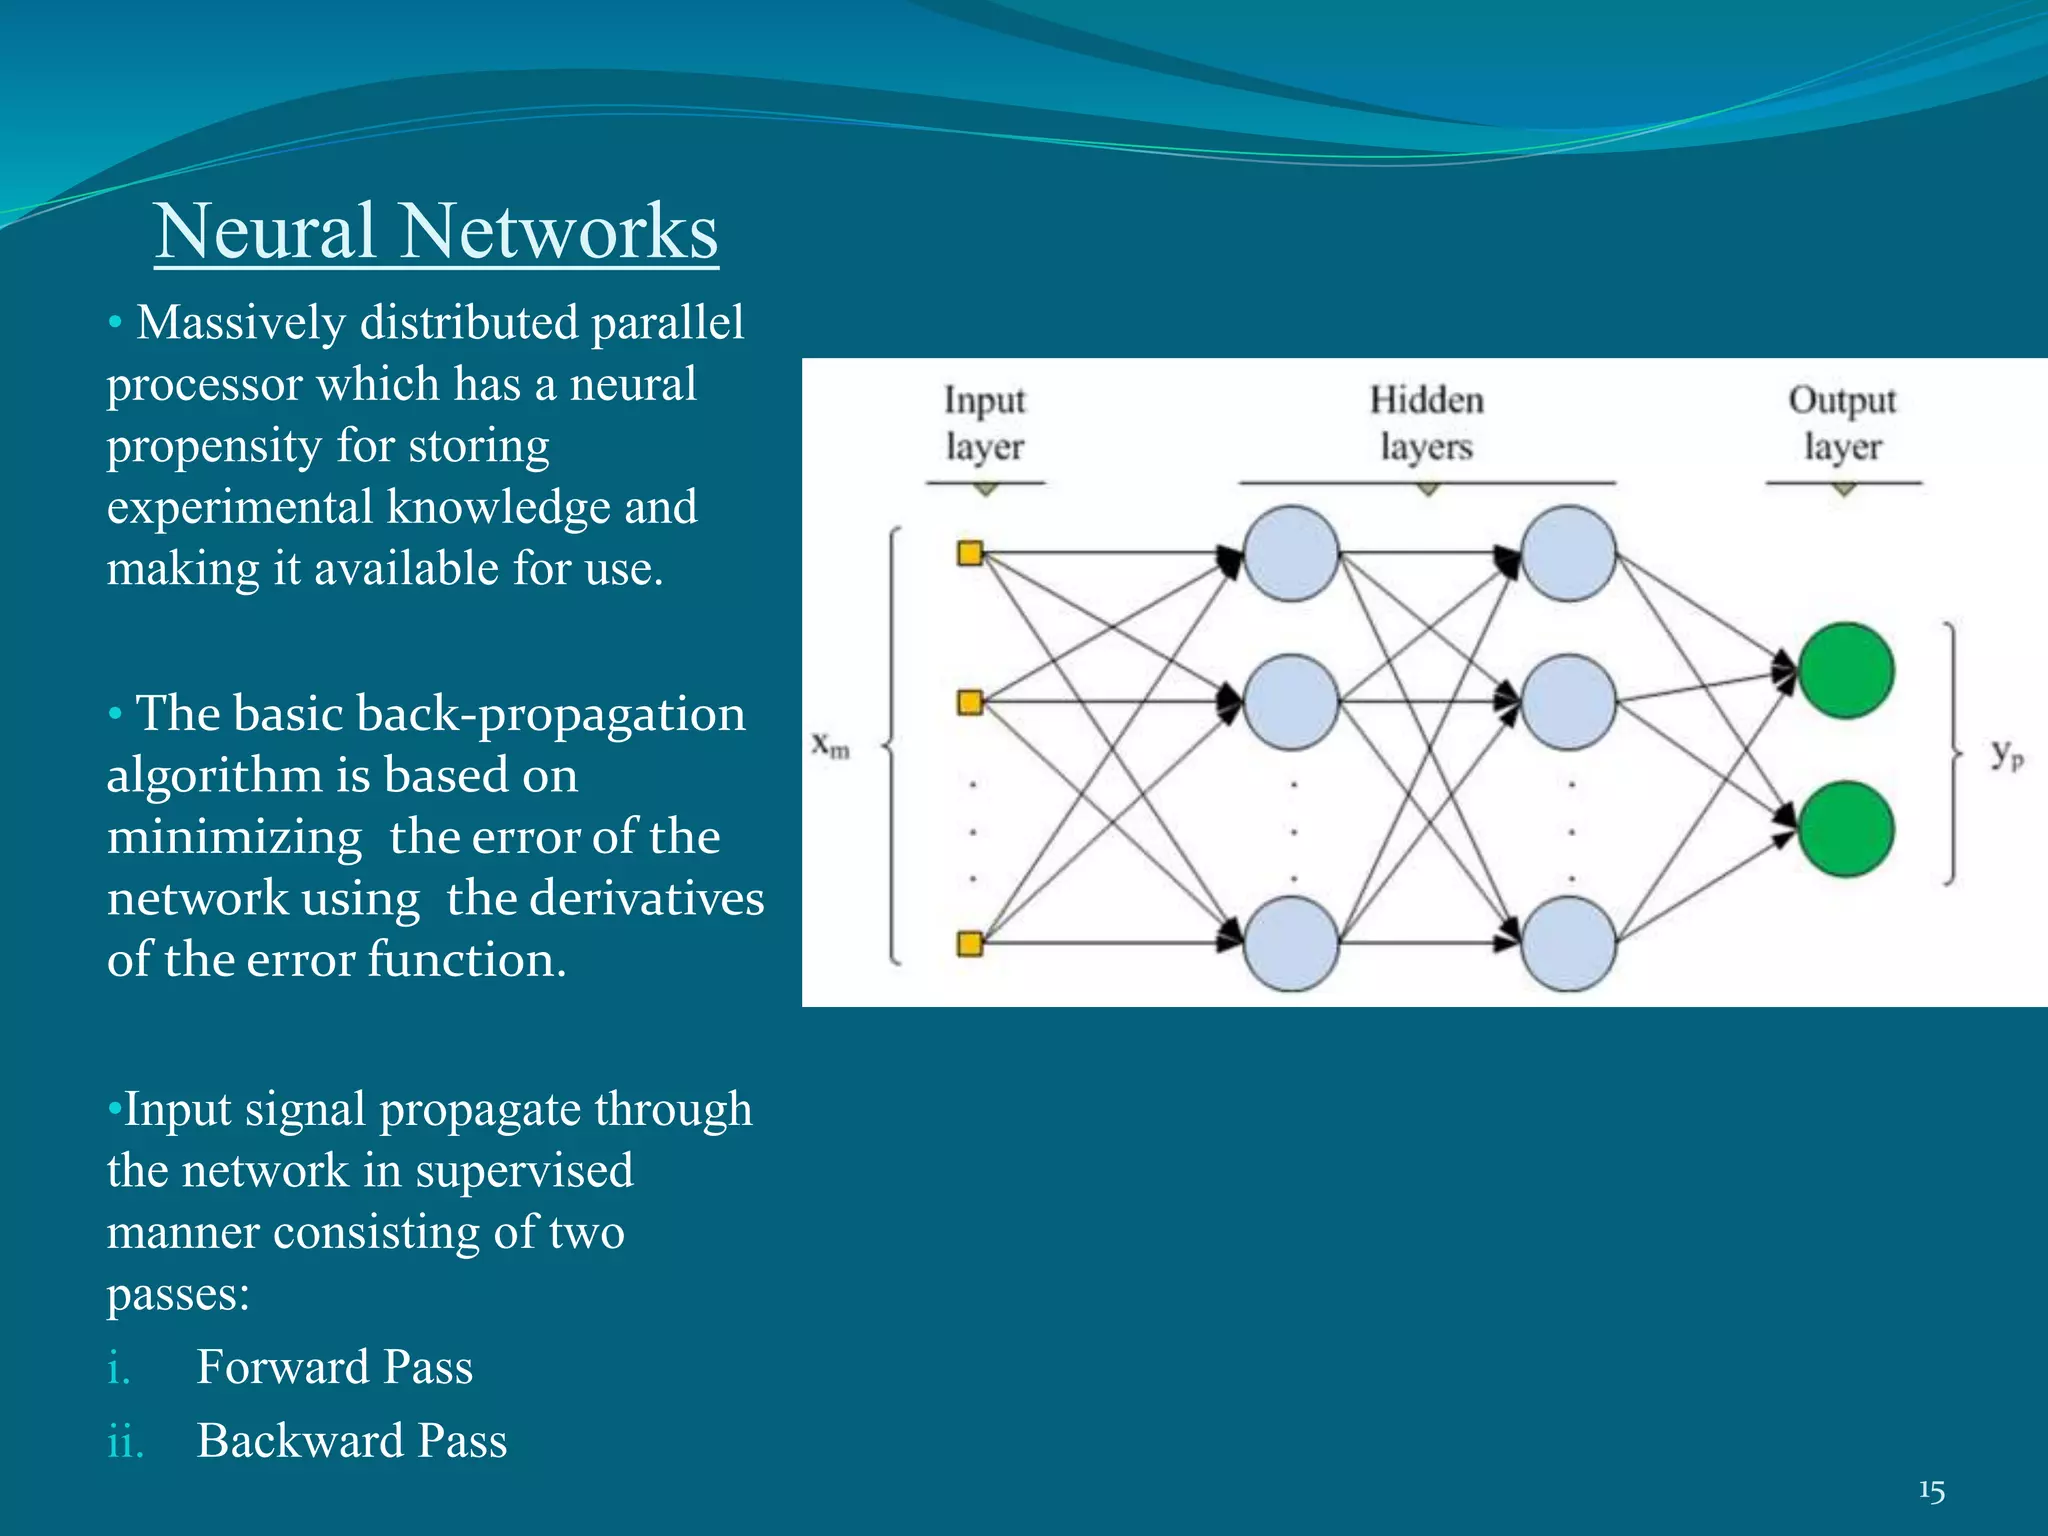
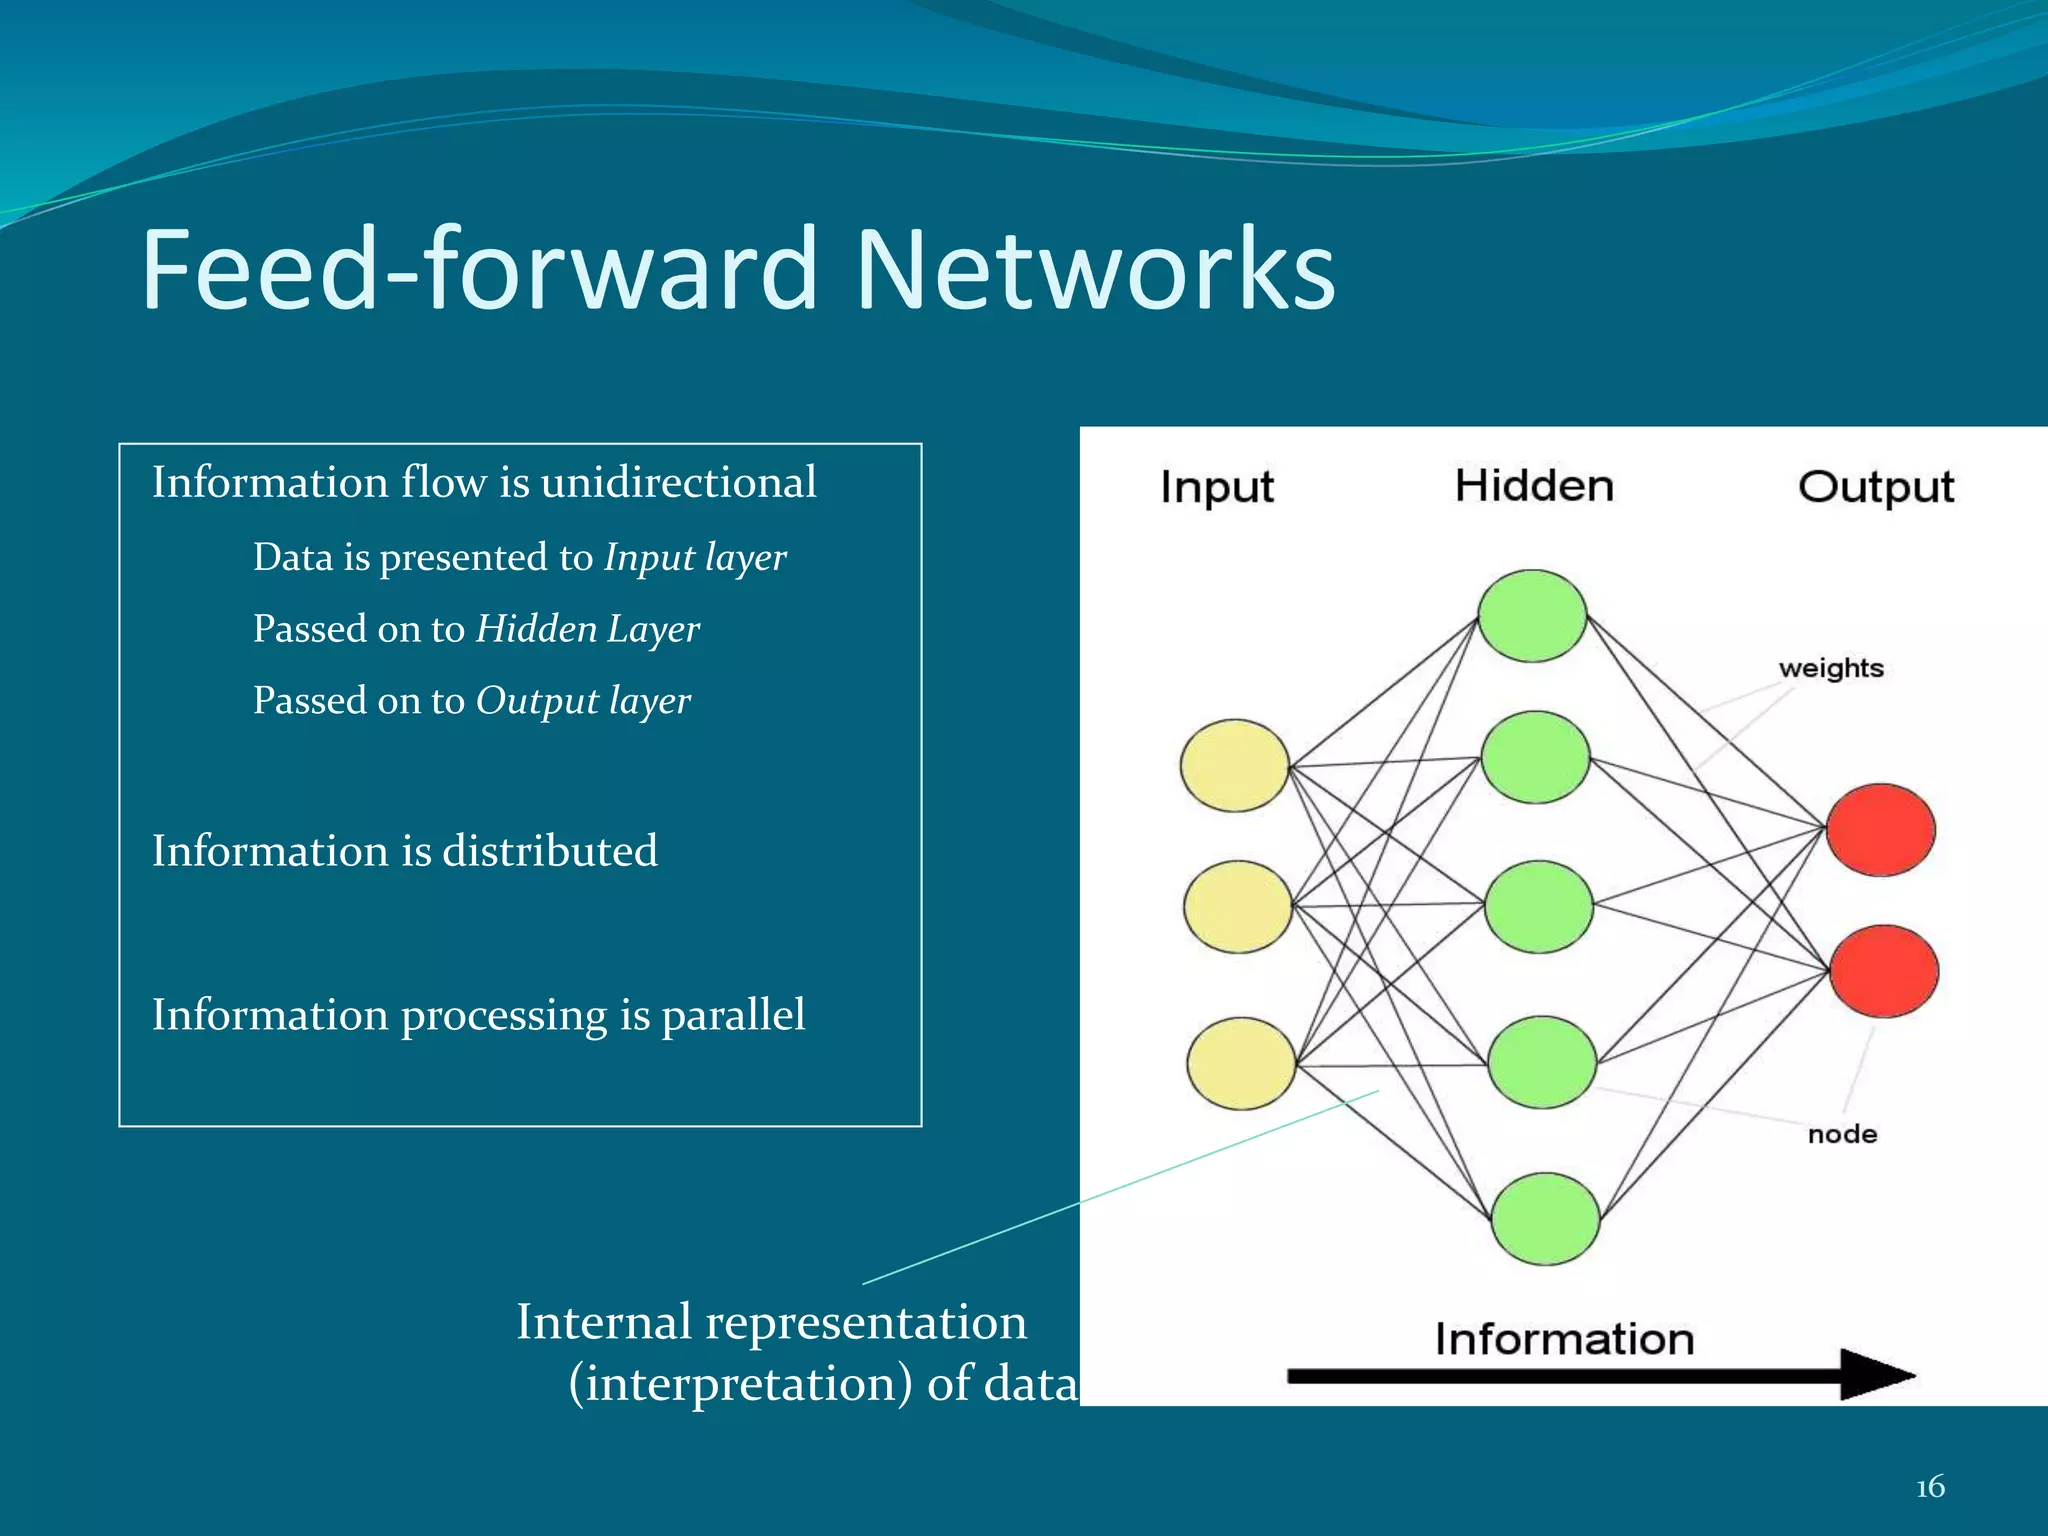
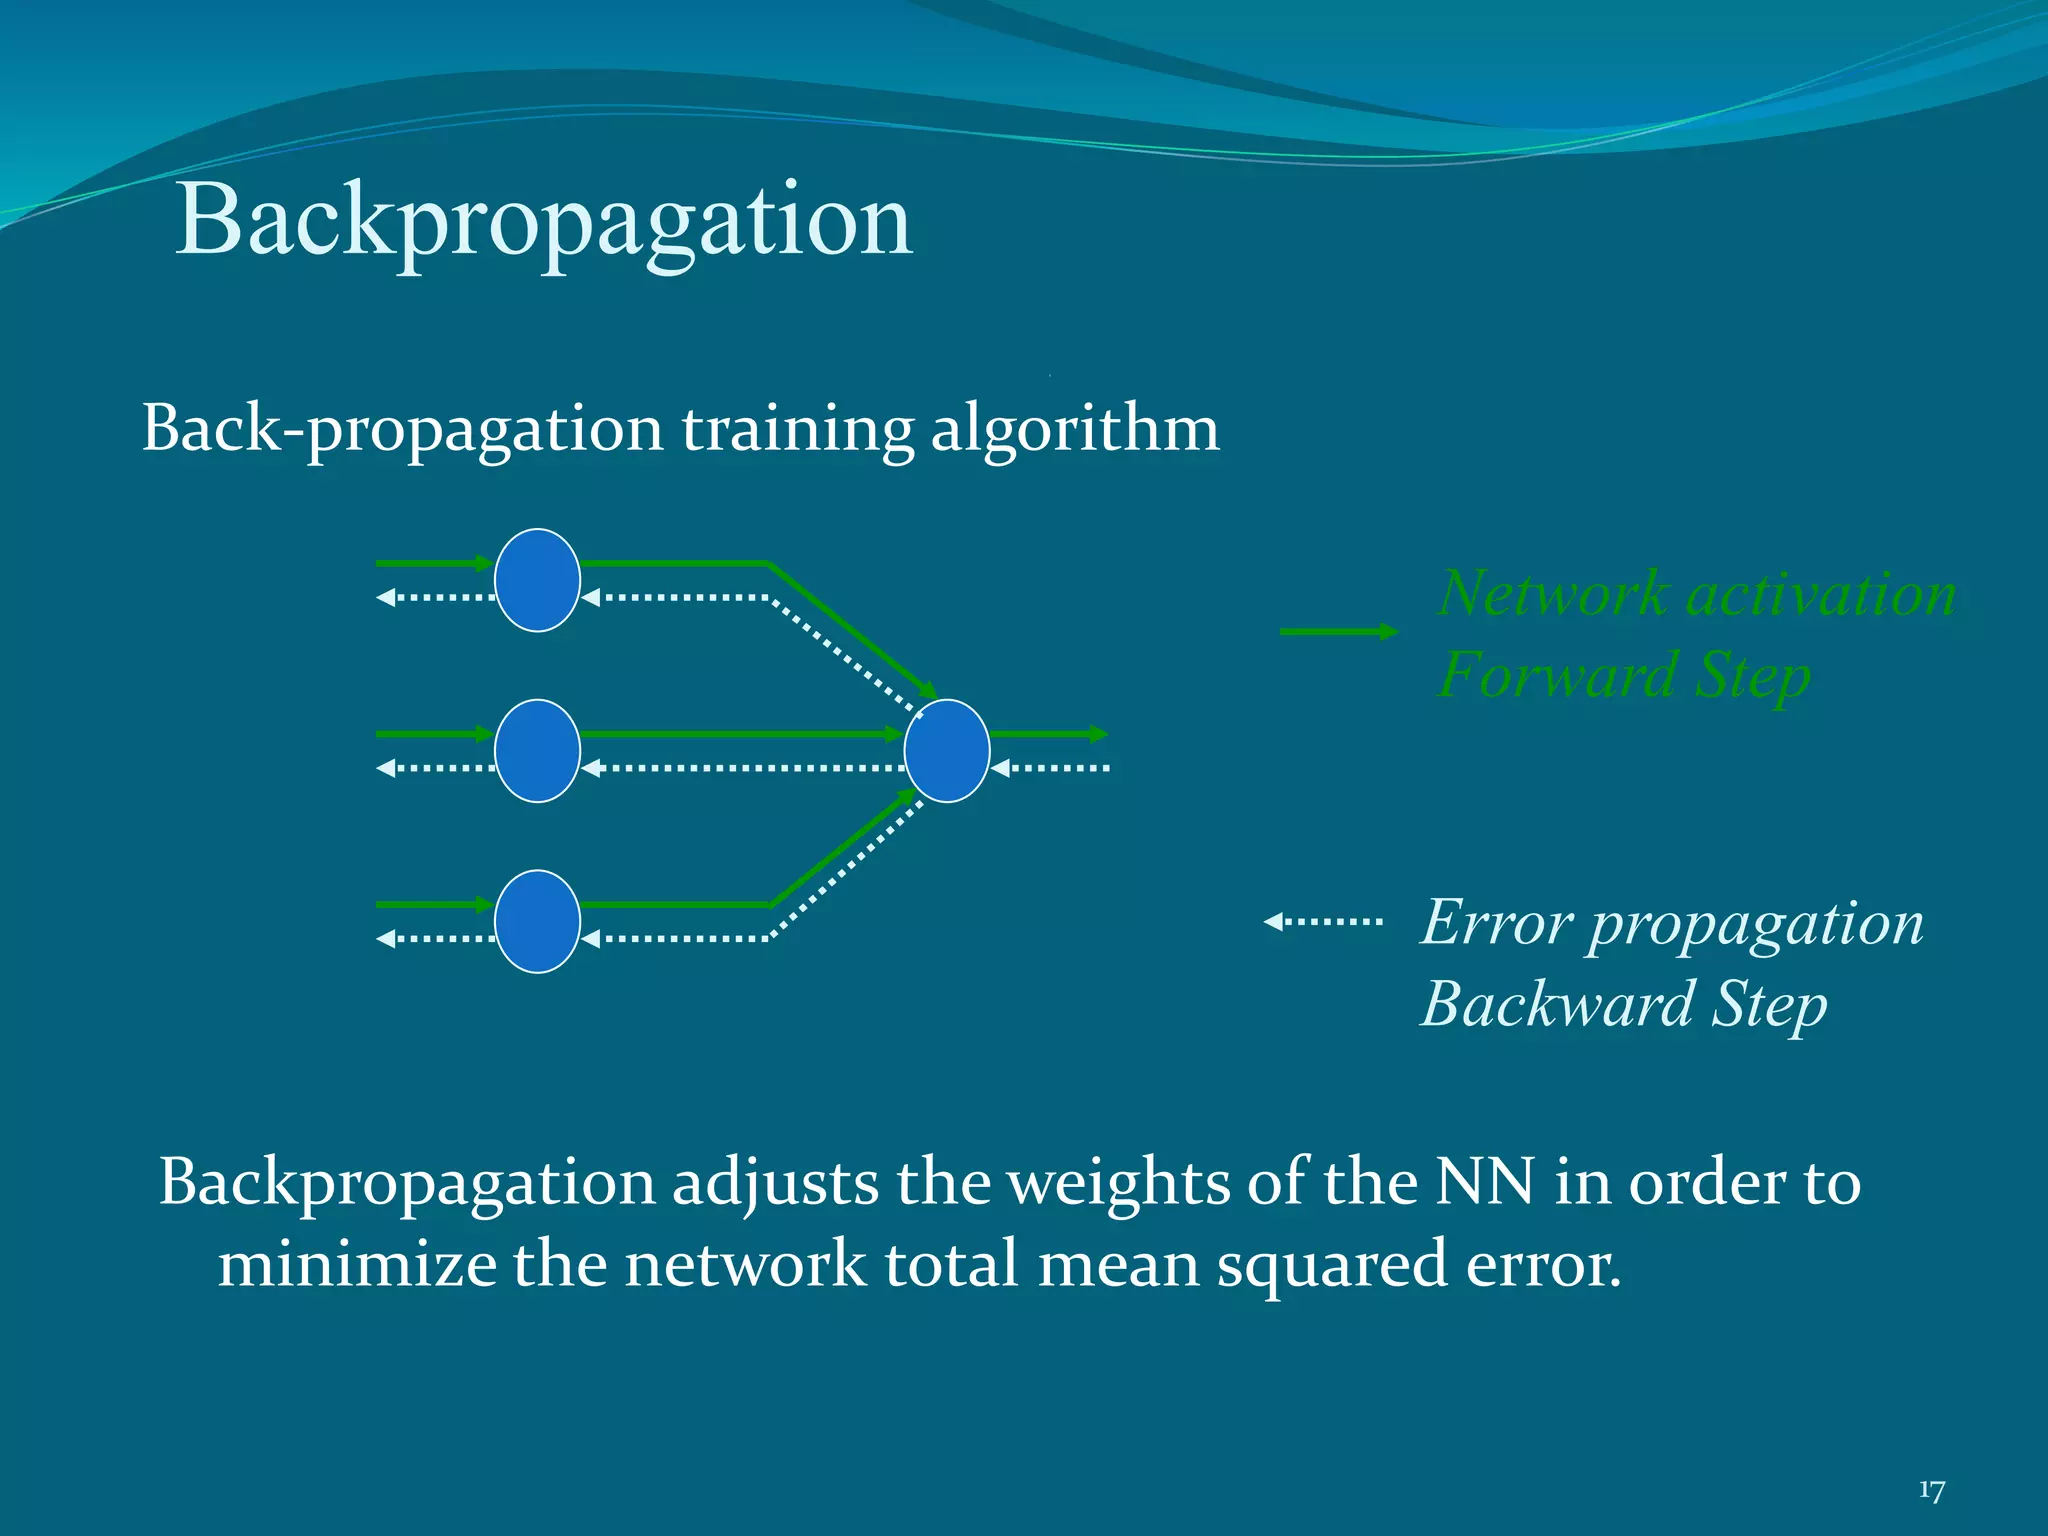
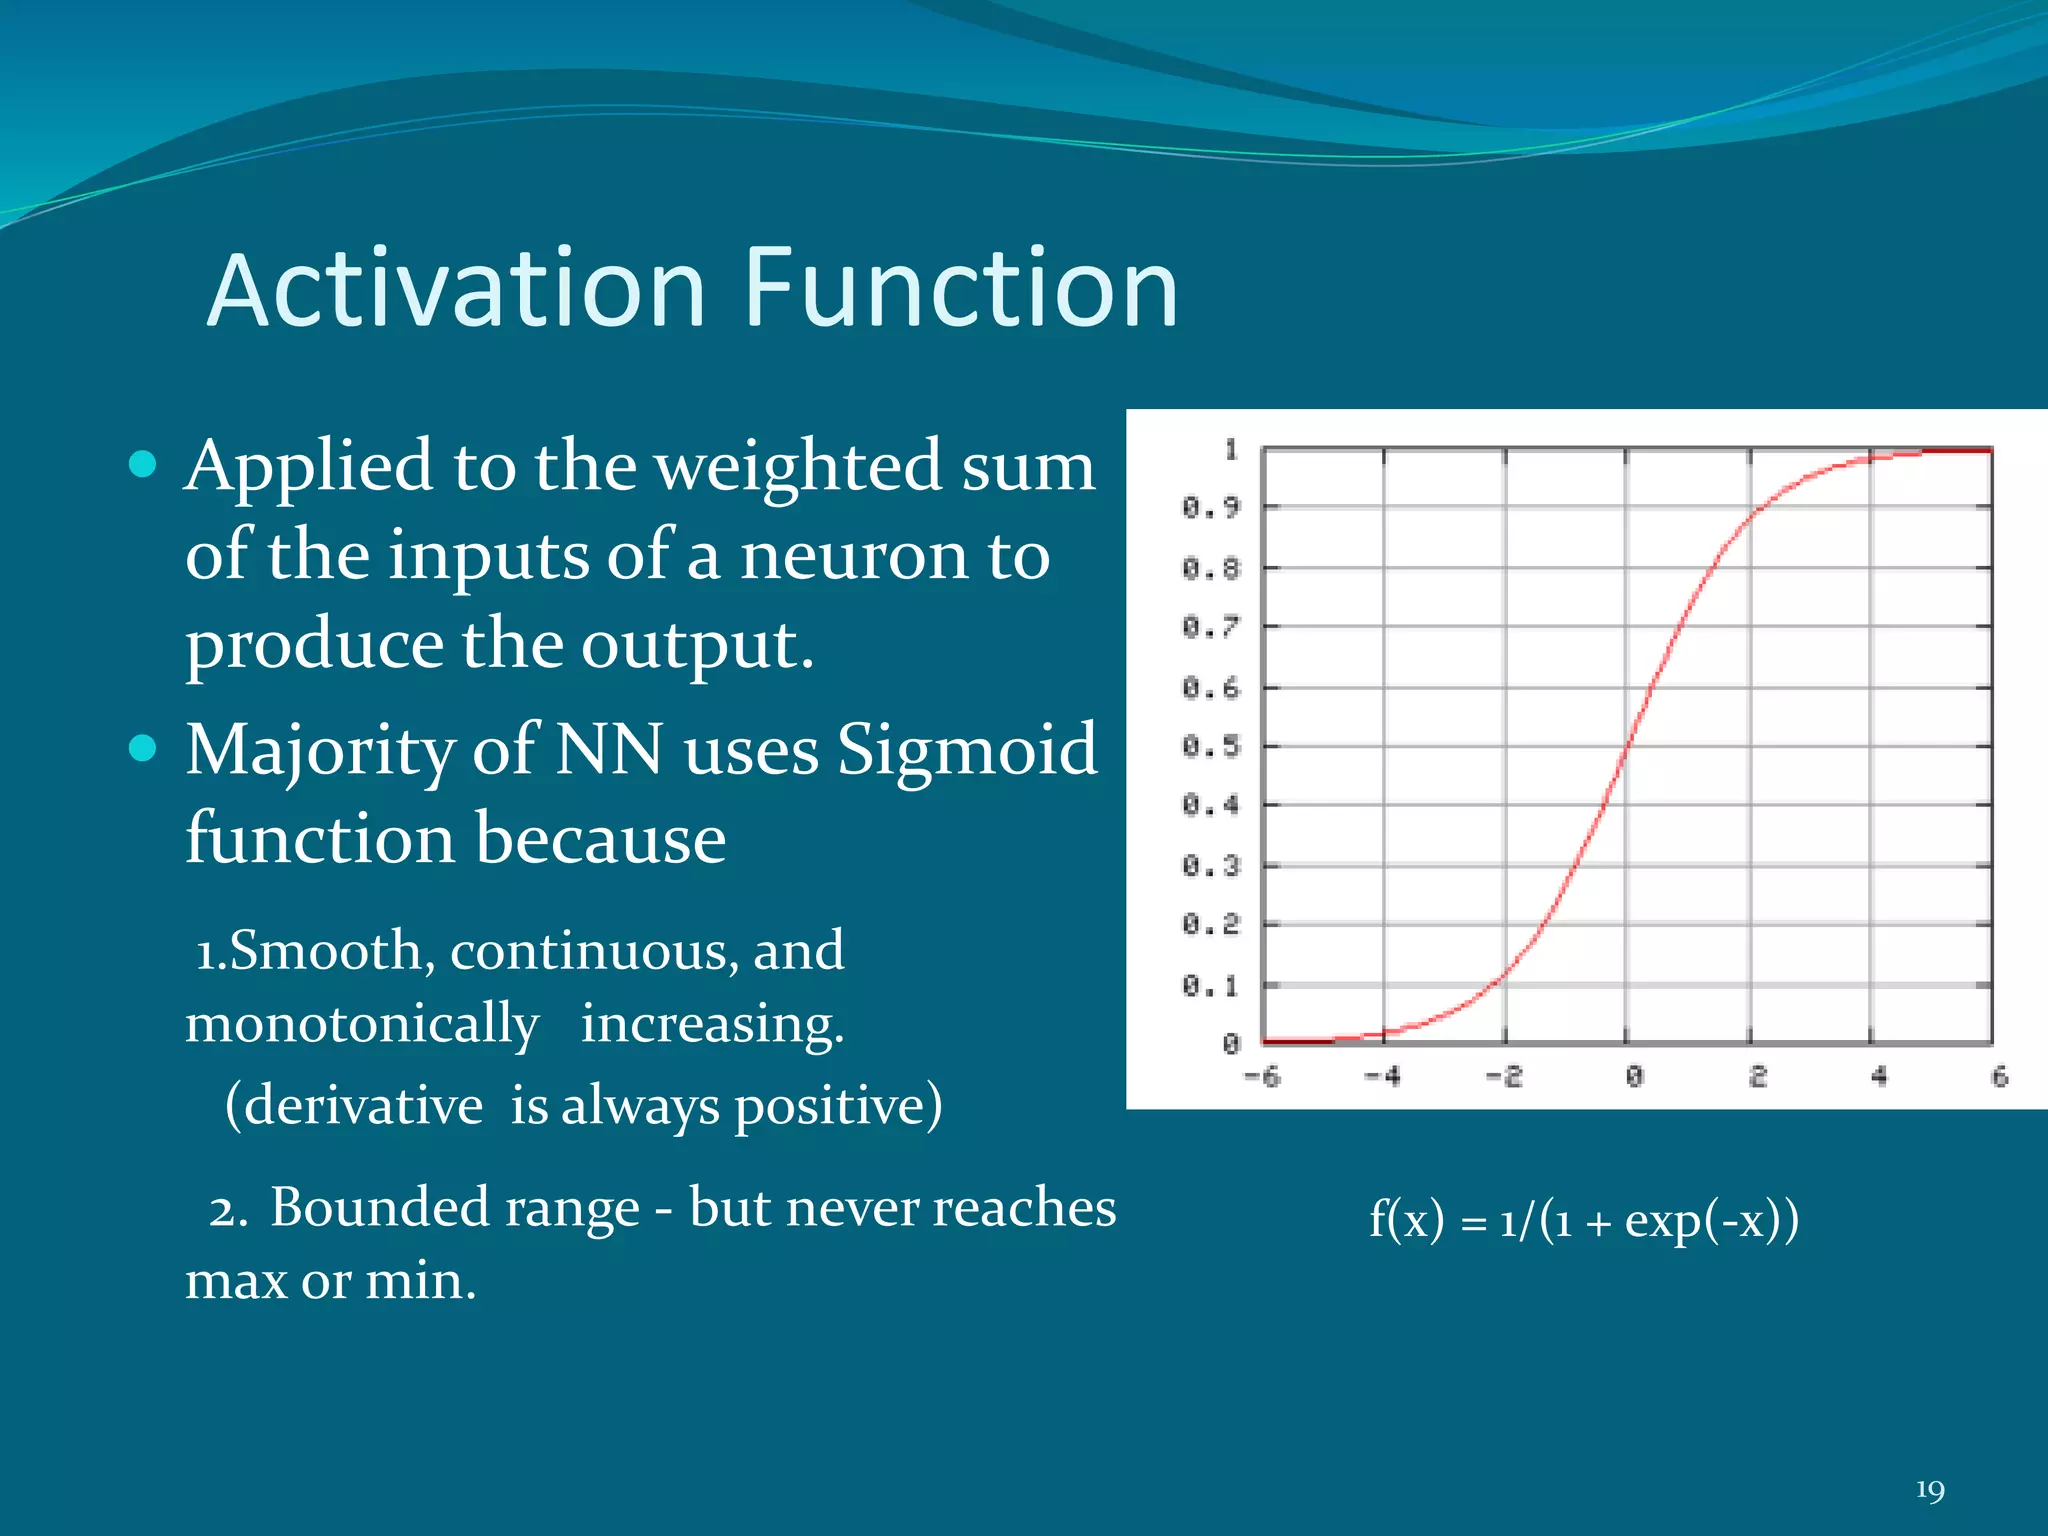
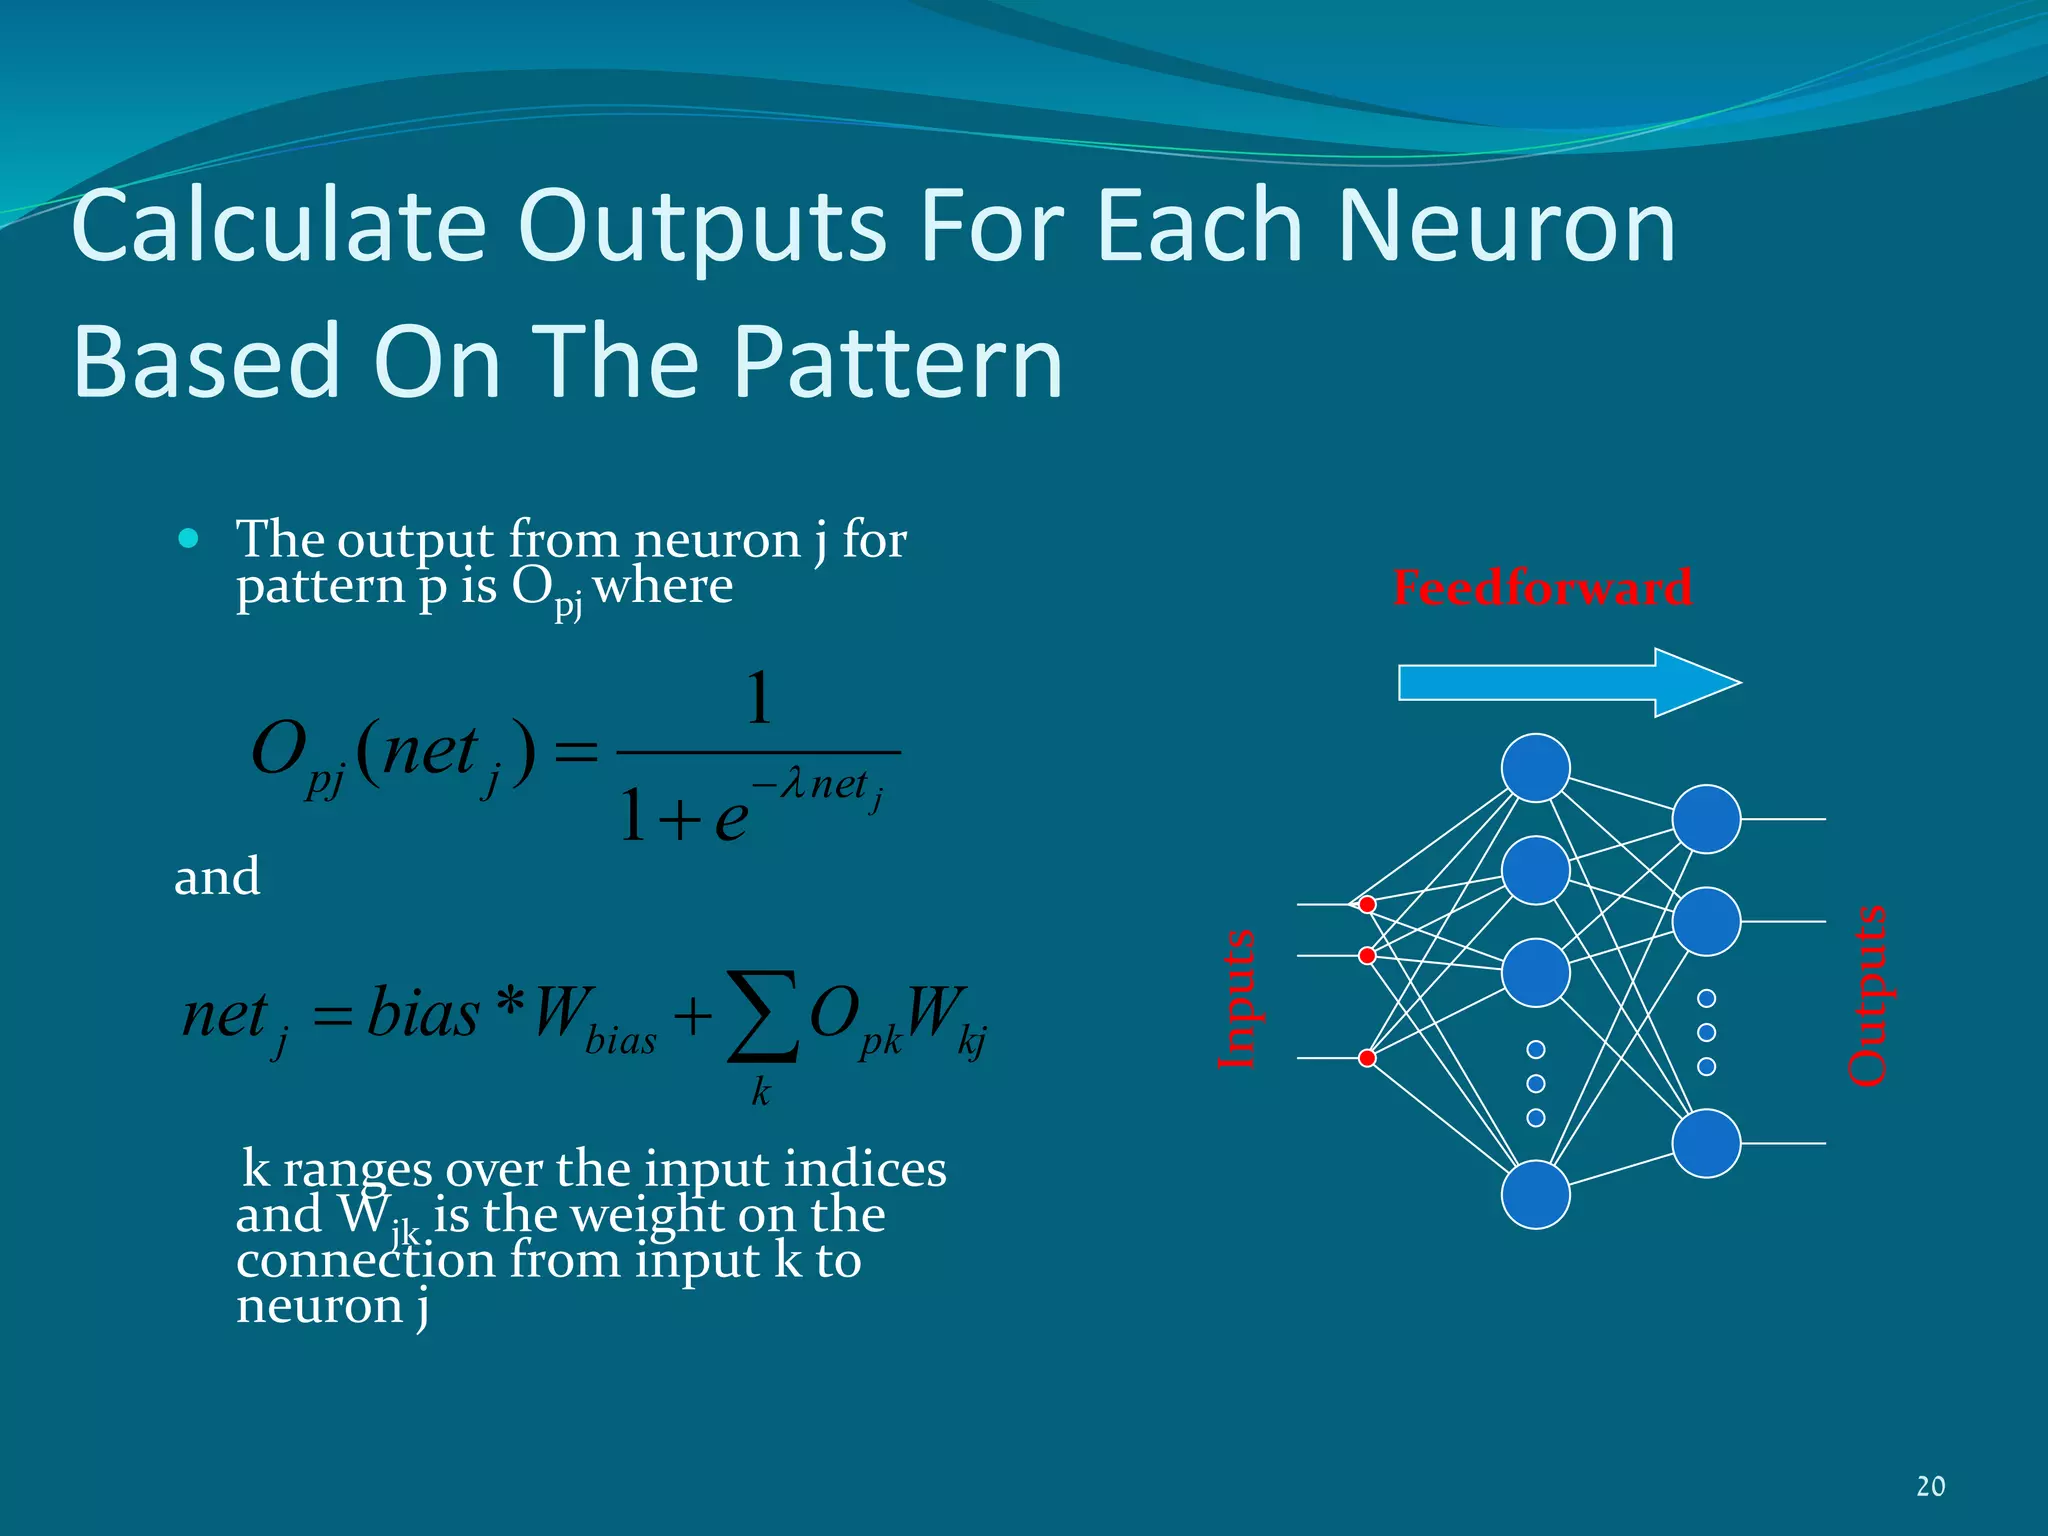
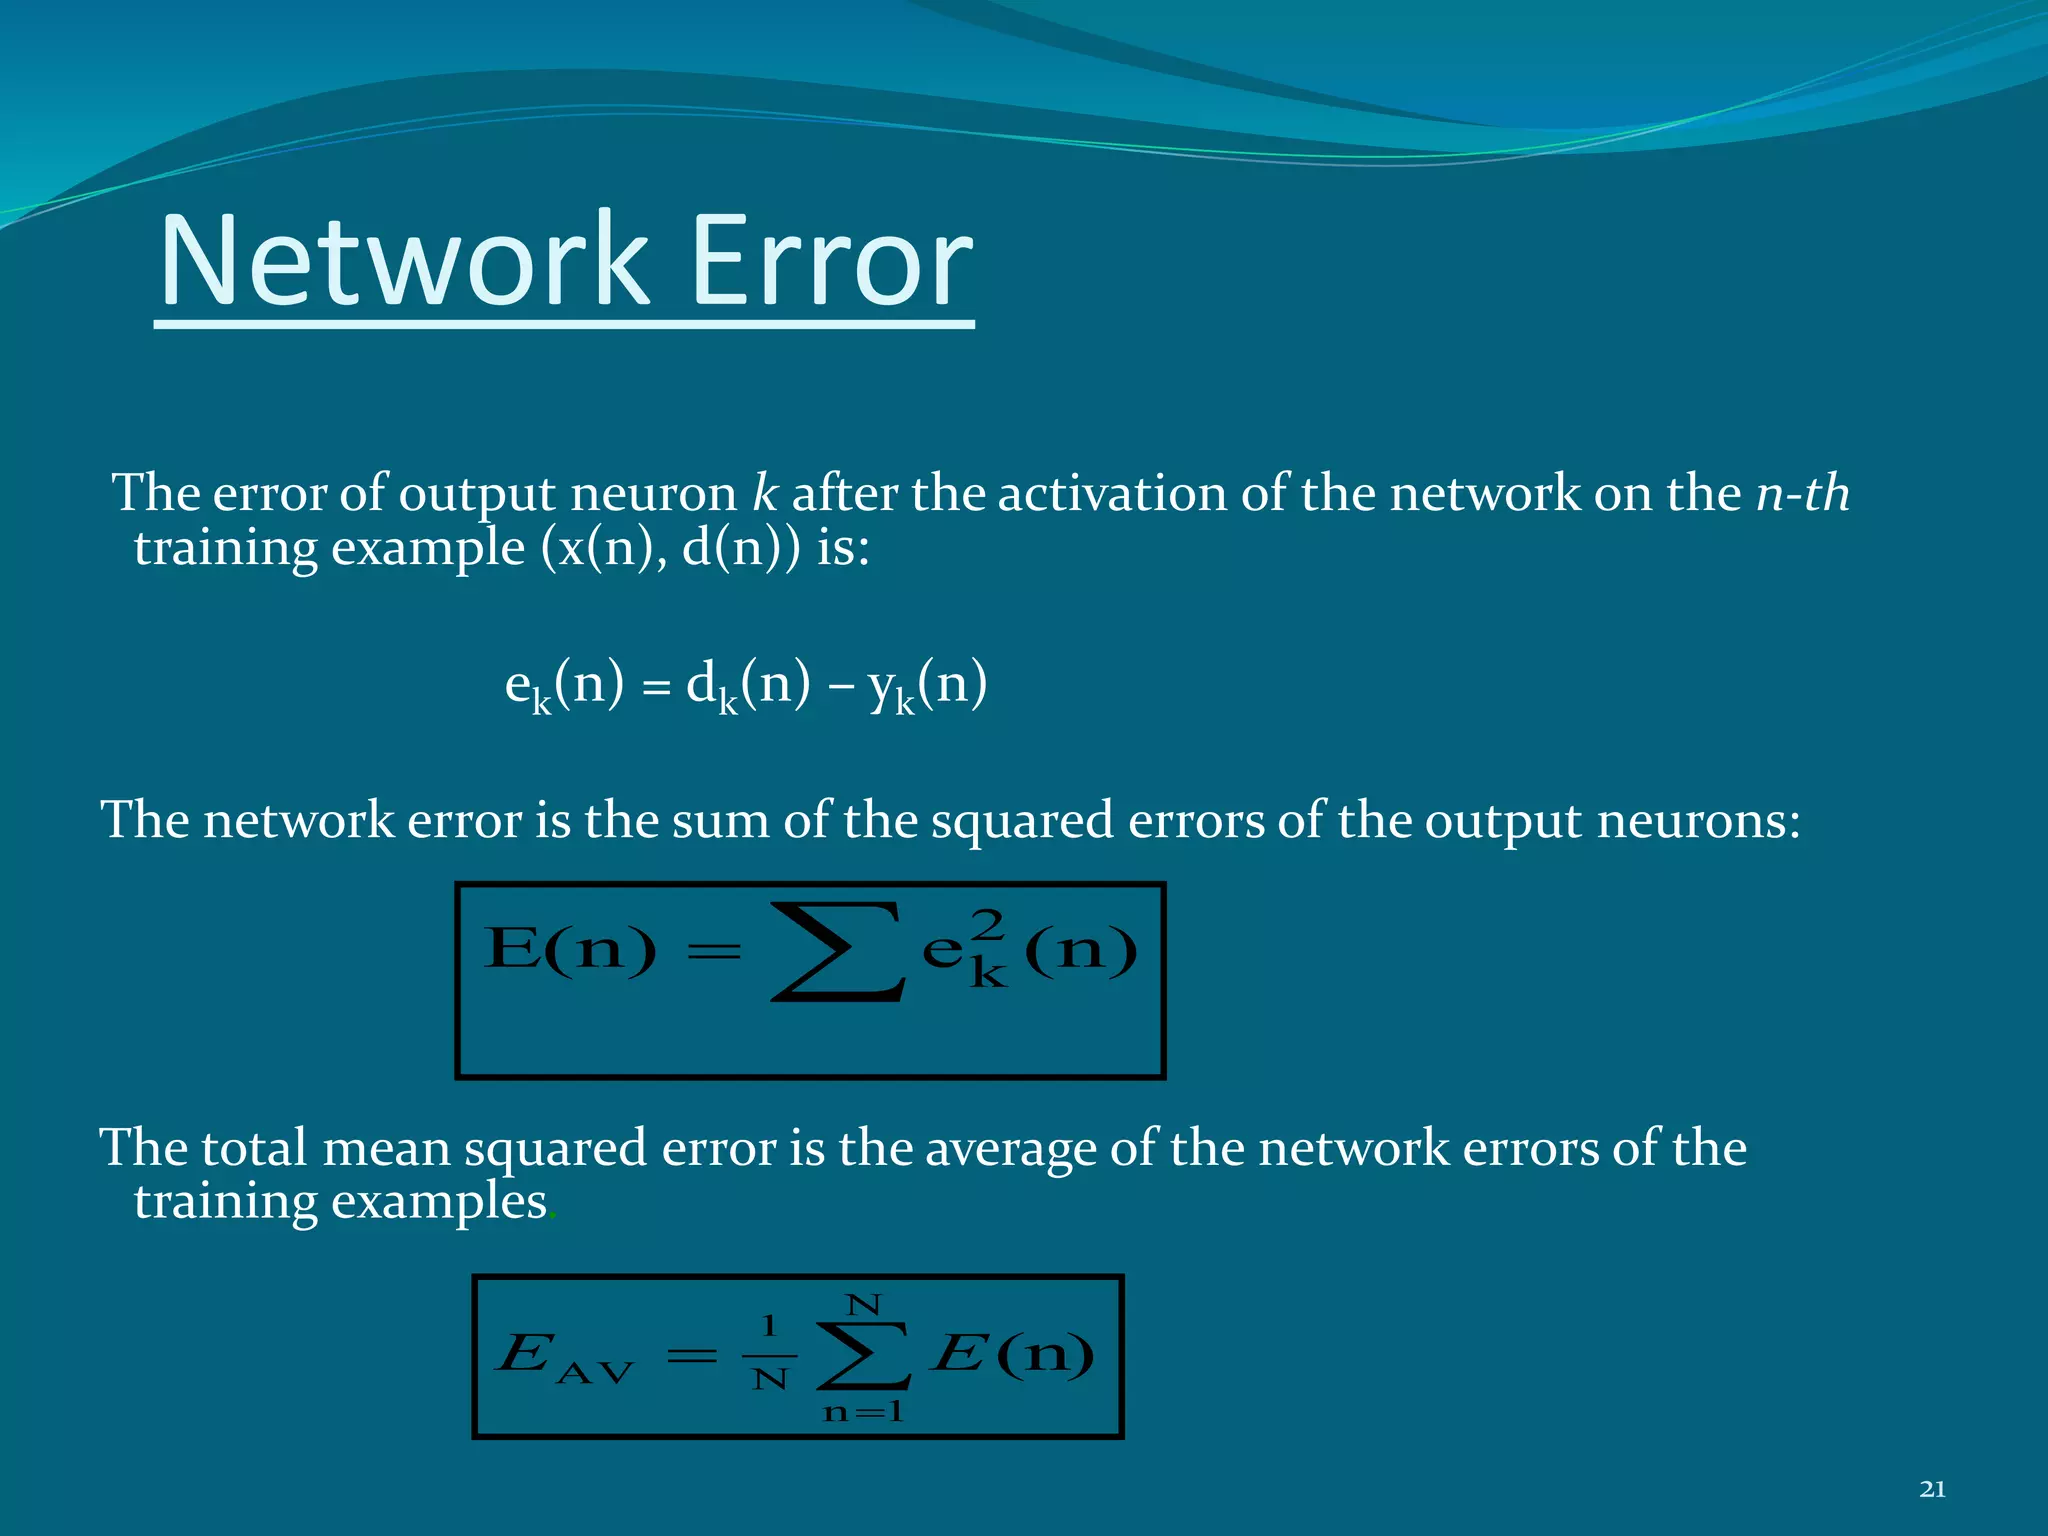
Project Presentation on-
A Neural Network Approach to
ECG Denoising
1
Contents
 Introduction to Neural Network & ECG
 Electrocardiography
 Downsampling
 Implementation of Band Pass Filters
 Differentiation
 Integration
 Squaring
 Thresholding
 QRS Detection
 Activation function
 Input to Backpropagation algorithm.
 Conclusions
 References
2
Electrocardiography
 Electrocardiography (ECG) is the acquisition
of electrical activity of the heart captured
over time by an external electrode attached to
the skin.
Applications of ECG:
o Find the cause of symptoms of heart disease
such as palpitations, arrhythmia,
cardiomyopathy, cardiomyopathy, heart valve
disease, pericarditis.
Objectives of ECG Denoising:
 Removal of Noises such as Power line
interference, base line drift due to respiration,
abrupt baseline shift, electromyogram (EMG)
interference and a composite noise made
from other types
3
FlowChart
ECG Signal Read & Plot
Random Noise Addition
Downsampling
Low –Pass Filter
High-Pass Filter
Differentiating Function
Squaring Function
QRS Detection
Thresholding
Integrating Function
Backpropagation algorithm
4
ECG Signal Plot
• Electrocardiography
(ECG)is a transthoracic
interpretation of the
electrical activity of the heart
over a period of time.
• Used to measure the rate
and regularity of heartbeats.
5
Noise Addition with ECG signal
6
Downsampling
• Process of reducing the
sampling rate of a signal
or the size of the data.
•The downsampling
factor (M) is usually an
integer or a rational
fraction greater than
unity.
•This factor multiplies
the sampling time or,
equivalently, divides the
sampling rate.
7
Low Pass Filter
Response Characteristics
•Purely linear phase
response.
•Power line noise is
significantly attenuated.
•Attenuation of the higher
frequency QRS Complex
& or Muscle noise present
would have also been
significantly attenuated.
Implementation of Band-Pass Filters
8
High Pass Filter
Response Characteristics:
•This filter also has purely
linear phase response.
• Attenuation of the T wave
due to the high-pass filter.
•This filter optimally passes
the frequencies characteristic
of a QRS complex while
attenuating lower and higher
frequency signals.
9
Contrasting difference of Band-Pass
Filters:-
Low-pass High-pass
10
Differentiating
Function
•Provides information
about the slope of the
QRS complex.
•P and T waves are further
attenuated while the peak-
to-peak signal
corresponding to the QRS
complex is further
enhanced.
11
Squaring &Integration Function
Squaring Function:-
Makes all data points in
the processed signal
positive and amplifies the
output of the derivative
process nonlinearly.
Integration function :-
Merging of QRS and T
complexes or several
peaks at the output of the
stage depending upon the
size of the window.
12
Thresholding
• Use of Sets of thresholds
that are just above the
noise peak levels when
signal-to-noise ratio
increases.
• Overall sensitivity of the
detector improves.
13
QRS Detection
•Beat detection is synonymous
to the detection of QRS
complexes & it provides the
information about presence of a
heartbeat and its occurrence
time.
Importance of design of a
QRS detector-
•Poor detection may propagate
to subsequent processing steps.
•.Beats that remain undetected
constitute a more severe error.
•Ability to follow sudden or
gradual changes in signal.
14
Neural Networks
• Massively distributed parallel
processor which has a neural
propensity for storing
experimental knowledge and
making it available for use.
• The basic back-propagation
algorithm is based on
minimizing the error of the
network using the derivatives
of the error function.
•Input signal propagate through
the network in supervised
manner consisting of two
passes:
i. Forward Pass
ii. Backward Pass
15
Feed-forward Networks
Information flow is unidirectional
Data is presented to Input layer
Passed on to Hidden Layer
Passed on to Output layer
Information is distributed
Information processing is parallel
Internal representation
(interpretation) of data
16
Backpropagation
Back-propagation training algorithm
Backpropagation adjusts the weights of the NN in order to
minimize the network total mean squared error.
Network activation
Forward Step
Error propagation
Backward Step
17
Weights
 The weights in a neural network are the most
important factor in determining its function.
 Normally, positive weights are considered as
excitatory while negative weights are thought of as
inhibitory.
 Training is the act of presenting the network with
some sample data and modifying the weights to
better approximate the desired function.
18
Activation Function
 Applied to the weighted sum
of the inputs of a neuron to
produce the output.
 Majority of NN uses Sigmoid
function because
1.Smooth, continuous, and
monotonically increasing.
(derivative is always positive)
2. Bounded range - but never reaches
max or min.
f(x) = 1/(1 + exp(-x))
19
Calculate Outputs For Each Neuron
Based On The Pattern
 The output from neuron j for
pattern p is Opj where
and
k ranges over the input indices
and Wjk is the weight on the
connection from input k to
neuron j
Feedforward
Inputs
Outputs
jnetjpj
e
netO 


1
1
)(

k
kjpkbiasj WOWbiasnet *
20
Network Error
The error of output neuron k after the activation of the network on the n-th
training example (x(n), d(n)) is:
ek(n) = dk(n) – yk(n)
The network error is the sum of the squared errors of the output neurons:
The total mean squared error is the average of the network errors of the
training examples.
(n)eE(n) 2
k


N
1n
N
1
AV (n)EE
21
Conclusion
 ADD UR OWN
22
References
 P. S. Hamilton and W. J. Tompkins. Quantitative investigation of QRS
detection rules using the MIT/BIH arrhythmia database. IEEE Trans. Biomed.
Eng, BME-33:1158{1165, 1987.
 G. E. Hinton. A Practical Guide to Training Restricted Boltzmann Machines.
Technical Report UTML TR 2010003, Dept. of Comp. Sci., University of
Toronto, 2010.
 G. B. Moody and R. G. Mark. The impact of the MIT-BIH Arrhythmia
Database. IEEE Engineering in Medicine and Biology Magazine, 20(3):45-50,
2001.
 George B. Moody. The PhysioNet/Computing in Cardiology Challenge2010:
Mind the Gap. In Computing in Cardiology 2010, volume 37, Belfast,2010.
 R. Rodrigues. Filling in the Gap: a General Method using Neural Networks.In
Computers in Cardiology, volume 37, pages 453{456, 2010.
23
24

ECG DENOISING USING NN.pp

  • 1.
    Project Presentation on- ANeural Network Approach to ECG Denoising 1
  • 2.
    Contents  Introduction toNeural Network & ECG  Electrocardiography  Downsampling  Implementation of Band Pass Filters  Differentiation  Integration  Squaring  Thresholding  QRS Detection  Activation function  Input to Backpropagation algorithm.  Conclusions  References 2
  • 3.
    Electrocardiography  Electrocardiography (ECG)is the acquisition of electrical activity of the heart captured over time by an external electrode attached to the skin. Applications of ECG: o Find the cause of symptoms of heart disease such as palpitations, arrhythmia, cardiomyopathy, cardiomyopathy, heart valve disease, pericarditis. Objectives of ECG Denoising:  Removal of Noises such as Power line interference, base line drift due to respiration, abrupt baseline shift, electromyogram (EMG) interference and a composite noise made from other types 3
  • 4.
    FlowChart ECG Signal Read& Plot Random Noise Addition Downsampling Low –Pass Filter High-Pass Filter Differentiating Function Squaring Function QRS Detection Thresholding Integrating Function Backpropagation algorithm 4
  • 5.
    ECG Signal Plot •Electrocardiography (ECG)is a transthoracic interpretation of the electrical activity of the heart over a period of time. • Used to measure the rate and regularity of heartbeats. 5
  • 6.
    Noise Addition withECG signal 6
  • 7.
    Downsampling • Process ofreducing the sampling rate of a signal or the size of the data. •The downsampling factor (M) is usually an integer or a rational fraction greater than unity. •This factor multiplies the sampling time or, equivalently, divides the sampling rate. 7
  • 8.
    Low Pass Filter ResponseCharacteristics •Purely linear phase response. •Power line noise is significantly attenuated. •Attenuation of the higher frequency QRS Complex & or Muscle noise present would have also been significantly attenuated. Implementation of Band-Pass Filters 8
  • 9.
    High Pass Filter ResponseCharacteristics: •This filter also has purely linear phase response. • Attenuation of the T wave due to the high-pass filter. •This filter optimally passes the frequencies characteristic of a QRS complex while attenuating lower and higher frequency signals. 9
  • 10.
    Contrasting difference ofBand-Pass Filters:- Low-pass High-pass 10
  • 11.
    Differentiating Function •Provides information about theslope of the QRS complex. •P and T waves are further attenuated while the peak- to-peak signal corresponding to the QRS complex is further enhanced. 11
  • 12.
    Squaring &Integration Function SquaringFunction:- Makes all data points in the processed signal positive and amplifies the output of the derivative process nonlinearly. Integration function :- Merging of QRS and T complexes or several peaks at the output of the stage depending upon the size of the window. 12
  • 13.
    Thresholding • Use ofSets of thresholds that are just above the noise peak levels when signal-to-noise ratio increases. • Overall sensitivity of the detector improves. 13
  • 14.
    QRS Detection •Beat detectionis synonymous to the detection of QRS complexes & it provides the information about presence of a heartbeat and its occurrence time. Importance of design of a QRS detector- •Poor detection may propagate to subsequent processing steps. •.Beats that remain undetected constitute a more severe error. •Ability to follow sudden or gradual changes in signal. 14
  • 15.
    Neural Networks • Massivelydistributed parallel processor which has a neural propensity for storing experimental knowledge and making it available for use. • The basic back-propagation algorithm is based on minimizing the error of the network using the derivatives of the error function. •Input signal propagate through the network in supervised manner consisting of two passes: i. Forward Pass ii. Backward Pass 15
  • 16.
    Feed-forward Networks Information flowis unidirectional Data is presented to Input layer Passed on to Hidden Layer Passed on to Output layer Information is distributed Information processing is parallel Internal representation (interpretation) of data 16
  • 17.
    Backpropagation Back-propagation training algorithm Backpropagationadjusts the weights of the NN in order to minimize the network total mean squared error. Network activation Forward Step Error propagation Backward Step 17
  • 18.
    Weights  The weightsin a neural network are the most important factor in determining its function.  Normally, positive weights are considered as excitatory while negative weights are thought of as inhibitory.  Training is the act of presenting the network with some sample data and modifying the weights to better approximate the desired function. 18
  • 19.
    Activation Function  Appliedto the weighted sum of the inputs of a neuron to produce the output.  Majority of NN uses Sigmoid function because 1.Smooth, continuous, and monotonically increasing. (derivative is always positive) 2. Bounded range - but never reaches max or min. f(x) = 1/(1 + exp(-x)) 19
  • 20.
    Calculate Outputs ForEach Neuron Based On The Pattern  The output from neuron j for pattern p is Opj where and k ranges over the input indices and Wjk is the weight on the connection from input k to neuron j Feedforward Inputs Outputs jnetjpj e netO    1 1 )(  k kjpkbiasj WOWbiasnet * 20
  • 21.
    Network Error The errorof output neuron k after the activation of the network on the n-th training example (x(n), d(n)) is: ek(n) = dk(n) – yk(n) The network error is the sum of the squared errors of the output neurons: The total mean squared error is the average of the network errors of the training examples. (n)eE(n) 2 k   N 1n N 1 AV (n)EE 21
  • 22.
  • 23.
    References  P. S.Hamilton and W. J. Tompkins. Quantitative investigation of QRS detection rules using the MIT/BIH arrhythmia database. IEEE Trans. Biomed. Eng, BME-33:1158{1165, 1987.  G. E. Hinton. A Practical Guide to Training Restricted Boltzmann Machines. Technical Report UTML TR 2010003, Dept. of Comp. Sci., University of Toronto, 2010.  G. B. Moody and R. G. Mark. The impact of the MIT-BIH Arrhythmia Database. IEEE Engineering in Medicine and Biology Magazine, 20(3):45-50, 2001.  George B. Moody. The PhysioNet/Computing in Cardiology Challenge2010: Mind the Gap. In Computing in Cardiology 2010, volume 37, Belfast,2010.  R. Rodrigues. Filling in the Gap: a General Method using Neural Networks.In Computers in Cardiology, volume 37, pages 453{456, 2010. 23
  • 24.