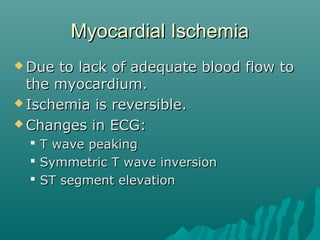
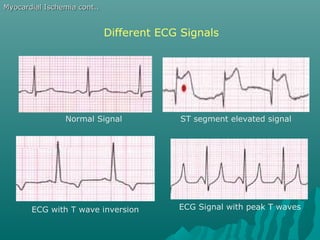
Downloaded 44 times
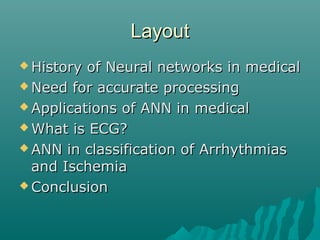
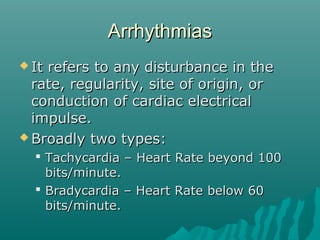
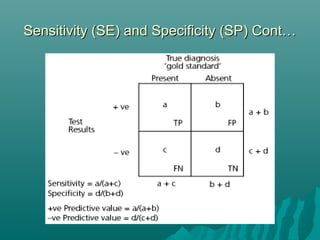
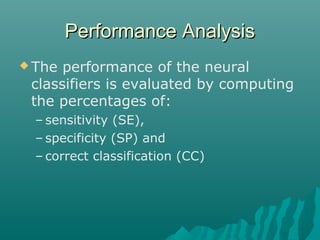
![Sensitivity (SE) and Specificity (SP)Sensitivity (SE) and Specificity (SP)
Helps us to explore the relationshipHelps us to explore the relationship
between a diagnostic test and the (true)between a diagnostic test and the (true)
presence or absence of disease.presence or absence of disease.
A test which is very sensitive will rarelyA test which is very sensitive will rarely
miss people with the disease.miss people with the disease.
A specific test will have few false positiveA specific test will have few false positive
results - it will rarely misclassify peopleresults - it will rarely misclassify people
without the disease as being diseased.without the disease as being diseased.
Classification Rate:Classification Rate:
CC = 100×(TP+TN)/(TN+TP+FN+FP)]](https://image.slidesharecdn.com/ecg-151028144303-lva1-app6892/85/Ecg-17-320.jpg)
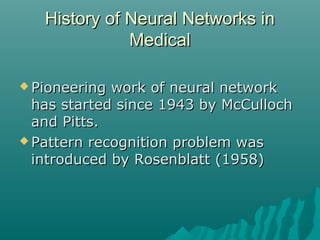
![ReferencesReferences
[1] M. A. Chikh, F. Bereksi Reguig. Application of
artificial neural networks to identify the
premature ventricular contraction (PVC)
beats,2004
[2] Costas Papaloukasa, Dimitrios I. Fotiadisb,
Aristidis Likasb, Lampros K. Michalis. An ischemia
detection method based on artificial neural
networks,2002
[3] C.D. Nugent, J.A.C. Webb, N.D. Black, G.T.H.
Wright, M. McIntyre. An intelligent framework for
the classification of the 12-lead ECG, 1999.](https://image.slidesharecdn.com/ecg-151028144303-lva1-app6892/85/Ecg-33-320.jpg)
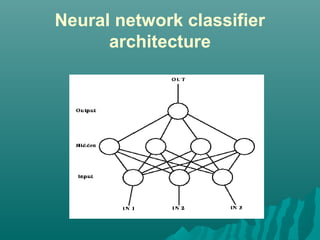
![ Introduction to Neural Networks in Healthcare,Introduction to Neural Networks in Healthcare,
Open Clinic, 2002.Open Clinic, 2002.
[4] M.S. Thaler, The Only EKG Book You’ll Ever[4] M.S. Thaler, The Only EKG Book You’ll Ever
Need 3Need 3rdrd
Edition, Lippincott Williams & Wilkins.Edition, Lippincott Williams & Wilkins.
P.J Mehta, Understanding ECG, 5P.J Mehta, Understanding ECG, 5thth
Edition, TheEdition, The
National Book Depot.National Book Depot.](https://image.slidesharecdn.com/ecg-151028144303-lva1-app6892/85/Ecg-34-320.jpg)


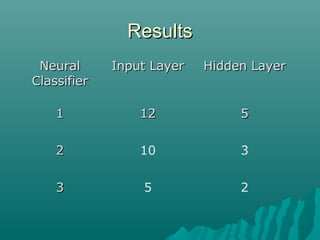
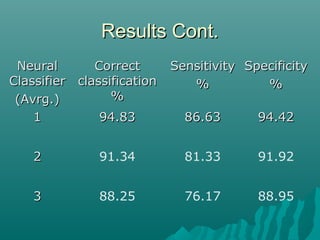
This document discusses using neural networks for ECG classification. It provides background on neural networks in medical applications and discusses their use in classifying arrhythmias and ischemia from ECG data. The document outlines approaches taken, including feature extraction methods and training neural network classifiers. Results show correct classification rates from 88-95% depending on the network architecture.


![Cardiovascular_Diseases_PPTX[1].pptxandwell](https://cdn.slidesharecdn.com/ss_thumbnails/cardiovasculardiseasespptx1-250228073818-36491115-thumbnail.jpg?width=640&height=640&fit=bounds)