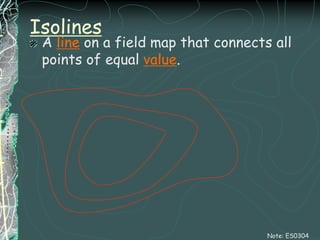
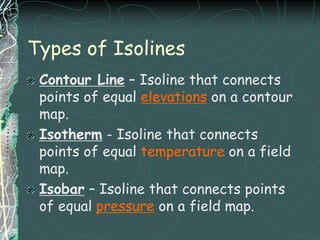
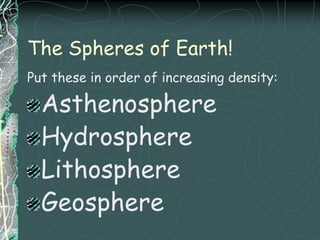
This document provides information about Earth's spheres and mapping locations on Earth. It discusses the geosphere, atmosphere, hydrosphere, and biosphere. It describes latitude and longitude and how they are used in a coordinate system to locate positions on Earth. It also covers topics like time zones, topographic maps, and drawing contour lines.

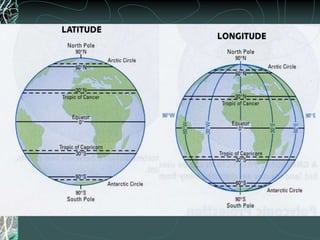
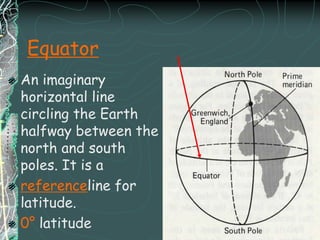
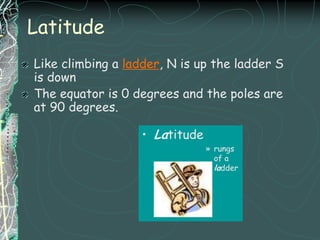
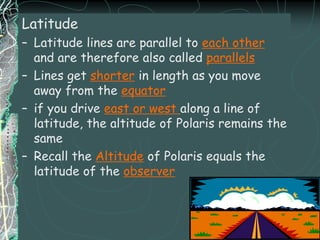
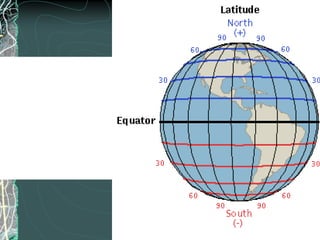
![LatitudeAngular distance north or south of the equator, measured from the center of the earth [the core].They are Horizontal Lines running east-west, but, measure north-south.Measured in degrees, minutes, and second.](https://image.slidesharecdn.com/earthsdimensionsci8pptnp1-110125082821-phpapp02/85/Earths-dimension-sci-8-ppt-np1-20-320.jpg)
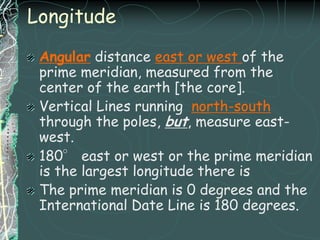
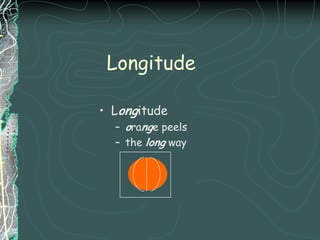
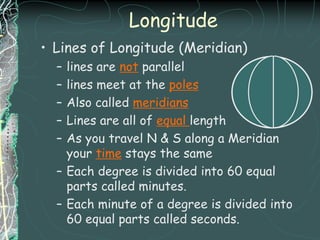
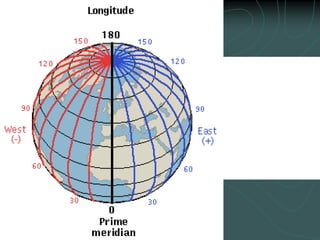
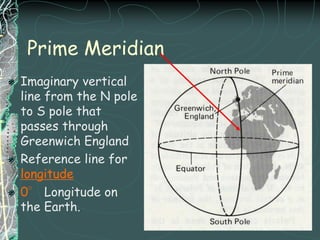
![LongitudeAngular distance east or west of the prime meridian, measured from the center of the earth [the core].Vertical Lines running north-south through the poles, but, measure east-west.180° east or west or the prime meridian is the largest longitude there isThe prime meridian is 0 degrees and the International Date Line is 180 degrees.](https://image.slidesharecdn.com/earthsdimensionsci8pptnp1-110125082821-phpapp02/85/Earths-dimension-sci-8-ppt-np1-27-320.jpg)