The document discusses Earth-Sun relationships and how the position of the subsolar point changes throughout the year due to the tilt of Earth's axis and its elliptical orbit. It also discusses equinoxes, solstices, and how an analemma can be used to determine the subsolar point and solar noon for any date. Topographic maps and how to measure distances and road lengths using map scales are described. The use of compasses to determine direction of travel and current position via landmarks is explained.
To proceed with the experiments discussed here, you need to know the exact directions from your place of observation. The place of observation should be a open place with level ground. Finding the north using a compass cannot be considered as very accurate as the direction of the earth’s magnetic poles are not aligned with the Earth’s rotational axis
Projections are an essentials part of every datasets. Basically, a projection is the mathematical operation needed to go from the planet actual shape to a flat map according to the Geographic Coordinate System.
Elevating Tactical DDD Patterns Through Object CalisthenicsDorra BARTAGUIZ
After immersing yourself in the blue book and its red counterpart, attending DDD-focused conferences, and applying tactical patterns, you're left with a crucial question: How do I ensure my design is effective? Tactical patterns within Domain-Driven Design (DDD) serve as guiding principles for creating clear and manageable domain models. However, achieving success with these patterns requires additional guidance. Interestingly, we've observed that a set of constraints initially designed for training purposes remarkably aligns with effective pattern implementation, offering a more ‘mechanical’ approach. Let's explore together how Object Calisthenics can elevate the design of your tactical DDD patterns, offering concrete help for those venturing into DDD for the first time!
Securing your Kubernetes cluster_ a step-by-step guide to success !KatiaHIMEUR1
Today, after several years of existence, an extremely active community and an ultra-dynamic ecosystem, Kubernetes has established itself as the de facto standard in container orchestration. Thanks to a wide range of managed services, it has never been so easy to set up a ready-to-use Kubernetes cluster.
However, this ease of use means that the subject of security in Kubernetes is often left for later, or even neglected. This exposes companies to significant risks.
In this talk, I'll show you step-by-step how to secure your Kubernetes cluster for greater peace of mind and reliability.
State of ICS and IoT Cyber Threat Landscape Report 2024 previewPrayukth K V
The IoT and OT threat landscape report has been prepared by the Threat Research Team at Sectrio using data from Sectrio, cyber threat intelligence farming facilities spread across over 85 cities around the world. In addition, Sectrio also runs AI-based advanced threat and payload engagement facilities that serve as sinks to attract and engage sophisticated threat actors, and newer malware including new variants and latent threats that are at an earlier stage of development.
The latest edition of the OT/ICS and IoT security Threat Landscape Report 2024 also covers:
State of global ICS asset and network exposure
Sectoral targets and attacks as well as the cost of ransom
Global APT activity, AI usage, actor and tactic profiles, and implications
Rise in volumes of AI-powered cyberattacks
Major cyber events in 2024
Malware and malicious payload trends
Cyberattack types and targets
Vulnerability exploit attempts on CVEs
Attacks on counties – USA
Expansion of bot farms – how, where, and why
In-depth analysis of the cyber threat landscape across North America, South America, Europe, APAC, and the Middle East
Why are attacks on smart factories rising?
Cyber risk predictions
Axis of attacks – Europe
Systemic attacks in the Middle East
Download the full report from here:
https://sectrio.com/resources/ot-threat-landscape-reports/sectrio-releases-ot-ics-and-iot-security-threat-landscape-report-2024/
Accelerate your Kubernetes clusters with Varnish CachingThijs Feryn
A presentation about the usage and availability of Varnish on Kubernetes. This talk explores the capabilities of Varnish caching and shows how to use the Varnish Helm chart to deploy it to Kubernetes.
This presentation was delivered at K8SUG Singapore. See https://feryn.eu/presentations/accelerate-your-kubernetes-clusters-with-varnish-caching-k8sug-singapore-28-2024 for more details.
Neuro-symbolic is not enough, we need neuro-*semantic*Frank van Harmelen
Neuro-symbolic (NeSy) AI is on the rise. However, simply machine learning on just any symbolic structure is not sufficient to really harvest the gains of NeSy. These will only be gained when the symbolic structures have an actual semantics. I give an operational definition of semantics as “predictable inference”.
All of this illustrated with link prediction over knowledge graphs, but the argument is general.
Builder.ai Founder Sachin Dev Duggal's Strategic Approach to Create an Innova...Ramesh Iyer
In today's fast-changing business world, Companies that adapt and embrace new ideas often need help to keep up with the competition. However, fostering a culture of innovation takes much work. It takes vision, leadership and willingness to take risks in the right proportion. Sachin Dev Duggal, co-founder of Builder.ai, has perfected the art of this balance, creating a company culture where creativity and growth are nurtured at each stage.
Smart TV Buyer Insights Survey 2024 by 91mobiles.pdf91mobiles
91mobiles recently conducted a Smart TV Buyer Insights Survey in which we asked over 3,000 respondents about the TV they own, aspects they look at on a new TV, and their TV buying preferences.
Dev Dives: Train smarter, not harder – active learning and UiPath LLMs for do...UiPathCommunity
💥 Speed, accuracy, and scaling – discover the superpowers of GenAI in action with UiPath Document Understanding and Communications Mining™:
See how to accelerate model training and optimize model performance with active learning
Learn about the latest enhancements to out-of-the-box document processing – with little to no training required
Get an exclusive demo of the new family of UiPath LLMs – GenAI models specialized for processing different types of documents and messages
This is a hands-on session specifically designed for automation developers and AI enthusiasts seeking to enhance their knowledge in leveraging the latest intelligent document processing capabilities offered by UiPath.
Speakers:
👨🏫 Andras Palfi, Senior Product Manager, UiPath
👩🏫 Lenka Dulovicova, Product Program Manager, UiPath
JMeter webinar - integration with InfluxDB and GrafanaRTTS
Watch this recorded webinar about real-time monitoring of application performance. See how to integrate Apache JMeter, the open-source leader in performance testing, with InfluxDB, the open-source time-series database, and Grafana, the open-source analytics and visualization application.
In this webinar, we will review the benefits of leveraging InfluxDB and Grafana when executing load tests and demonstrate how these tools are used to visualize performance metrics.
Length: 30 minutes
Session Overview
-------------------------------------------
During this webinar, we will cover the following topics while demonstrating the integrations of JMeter, InfluxDB and Grafana:
- What out-of-the-box solutions are available for real-time monitoring JMeter tests?
- What are the benefits of integrating InfluxDB and Grafana into the load testing stack?
- Which features are provided by Grafana?
- Demonstration of InfluxDB and Grafana using a practice web application
To view the webinar recording, go to:
https://www.rttsweb.com/jmeter-integration-webinar
LF Energy Webinar: Electrical Grid Modelling and Simulation Through PowSyBl -...DanBrown980551
Do you want to learn how to model and simulate an electrical network from scratch in under an hour?
Then welcome to this PowSyBl workshop, hosted by Rte, the French Transmission System Operator (TSO)!
During the webinar, you will discover the PowSyBl ecosystem as well as handle and study an electrical network through an interactive Python notebook.
PowSyBl is an open source project hosted by LF Energy, which offers a comprehensive set of features for electrical grid modelling and simulation. Among other advanced features, PowSyBl provides:
- A fully editable and extendable library for grid component modelling;
- Visualization tools to display your network;
- Grid simulation tools, such as power flows, security analyses (with or without remedial actions) and sensitivity analyses;
The framework is mostly written in Java, with a Python binding so that Python developers can access PowSyBl functionalities as well.
What you will learn during the webinar:
- For beginners: discover PowSyBl's functionalities through a quick general presentation and the notebook, without needing any expert coding skills;
- For advanced developers: master the skills to efficiently apply PowSyBl functionalities to your real-world scenarios.
Kubernetes & AI - Beauty and the Beast !?! @KCD Istanbul 2024Tobias Schneck
As AI technology is pushing into IT I was wondering myself, as an “infrastructure container kubernetes guy”, how get this fancy AI technology get managed from an infrastructure operational view? Is it possible to apply our lovely cloud native principals as well? What benefit’s both technologies could bring to each other?
Let me take this questions and provide you a short journey through existing deployment models and use cases for AI software. On practical examples, we discuss what cloud/on-premise strategy we may need for applying it to our own infrastructure to get it to work from an enterprise perspective. I want to give an overview about infrastructure requirements and technologies, what could be beneficial or limiting your AI use cases in an enterprise environment. An interactive Demo will give you some insides, what approaches I got already working for real.
Kubernetes & AI - Beauty and the Beast !?! @KCD Istanbul 2024
Lab two 2012 fall
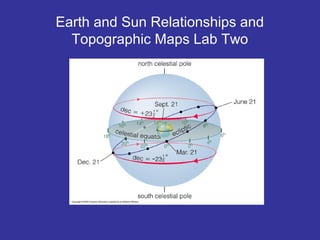
1. Earth and Sun Relationships and
Topographic Maps Lab Two
2. The first days of the seasons are solstices and
equinoxes. These are key periods within Earth-
Sun Relationships.
3. Subsolar Point
• This is the place on Earth where the suns’
angle is 90° and solar radiation strikes the
surface most directly.
– Earth’s axial tilt and it’s orbit cause the
subsolar point to move between 23.5° north
and 23.5° south over the course of a year.
4. Equinox and Solstice Conditions
• Equinox-when the subsolar point is at the
equator and all locations on the earth
experience equal hours of daylight and
darkness
• Solstice-when the sun angle is at 90° at
either end of the tropic boundaries.
– Topic of Cancer 23.5° N
– Tropic of Capricorn 23.5° S
5. Analemma
WHAT IS AN ANALEMMA?
An analemma is a natural pattern
traced out annually in the sky by the Sun.
6. Analema
• The analema is
the geographers
tool used to locate
the subsolar point,
or the point on
Earth’s surface
where the sun is
directly overhead
at noon.
• The analema can
be used for any
place on earth,
and any day of the
year.
7. • Due to the
earth's tilt on its
axis (23.5°) and
its elliptical orbit
around the sun,
the relative
location of the
sun above the
horizon is not
constant from
day to day when
observed at the
same time on
each day.
http://en.wikipedia.org/wiki/Analema
8. Using the Analemma
• The analemma can be
used to determine the
sun’s subsolar point for
any given date.
– For example: find October
10th on the analemma,
follow that point on the
analemma out to the right
edge of the grid and notice
that it is at 6° south.
• This means that on
October 10th, the subsolar
point is 6° south, in other
words 6° south is the
place on the Earth where
the sun’s rays are striking
at a 90° angle.
9. Using the Analemma
• The analemma is also uses to
determine what time the sun
reaches its zenith, or what time
noon is.
• Again, look at October 10th.
Follow that point to the top of
the grid.
• Notice that for October 10th, the
sun’s zenith is 12 minutes fast.
• This means that noon will be
12 minutes early on October
10th, so the sun will reach its
zenith at 11:48 AM.
10. Using the Analemma
• The
analemma
can also be
used to
determine the
angle that the
sun is hitting
ANY location
on earth for
any given
date.
11. Using the Analemma to Calculate the
Sun’s Declination or Angle of Incidence
1. Where are you calculating from? What is your
location?
2. Second you must determine the subsolar point for that
date.
3. If your two locations (your location and the subsolar
point) are in the same hemisphere, you will minus
those two latitudes.
4. If your two locations are in opposite hemispheres, then
you will add those two latitudes together.
5. The end result is your arc distance.
6. Once you have determined your arc distance, you
simply minus it by 90° in order to calculate the solar
altitude at your location.
12. Example
• Use the analemma to find the sun’s declination
(angle) for Los Angeles (34°N) on July 16.
– 1. Where: 34°N
– 2. Subsolar point July 16 = 21°N
– 3. Hemisphere: SAME!
– 4. 34° - 21° = 13°
– 5. 13° is your arc distance
– 6. 90 – 13 = 77°
• SO THAT MEANS THE SUN’S DECLINATION (ANGLE) IN
LOS ANGELES ON JULY 16TH IS 77°
13. Example
• Use the analemma to find the sun’s declination
(angle) for Los Angeles (34°N) on November 20.
– 1. Where: 34°N
– 2. Subsolar point Nov. 20 = 20°S
– 3. Hemisphere: OPPOSITE
– 4. 34° + 20° = 54°
– 5. 54° is your arc distance
– 6. 90 – 54 = 36°
• SO THAT MEANS THE SUN’S DECLINATION (ANGLE) IN
LOS ANGELES ON November 20TH IS 36°
15. http://vrum.chat.ru/Photo/Astro/analema.htm
It shows position of the Sun on the sky in the same time of a day during one year. Analemma - a trace of the annual
movement of the Sun on the sky - is well known among experts of sun-dials and old Earth's globes as a diagram of change of
seasons and an equation of time. Between August 30th 1998 and August 19th 1999 I have photographed the Sun 36 times
on a single frame of 60-mm film. The pictures were taken exactly at 5:45 UT (Universal time) of every tenth day.
16. Topographic Maps
• Topographic maps are large-
scale maps that use contour
lines to portray the elevation
and shape of the topography.
• Topographic maps show and
name both natural and human-
made features.
• The US Geological Survey
(USGS) is the principle
government agency that
provides topographic maps for
the United States.
– USGS topographic maps
cover the entire United
States at several different
scales.
17. Computing Distances with
Fractional Scales
• To determine distances
represented on a map by using
the fractional scale:
1. Use a ruler to measure the
distance on the map in inches
(or centimeters). This is the
measured distance.
2. Multiply the measured distance
by the map’s fractional scale
denominator. This will give you
the actual distance in inches (or
centimeters).
3. To convert your actual distance
in inches (or centimeters) to
other units, use the following
formulas:
18. Measuring Road Distance
• Look at the map scale.
– In the lower left or right
corner there will be a small
graph that shows a unit
that corresponds to the
distance on the map.
– For example, if the scale is
one inch long and is
labeled five miles, then one
inch on the map is equal to
five miles on the ground.
– Hold a ruler next to it and
measure it.
19. • Lay one end of string on one end of the road so that it
follows every curve as accurately as possible. If you
don’t have a string, tear a strip of paper and bend it
along the curves of the road.
• Hold the string or paper so that you pinch it where the
road begins and ends.
• Measure it with a ruler.
20. • Multiply the length of the string by the
scale.
• For example, if the string was 7 inches
long and each inch represents 5 miles, the
road is approximately 35 miles long.
21. • Look for small sequential
numbers next to the road
on the map.
• These numbers indicate
miles.
• On detailed maps, there
may be a marker every
mile, but on less detailed
maps it could be every 10
miles, or some other
scale.
22. • Find the number at the beginning of the
section of the road you’re driving and the
number at the end.
• If the numbers only show every several
miles, estimate the location.
• For example, if the road ends between 50
and 60 miles, call it 55.
23. • Subtract the lower number from the higher
number to get the total distance.
• For example, if the road starts a the 25
mile marker and ends at the 55 mile
marker, the total is 55 – 25 = 30 miles.
24. How to Use a Compass
• A compass can help you
navigate a forest, a sea,
or even a city. If you
have a compass and a
map, read on for
instructions on how to
figure out where you’re
currently heading, where
you need to head, or
where you already are.
http://www.wikihow.com/Use-a-Compass
25. Understand the basic layout of
compass.
• We’ll use a
baseplate compass
as an example, but
the same principles
apply with other
models.
26. Figure Out Where You’re Headed
1. Place the compass flat on your palm and your palm
in front of your chest. This is the proper compass
stance.
2. Move the compass until the direction of travel arrow
is pointing in the direction you wish to head. Unless
you’re heading north, the magnetic needle will spin off to
one side.
3. Twist the degree dial until the orienting arrow lines
up with the north end of the magnetic needle. Once
they are aligned, this will tell you where your direction of
travel arrow is pointing.
4. Take off local magnetic variation by twisting the
degree dial. This magnetic variation (i.e. the difference
between magnetic and true north) is known as declination
and is due to the fact that Earth’s magnetic field lines are
constantly moving relative to the actual North Pole. Since
our maps are all based off of true north, you must adjust
the compass to compensate. There are many web
27. Figure Out Where You’re Headed
5. See where the direction of travel arrow lines up with the degree
dial. This will tell you which direction you’re heading. For example, if
the arrow is between the S and the W, you’re heading southwest.
6. Transpose the direction of travel onto your map. Place your
map on a horizontal surface, then place the compass on the map so
that the orienting arrow points to true north on the map. Then, slide
your compass around so that its edge passes through your current
position (but its orienting arrow continues to point north).
7. Draw a line along the compass' edge and through your current
position. If you maintain this bearing, your path from your current
position will be along the line you just drew on your map.
28. Figure Out Where You’re Headed
8. Continue moving in this direction. To do so, simply hold the
compass in the proper stance, turn your body until the north end of
the magnetic needle once again aligns with the orienting needle,
and follow the direction of travel arrow. Check your compass as
often as you need to, but be sure not to accidentally twist the
degree dial from its current position.
– To accurately follow the direction of travel arrow, look down at the
arrow, then focus on a distant object to which it points (ex. tree,
telephone pole, etc.) and use this as a guide; however, don’t focus on
anything too distant (ex. mountain), as huge objects aren’t precise
enough to navigate by accurately. Once you reach each guide point,
use your compass to find another.
– If visibility is limited and you cannot see any distant objects, use
another member of your walking party (if applicable). Stand still, then
ask them to walk away from you in the direction indicated by the
direction of travel arrow. Call out to them to correct their direction as
they walk. When they approach the edge of visibility, ask them to wait
until you catch up. Repeat as necessary.
29. Figure Out Which Way You Need
to Head
• Place the map on a horizontal surface and place
your compass on the map. The magnetic needle won’t
work properly if held at an angle.
• Using the edge of the compass as a ruler, place it
so that it creates a line between your current
position and where you intend to go. You may also
want to draw this line on your map for future reference.
• Rotate the degree dial until the orienting arrow
points to true north on the map. This will also align
the compass’s orienting lines with the map’s north-south
lines. Once the degree dial is in place, put the map
away.
• Take off local magnetic variation by twisting the
degree dial.
30. Figure Out Which Way You Need
to Head
• Hold the compass horizontally in front of you with the direction of
travel arrow pointing away from you. Eventually, you’ll use the direction
of travel arrow to guide you to your destination.
• Turn your body until the north end of the magnetic needle aligns with
the orienting needle. You are now properly oriented toward your mapped
destination.
• Follow the direction of travel arrow. Look down at the arrow, then focus
on a distant object to which it points (ex. tree, telephone pole, etc.) and use
this as a guide; however, don’t focus on anything too distant (ex. mountain),
as huge objects aren’t precise enough to navigate by accurately. Once you
reach each guide point, use your compass to find another.
– If visibility is limited and you cannot see any distant objects, use another member
of your walking party (if applicable). Stand still, then ask them to walk away from
you in the direction indicated by the direction of travel arrow. Call out to them to
correct their direction as they walk. When they approach the edge of visibility,
ask them to wait until you catch up. Repeat as necessary.
31. Figure Out Your Current Position
Via Landmarks
• Choose 3 prominent landmarks that you can both
see and find on your map. These should be as
widely spread around your field of view as possible.
• Aim the compass' direction of travel arrow at the
first landmark. Unless the landmark is north of you,
the magnetic needle will spin off to one side.
• Twist the degree dial until the orienting arrow
lines up with the north end of the magnetic needle.
Once they are aligned, this will tell you where your
direction of travel arrow is pointing.
• Take off local magnetic variation] by twisting the
degree dial.
32. Figure Out Your Current Position
Via Landmarks
• See where the direction of travel arrow lines up with the degree dial. This will tell
you which direction you’re heading. For example, if the arrow is between the S and
the W, you’re heading southwest.
• Transpose the direction of the landmark onto your map. Place your map on a
horizontal surface and then place the compass on the map so that the orienting arrow
points to true north on the map. Then, slide your compass around so that its edge
passes through the landmark on the map (but its orienting arrow continues to point
north).
• Draw a line along the compass' edge and through your approximate position.
This is the first of three lines you will draw to triangulate your position.
• Repeat steps 2 through 7 for the other two landmarks. When you’re done, you will
have three lines that form a triangle on your map. Your position is inside this triangle,
the size of which depends on the accuracy of your bearings. (More accurate bearings
reduce the size of the triangle and, with lots of practice, you may get the lines to
intersect at one point.)
33. Compass Tips
• The compass's tips are usually marked with either red or black tips. The northern tip is usually
marked with an N, but if for some reason it isn’t, try to figure out which one is north by orienting
your compass to the north or south in relation to the sun.
• For maximum accuracy, hold the compass up to your eye and look down the direction of travel
arrow to find landmarks, guide points, etc.
• You can also hold the compass square to your body by holding the sides of the baseplate
between both hands (making L shapes with your thumbs) and keeping your elbows against your
sides. Stand facing your objective, look straight ahead, and square yourself with the object by
which you are taking your bearing. The imaginary line extending out from your body will travel
through your compass along the direction of travel arrow. You can even rest your thumbs
(against which the end of the compass is resting) against your stomach to steady your hold. Just
be sure you aren't wearing a big steel belt buckle or some other magnetic material close to the
compass when doing this.
• Magnetic (as opposed to true) north is currently around northern Canada, which means that
magnetic deviation changes depending on where you are in the world. Many compasses have a
means by which you can adjust for magnetic declination: either on the fly (by using a declination
scale inscribed on the baseplate) or semi-permanently (by adjusting the compass housing within
the baseplate. Read your instruction manual for instructions geared toward your compass.
• It's often easier to use features in your immediate vicinity to locate your precise position.
Triangulation is more useful if you're really lost or you are in a barren, featureless area.
• Trust your compass: 99.9% of the time it is giving you the correct direction. Many landscapes
look similar, so again, TRUST YOUR COMPASS.
35. What is GPS Technology?
The Global Positioning System (GPS) is a
satellite-based navigation system made up of a
network of 24 satellites placed into orbit by
the U.S. Department of Defense. GPS was
originally intended for military applications,
but in the 1980s, the government made the
system available for civilian use. GPS works in
any weather conditions, anywhere in the
world, 24 hours a day. There are no
subscription fees or setup charges to use GPS.
36. GPS Development
GPS or the Global Positioning System was
invented by the U.S. Department of Defense
(D.O.D) and Ivan Getting, at the cost of
twelve billion taxpayer dollars. The Global
Positioning System is a satellite navigational
system, predominantly designed for
navigation. GPS is now gaining prominence
as a timing tool.
38. GPS Devices/Receiver.
A GPS receiver's job is to locate four or
more of these satellites, figure out the
distance to each, and use this information
to deduce its own location. This operation
is based on a simple mathematical principle
called trilateration.
39. GPS Devices/Receiver.
The use of Global Position System (GPS) has become
quite diverse from automobiles, mobile phones,
tourist facilities, city maps, and even pet collars. GPS
works through a network (often called constellation)
of 27 satellites that move around the Earth in geo
synchronous orbit. These satellites exchange
relative data to fix the position of one particular
object on the surface. Similar to the Internet, the
technology was original implemented for military
use in order to help precise control of troops as well
as getting accurate information about enemy troops
and armament placement and movement. And like
the Internet it was soon the commercial use that
would dominate global reliance on GPS.
40. GPS Devices/Receiver.
WHAT DOES A GPS RECEIVER DO?
A GPS receiver (GPSR) is a RECEIVER of radio
signals and it does not transmit anything to
anywhere. The GPSR provides, as its primary
function, the ability to locate your CURRENT
POSITION anywhere on the planet. Normally, it
can do this to an accuracy of perhaps 6 to 8 meters
with 95% certainty depending on obstructions to
the sky. Some models also have built in (or up
loadable) maps to allow you to view on the GPSr's
screen your current position. Also selected
models will receive WAAS corrections, resulting in
accuracies of 3 to 4m 95% of the time as shown
PROVIDED your are in the clear. WAAS is more
susceptible to tree cover than non-WAAS.
41. What can GPS do?
ESSENTIAL MAP READING SKILLS
Creating GPS technology that is readily
available; our younger generation is losing
the essential ability to read maps. With
any computer devise, all can have
problems that may cause the devise to
malfunction or break. If you are someone
who relies heavily on a devise that tells
you which route to take and it happens to
malfunction, you may not a map available
as an alternative.
42. Advantages / Disadvantages
Advantages:
-fast speed
-leads u in right direction
-helps improve mapping skills
-makes navigation easier
-has panic buttons built in
-you can be found easier if in danger or in accident
-plugs into your car cigarette lighter
Disadvantages:
-cellular devices can track other cellular device users
- not very cheap
-people focus on GPS more than road = accidents
-should be used as backup map but used as 1st resource
-needs good care and handling
-external power
-needs batteries (handheld ones)
If anyone has found more information please add on!!!!!!