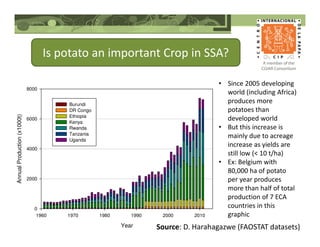
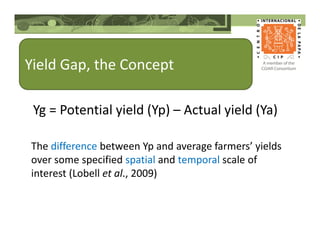
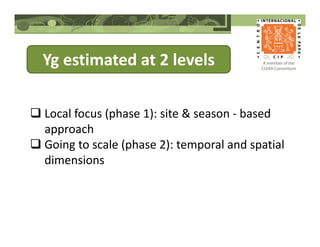
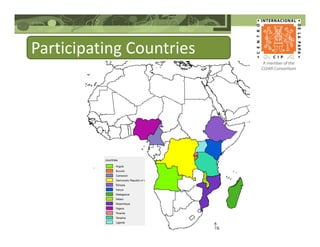
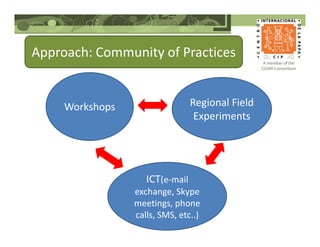
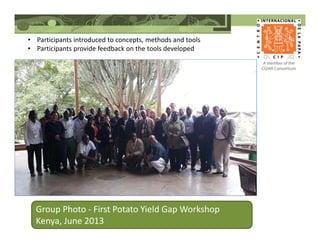
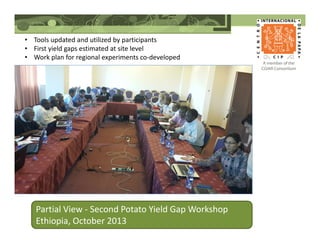
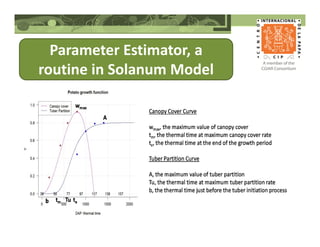
Potato yield gap analysis in SSA
through participatory modeling:
Optimizing the value of historical
breeding trial data
Dieudonné Harahagazwe et al.
International Potato Center
19th EAPR Conference, Brussels, Belgium
7 July 2014
Presentation Outline
1. Potato crop in the African context
2. The concept of yield gap
3. Work conducted so far and
preliminary results
4. What next
Is potato an important Crop in SSA?
Year
1960 1970 1980 1990 2000 2010
AnnualProduction(x1000t)
0
2000
4000
6000
8000
Burundi
DR Congo
Ethiopia
Kenya
Rwanda
Tanzania
Uganda
Source: D. Harahagazwe (FAOSTAT datasets)
• Since 2005 developing
world (including Africa)
produces more
potatoes than
developed world
• But this increase is
mainly due to acreage
increase as yields are
still low (< 10 t/ha)
• Ex: Belgium with
80,000 ha of potato
per year produces
more than half of total
production of 7 ECA
countries in this
graphic
Yield Gap, the Concept
The difference between Yp and average farmers’ yields
over some specified spatial and temporal scale of
interest (Lobell et al., 2009)
Yg = Potential yield (Yp) – Actual yield (Ya)
Yp analysis provides a measure of untapped
food production capacity
Also, knowledge of yield gaps (importance,
magnitudes and causes) helps in better
orienting investments in agricultural R&D as it
is a good management & decision tool for
improved resource-use efficiency (land,
fertilizers, water, etc..)
Examples of yield gaps at global
level (Neumann et al., 2010)
• Wheat and Rice: 36%
• Maize: 50 % (c. 80% in Africa)
Assessment of Yp and Yg
(Lobell et al., 2009)
3 methods:
1) Model simulations
2) Field experiments and yield contests
3) Historical maximum farmer yields
Participatory Potato Yield Gap
Analysis in SSA through a
Community of Practice (CoP)
Through
Partnership between CIP
and NARS and University
of Dschang (Cameroon)
And Funding from
Members of the CoP and co-authors
R. Quiroz, D. Harahagazwe, B.
Condori, C. Barreda, F. de
Mendiburu, A. Amele, D. Anthony,
E. Atieno, A. Bararyenya, A. A.
Byarugaba, P. Demo, J. Guerrero,
B. Kowalski, C. Lung'aho, V.
Mares, D. Mbiri, G. Mulugeta, B.
Nasona, A. Ngugi, J. Njeru, B.
Ochieng, J. Onditi, M. Parker, J. M.
Randrianaivoarivony, E. Schulte-
Geldermann, C. M. Tankou, G.
Woldegiorgis and A. WorkuCoP
0 1 2
Yearsofexperience
0
5
10
15
20
25
30
35
Mean
Objective of the study
Develop methods and tools that could be used to
determine what potato growers in developing
countries in general and in SSA in particular are
losing and/or could achieve.
Yg estimated at 2 levels
Local focus (phase 1): site & season - based
approach
Going to scale (phase 2): temporal and spatial
dimensions
Participating Countries
Approach: Community of Practices
Workshops Regional Field
Experiments
ICT(e-mail
exchange, Skype
meetings, phone
calls, SMS, etc..)
Group Photo - First Potato Yield Gap Workshop
Kenya, June 2013
• Participants introduced to concepts, methods and tools
• Participants provide feedback on the tools developed
Partial View - Second Potato Yield Gap Workshop
Ethiopia, October 2013
• Tools updated and utilized by participants
• First yield gaps estimated at site level
• Work plan for regional experiments co-developed
Parameter Estimator, a
routine in Solanum Model
Free download:
http://inrm.cip.cgiar.org/home/downmod.htm
Key Findings
Site
R
wegura
Fongo-TongoM
ulungu
Adet1
Adet2
TigoniKabukuKabete1Kabete2Antsirabe
Sussundenga
Kuru
KalengyereSuyianM
arigat
Bem
beke
TuberYield(t/ha)
0
10
20
30
40
50
60
70
Yield Simulated on Potential conditions
Yield Observed in experiment
Average yield
Yield Type
TuberYield(t/ha)
0
10
20
30
40
50
60
70
Yield Simulated on Potential conditions
Yield Observed in experiment
Average yield
Yield gap
Way forward
Regional experiments: going on in 8 countries
(Burundi, Cameroon, Democratic Republic of
Congo, Ethiopia, Kenya, Mozambique,
Tanzania and Uganda)
Model validation
Multi-year analysis versus projected climate
change
Spatial analysis
References
FAOSTAT. 2013. URL: http://faostat3.fao.org/home/index.html
GYGA. 2013. Global Yield Gap Atlas web site. URL: http://www.yieldgap.org/
Lobell, D.B., Cassman, K.G., Field, C.B. 2009. Crop Yield gaps: their
importance, magnitudes, and causes. Ann. Rev. Environ. Resour. 34, 179-
204.
Neumann, K., Verburg, P.H., Stehfest, E., Müller, C. 2010. The yield gap of
global grain production: a spatial analysis. Agric. Syst. 103, 316-326.
Tilman, D., Fargione, J., Wolf, B., D’Antonio, C., Dobson, A., Howarth, R.,
Schindler, D., Schlesinger, W.H., Simberloff, D. & Swackhammer, D. 2001.
Forecasting agriculturally driven global environmental change. Science, 292,
281-284.
Licker et. Al. 2010. Mind the gap: how do climate and agricultural
management explain the ‘yield gap’ of croplands around the world? Global
Ecol. Biogeogr. (19) 769 – 782.
THANK YOU

Eapr2014 participatory modeling_potato_yield_gap_ssa

  • 1.
    Potato yield gapanalysis in SSA through participatory modeling: Optimizing the value of historical breeding trial data Dieudonné Harahagazwe et al. International Potato Center 19th EAPR Conference, Brussels, Belgium 7 July 2014
  • 2.
    Presentation Outline 1. Potatocrop in the African context 2. The concept of yield gap 3. Work conducted so far and preliminary results 4. What next
  • 3.
    Is potato animportant Crop in SSA? Year 1960 1970 1980 1990 2000 2010 AnnualProduction(x1000t) 0 2000 4000 6000 8000 Burundi DR Congo Ethiopia Kenya Rwanda Tanzania Uganda Source: D. Harahagazwe (FAOSTAT datasets) • Since 2005 developing world (including Africa) produces more potatoes than developed world • But this increase is mainly due to acreage increase as yields are still low (< 10 t/ha) • Ex: Belgium with 80,000 ha of potato per year produces more than half of total production of 7 ECA countries in this graphic
  • 4.
    Yield Gap, theConcept The difference between Yp and average farmers’ yields over some specified spatial and temporal scale of interest (Lobell et al., 2009) Yg = Potential yield (Yp) – Actual yield (Ya)
  • 5.
    Yp analysis providesa measure of untapped food production capacity Also, knowledge of yield gaps (importance, magnitudes and causes) helps in better orienting investments in agricultural R&D as it is a good management & decision tool for improved resource-use efficiency (land, fertilizers, water, etc..)
  • 6.
    Examples of yieldgaps at global level (Neumann et al., 2010) • Wheat and Rice: 36% • Maize: 50 % (c. 80% in Africa)
  • 7.
    Assessment of Ypand Yg (Lobell et al., 2009) 3 methods: 1) Model simulations 2) Field experiments and yield contests 3) Historical maximum farmer yields
  • 8.
    Participatory Potato YieldGap Analysis in SSA through a Community of Practice (CoP) Through Partnership between CIP and NARS and University of Dschang (Cameroon) And Funding from
  • 9.
    Members of theCoP and co-authors R. Quiroz, D. Harahagazwe, B. Condori, C. Barreda, F. de Mendiburu, A. Amele, D. Anthony, E. Atieno, A. Bararyenya, A. A. Byarugaba, P. Demo, J. Guerrero, B. Kowalski, C. Lung'aho, V. Mares, D. Mbiri, G. Mulugeta, B. Nasona, A. Ngugi, J. Njeru, B. Ochieng, J. Onditi, M. Parker, J. M. Randrianaivoarivony, E. Schulte- Geldermann, C. M. Tankou, G. Woldegiorgis and A. WorkuCoP 0 1 2 Yearsofexperience 0 5 10 15 20 25 30 35 Mean
  • 10.
    Objective of thestudy Develop methods and tools that could be used to determine what potato growers in developing countries in general and in SSA in particular are losing and/or could achieve.
  • 11.
    Yg estimated at2 levels Local focus (phase 1): site & season - based approach Going to scale (phase 2): temporal and spatial dimensions
  • 12.
  • 13.
    Approach: Community ofPractices Workshops Regional Field Experiments ICT(e-mail exchange, Skype meetings, phone calls, SMS, etc..)
  • 14.
    Group Photo -First Potato Yield Gap Workshop Kenya, June 2013 • Participants introduced to concepts, methods and tools • Participants provide feedback on the tools developed
  • 15.
    Partial View -Second Potato Yield Gap Workshop Ethiopia, October 2013 • Tools updated and utilized by participants • First yield gaps estimated at site level • Work plan for regional experiments co-developed
  • 16.
  • 17.
  • 18.
  • 19.
    Yield Type TuberYield(t/ha) 0 10 20 30 40 50 60 70 Yield Simulatedon Potential conditions Yield Observed in experiment Average yield Yield gap
  • 20.
    Way forward Regional experiments:going on in 8 countries (Burundi, Cameroon, Democratic Republic of Congo, Ethiopia, Kenya, Mozambique, Tanzania and Uganda) Model validation Multi-year analysis versus projected climate change Spatial analysis
  • 21.
    References FAOSTAT. 2013. URL:http://faostat3.fao.org/home/index.html GYGA. 2013. Global Yield Gap Atlas web site. URL: http://www.yieldgap.org/ Lobell, D.B., Cassman, K.G., Field, C.B. 2009. Crop Yield gaps: their importance, magnitudes, and causes. Ann. Rev. Environ. Resour. 34, 179- 204. Neumann, K., Verburg, P.H., Stehfest, E., Müller, C. 2010. The yield gap of global grain production: a spatial analysis. Agric. Syst. 103, 316-326. Tilman, D., Fargione, J., Wolf, B., D’Antonio, C., Dobson, A., Howarth, R., Schindler, D., Schlesinger, W.H., Simberloff, D. & Swackhammer, D. 2001. Forecasting agriculturally driven global environmental change. Science, 292, 281-284. Licker et. Al. 2010. Mind the gap: how do climate and agricultural management explain the ‘yield gap’ of croplands around the world? Global Ecol. Biogeogr. (19) 769 – 782.
  • 22.