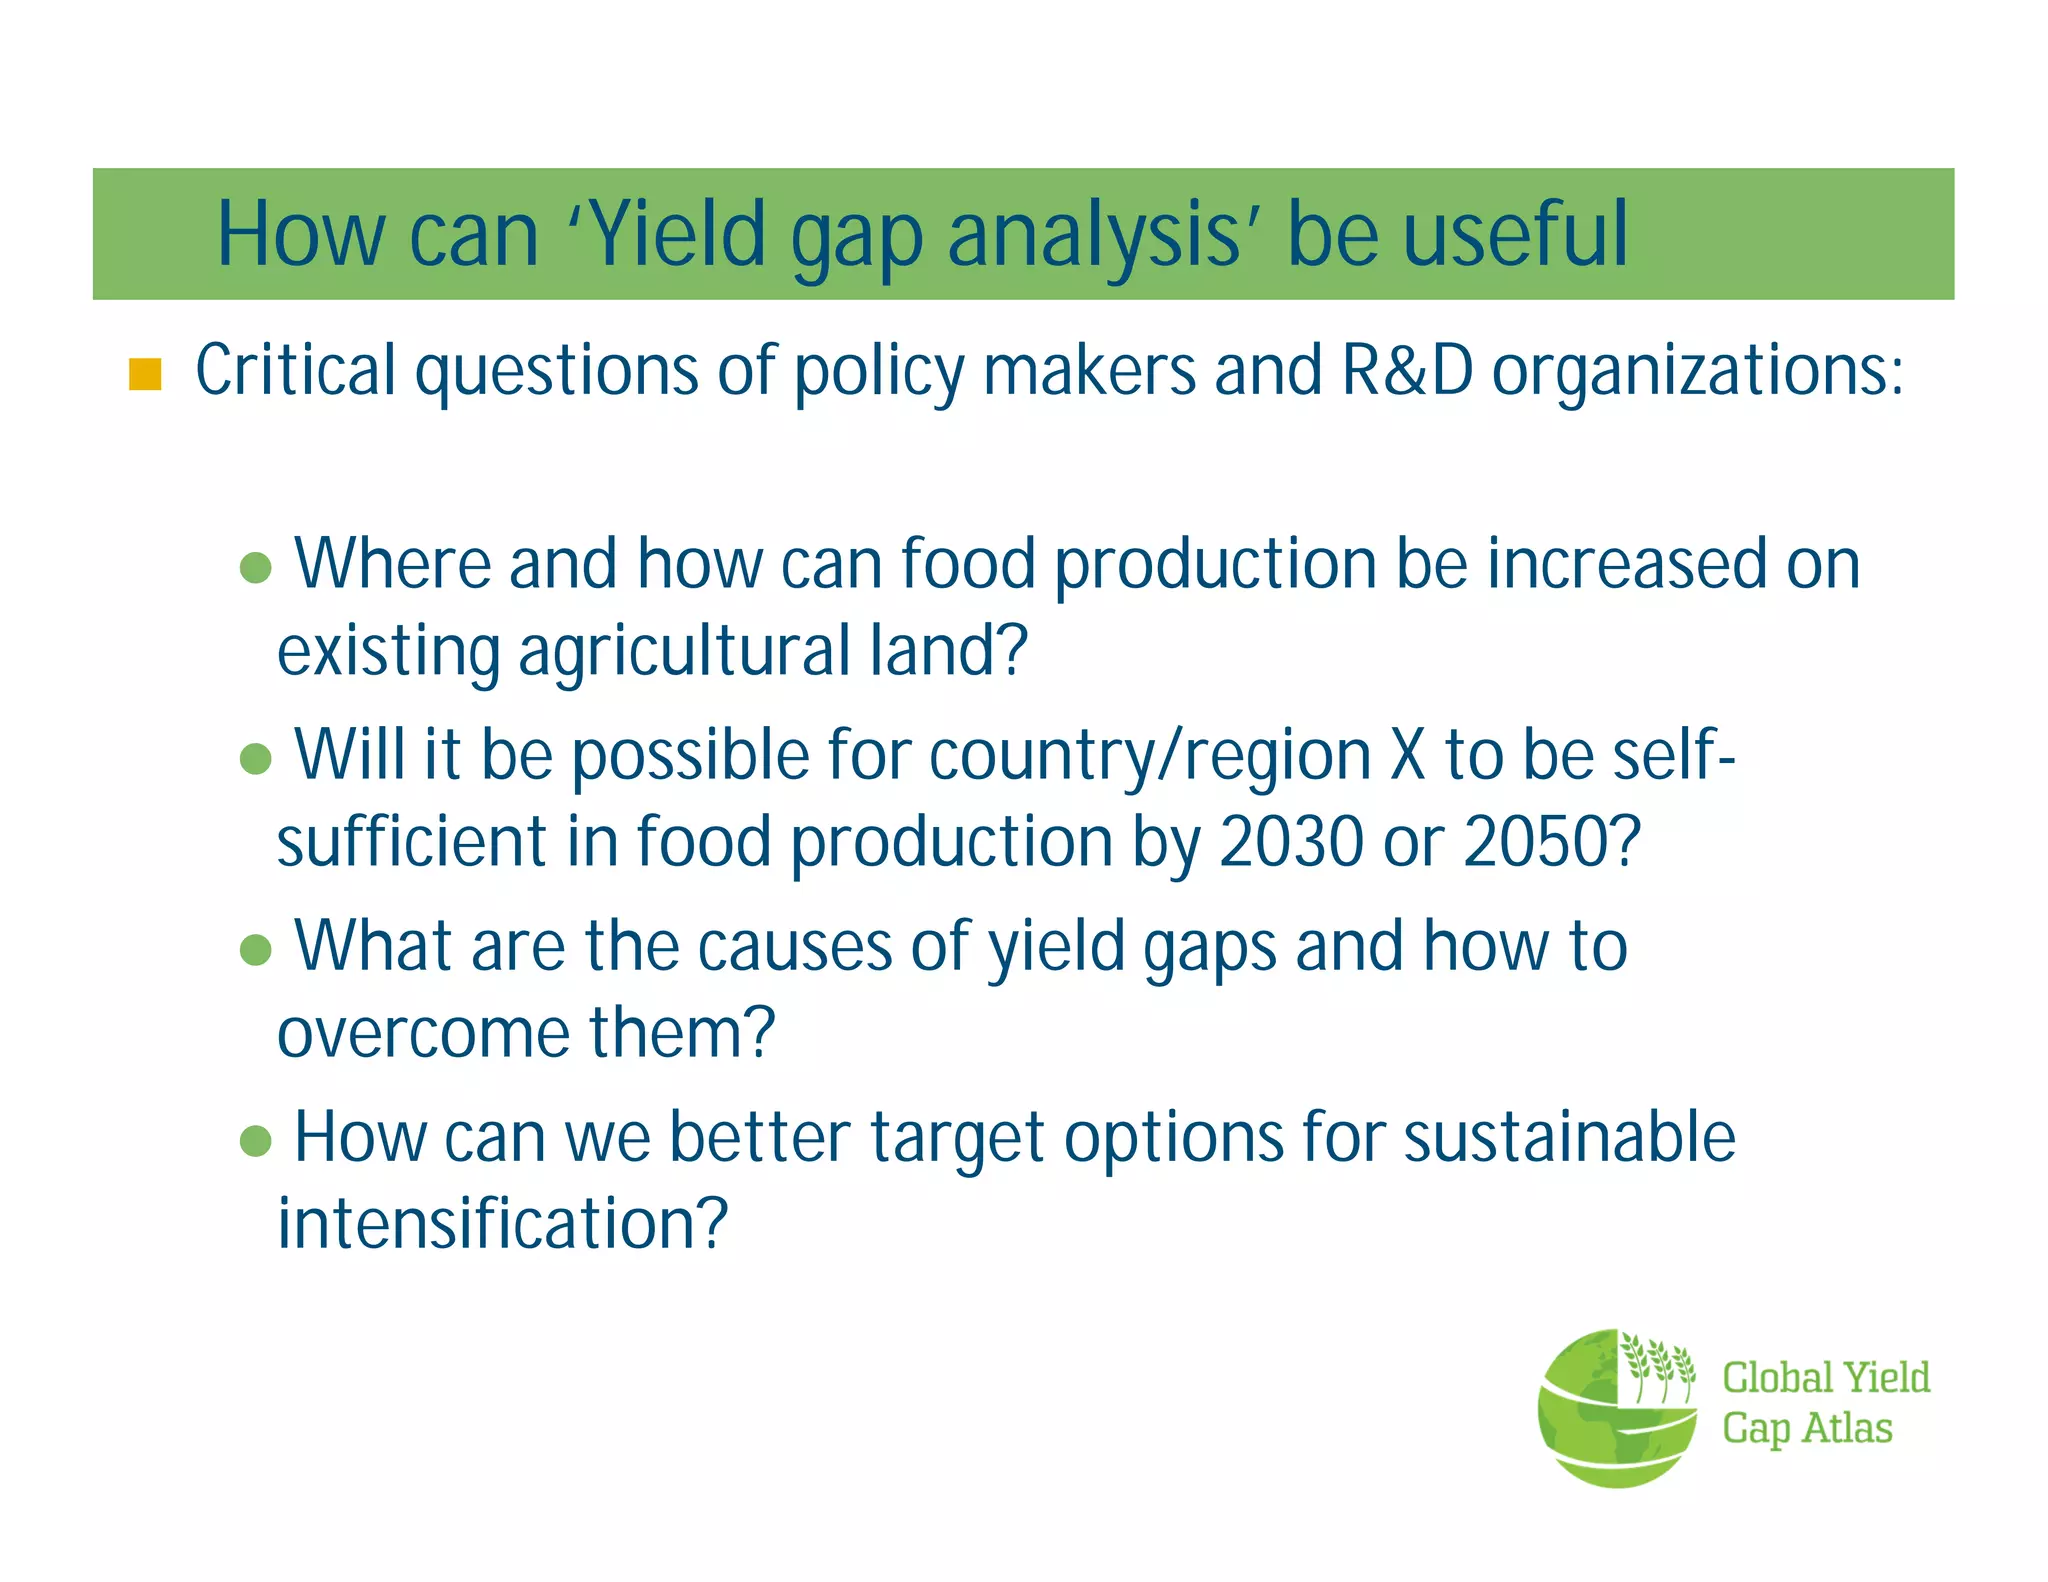
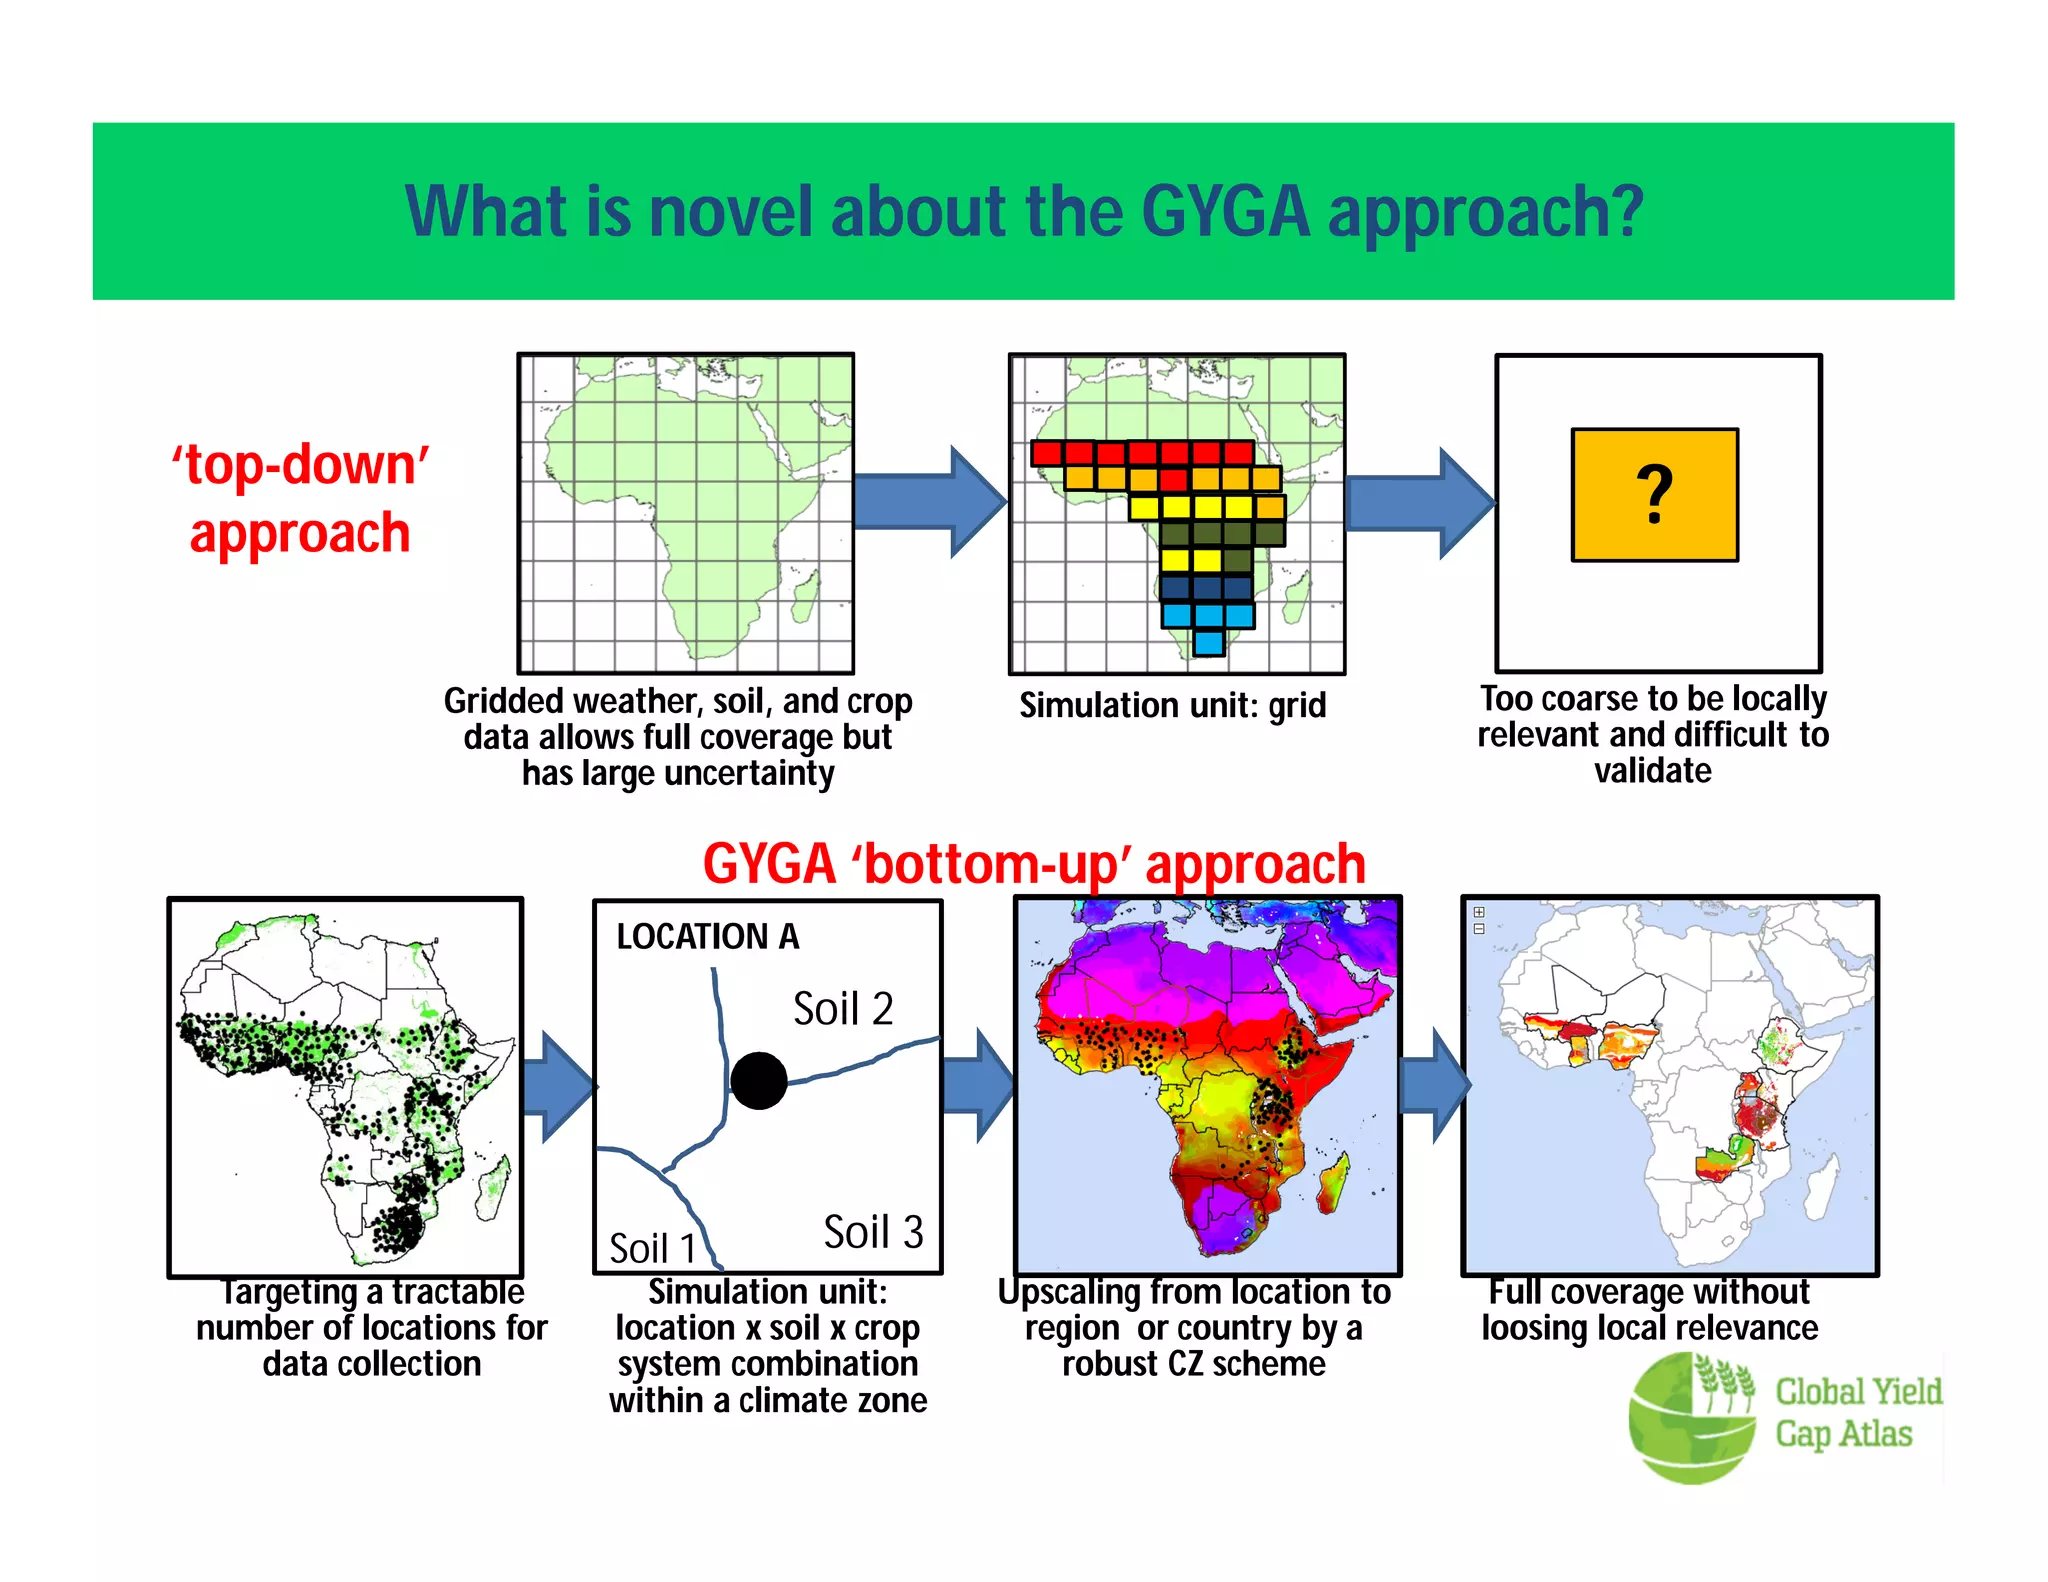
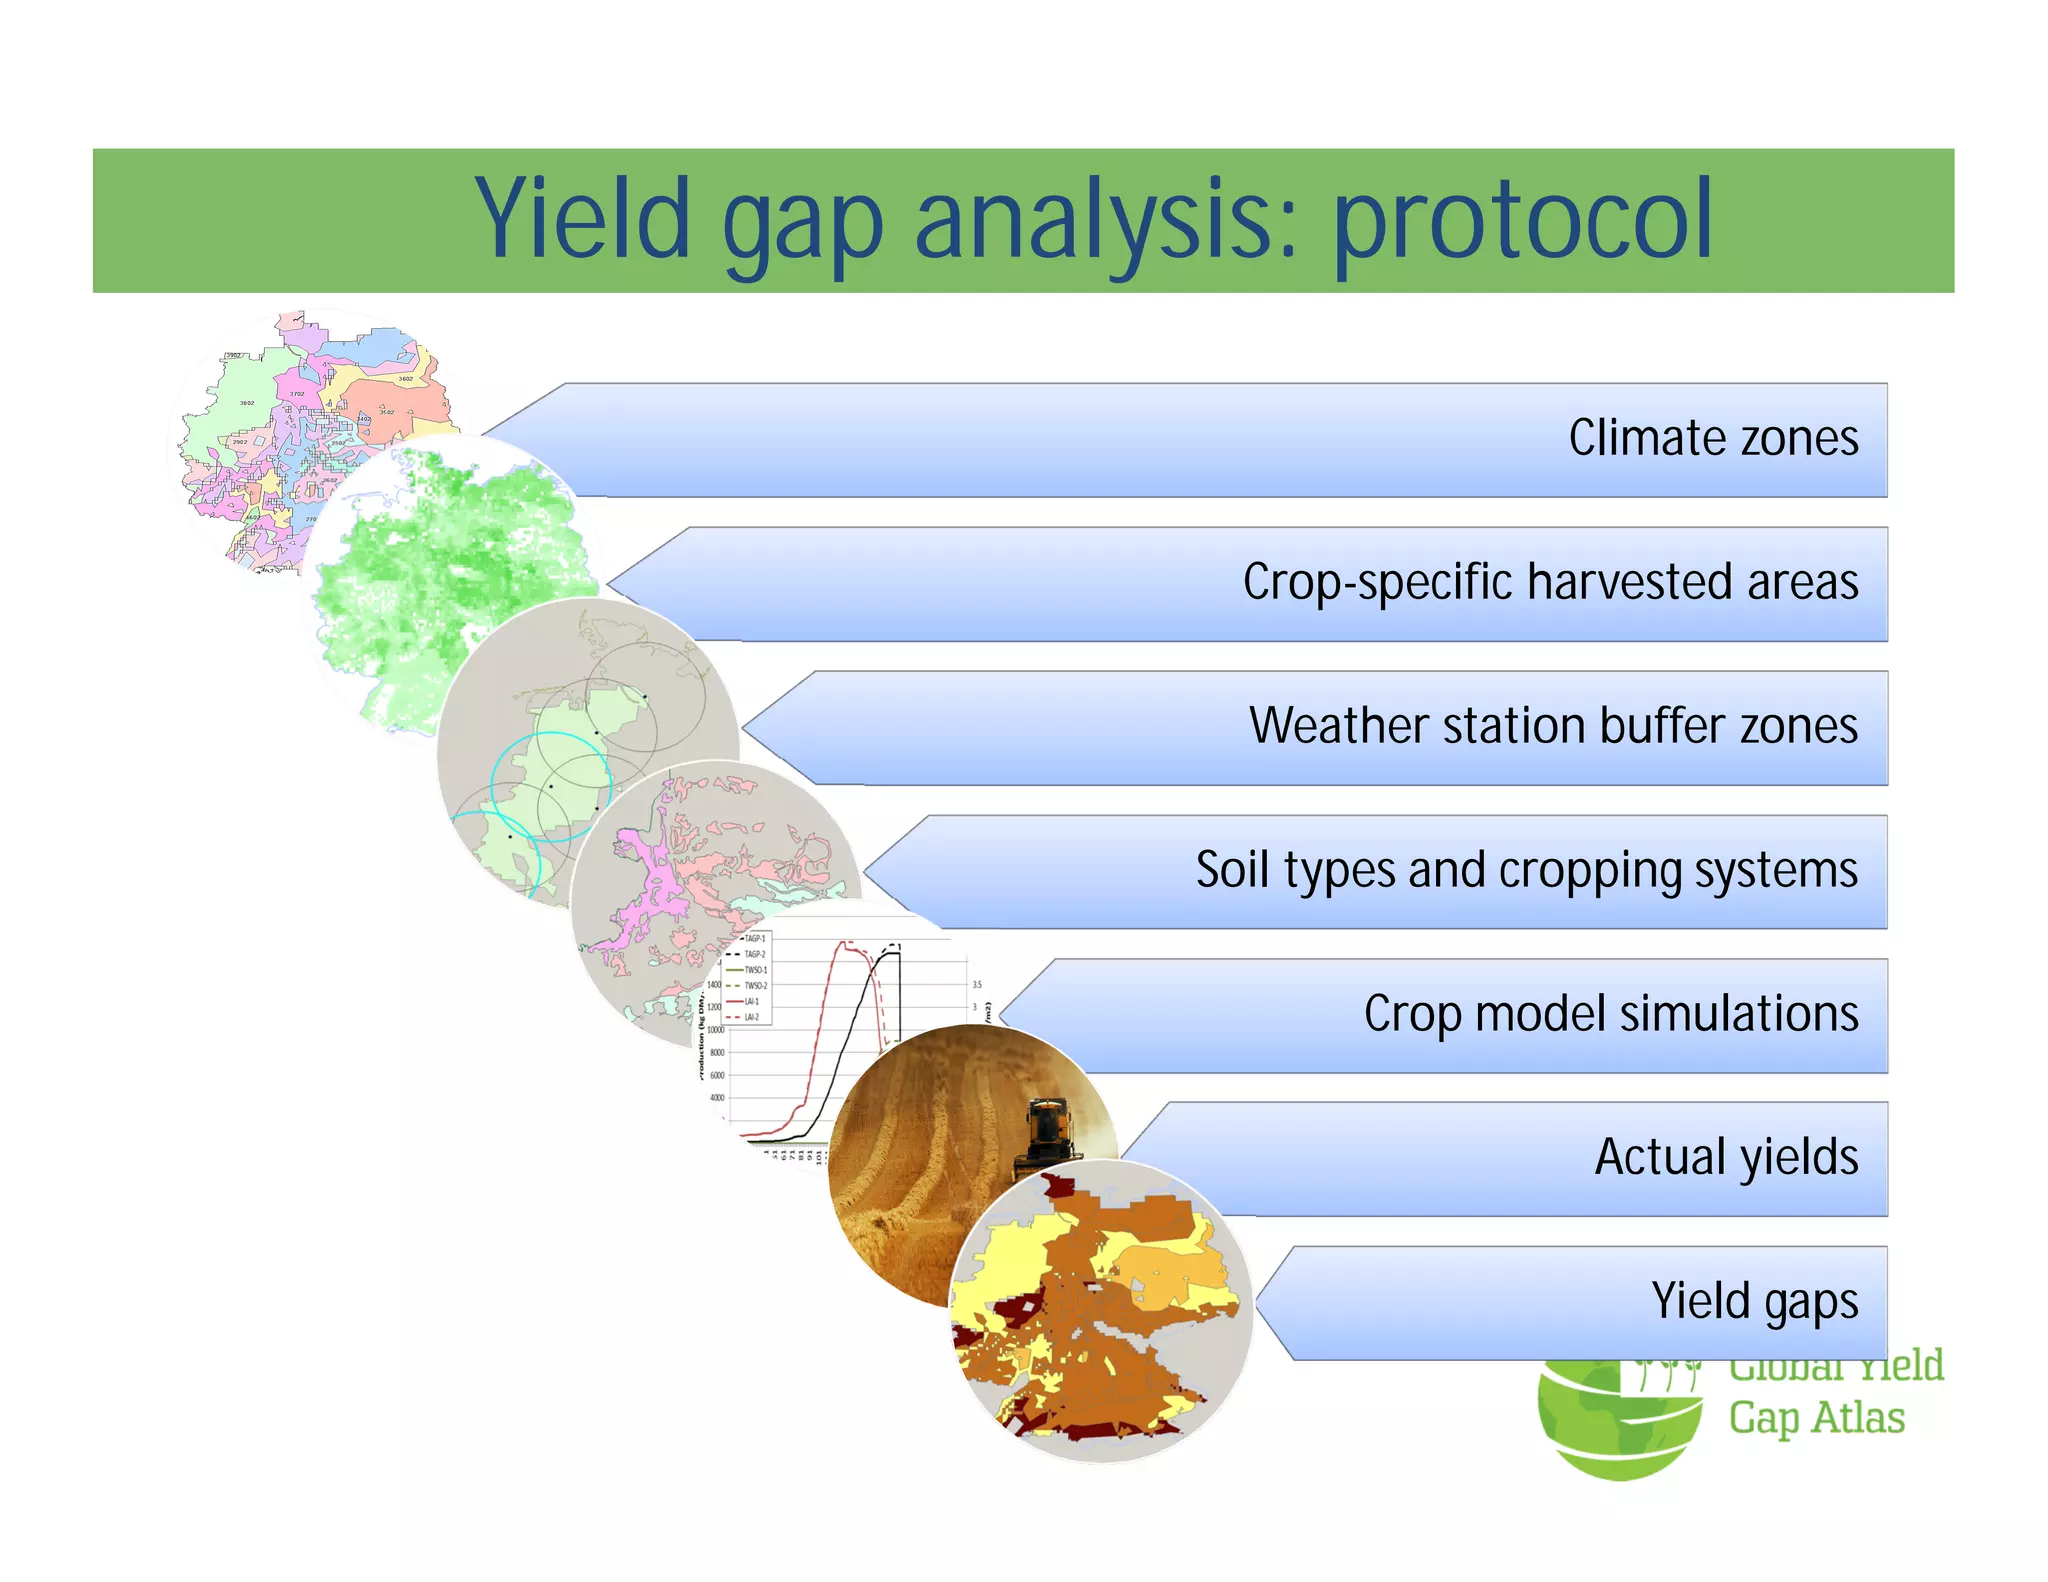
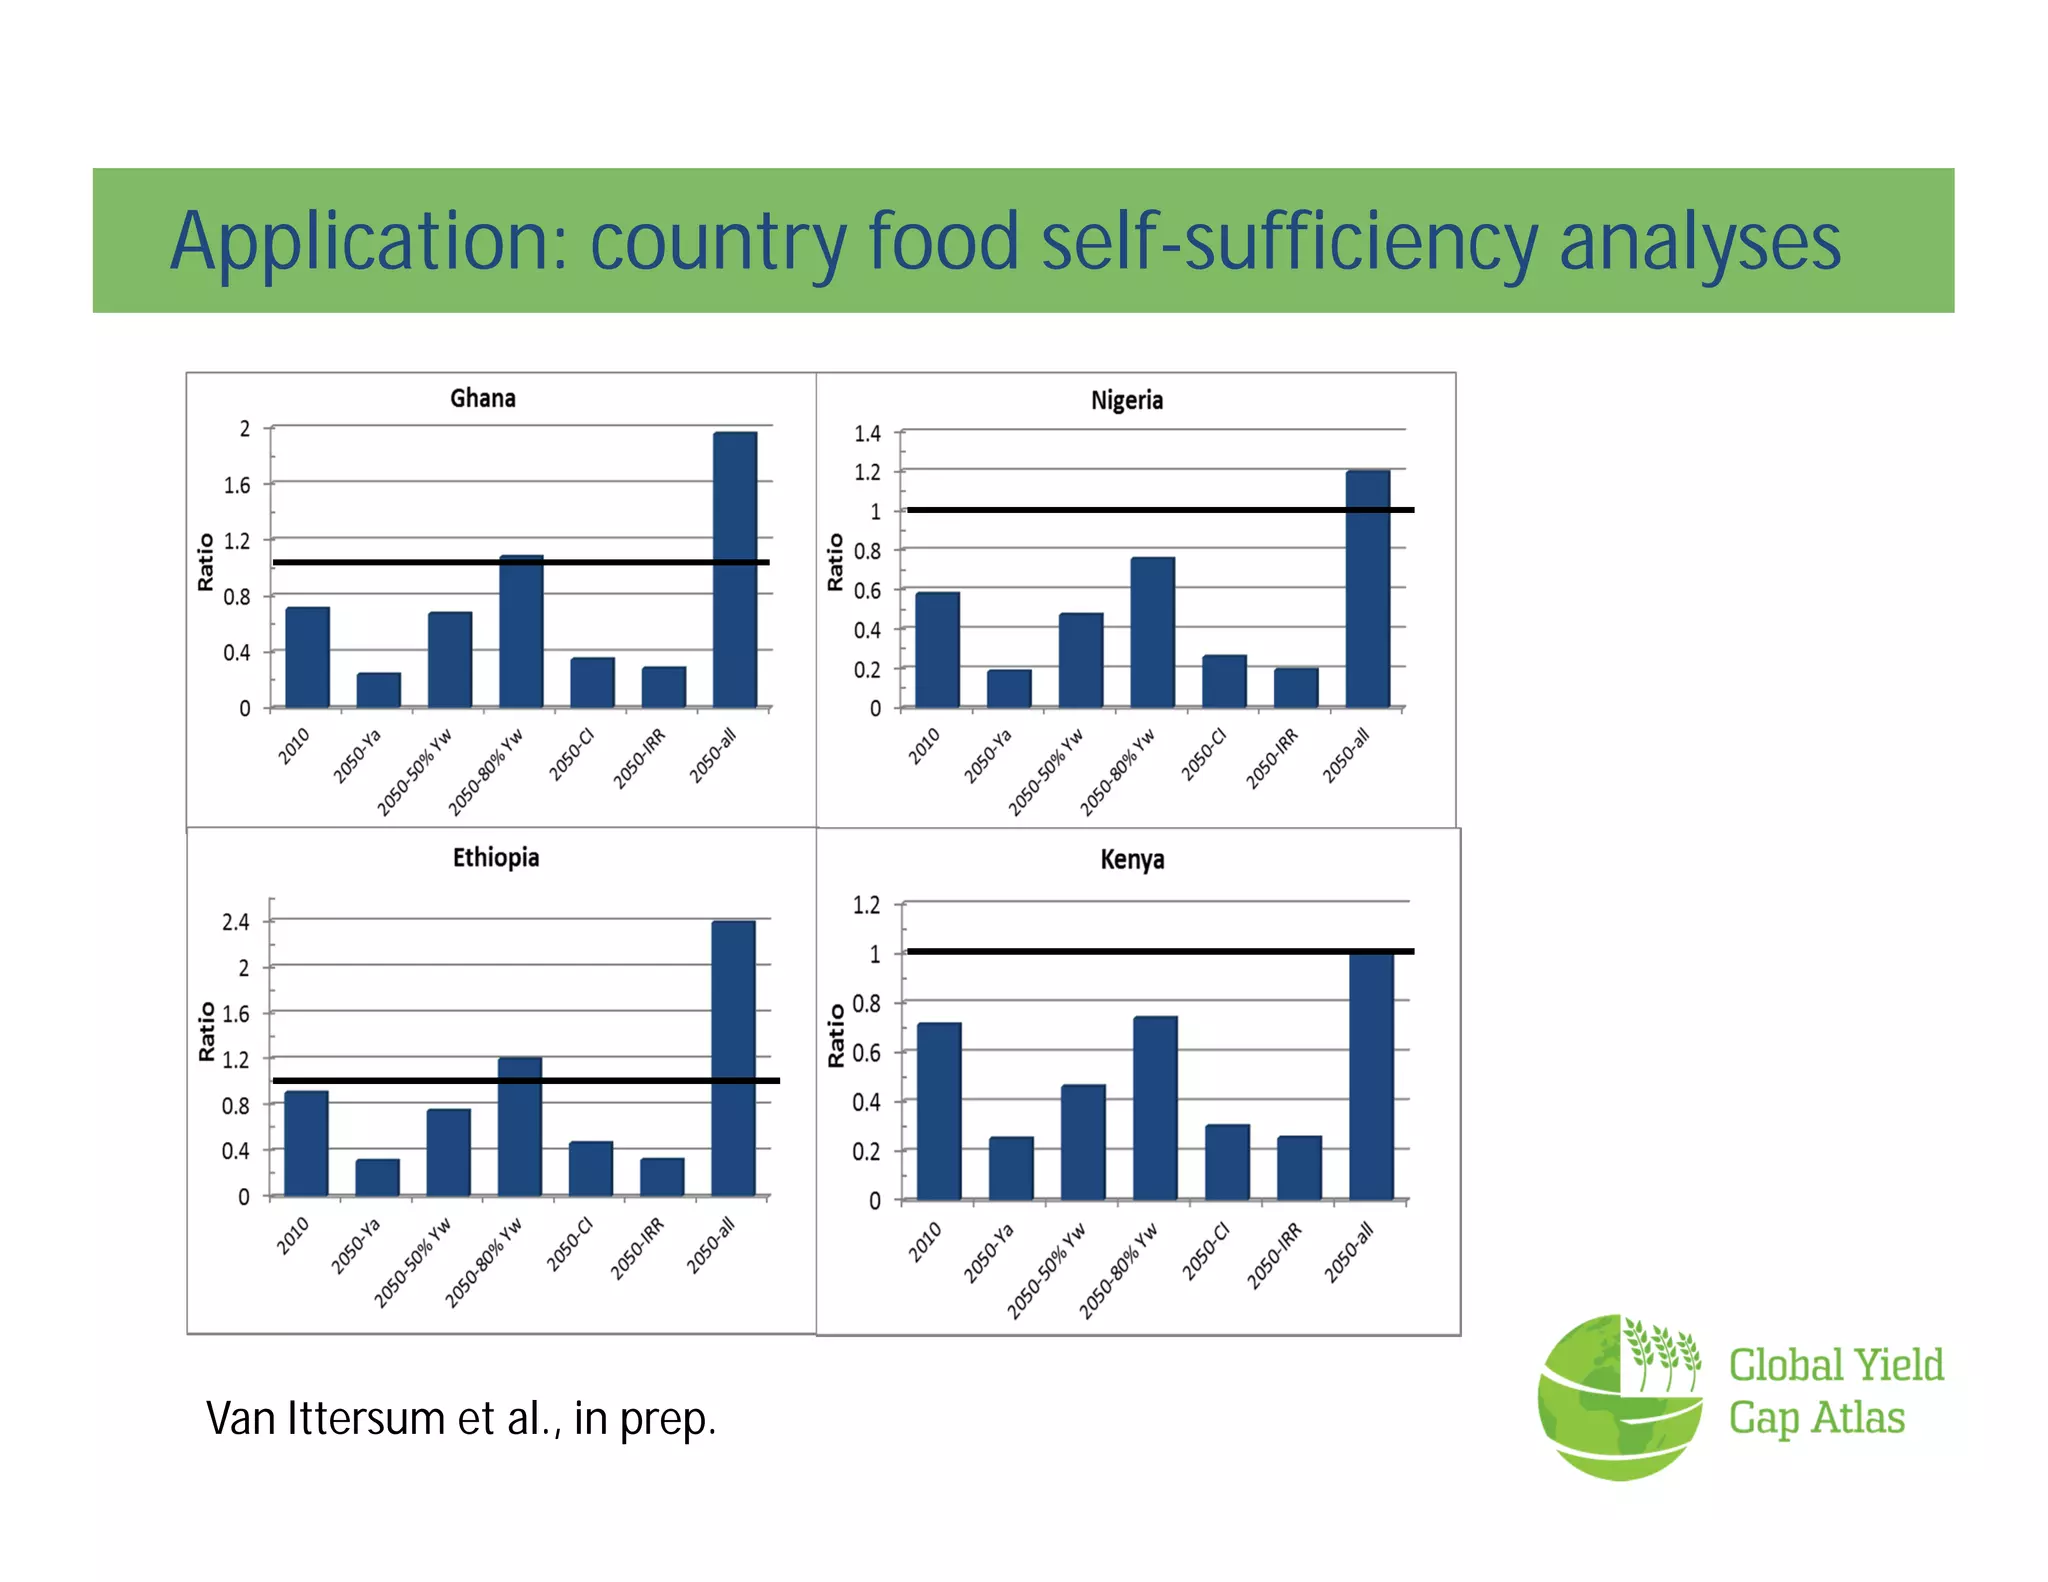
Global Yield Gap Atlas (GYGA)
www.yieldgap.org
How can ‘Yield gap analysis’ be useful
 Critical questions of policy makers and R&D organizations:
 Where and how can food production be increased on
existing agricultural land?
 Will it be possible for country/region X to be self-
sufficient in food production by 2030 or 2050?
 What are the causes of yield gaps and how to
overcome them?
 How can we better target options for sustainable
intensification?
What is novel about the GYGA approach?
‘top-down’
approach
Gridded weather, soil, and crop
data allows full coverage but
has large uncertainty
Simulation unit: grid
?
Too coarse to be locally
relevant and difficult to
validate
Targeting a tractable
number of locations for
data collection
Simulation unit:
location x soil x crop
system combination
within a climate zone
Upscaling from location to
region or country by a
robust CZ scheme
Soil 2
Soil 3Soil 1
LOCATION A
Full coverage without
loosing local relevance
GYGA ‘bottom-up’ approach
Soil 2
Yield gap analysis: protocol
Climate zones
Crop-specific harvested areas
Weather station buffer zones
Soil types and cropping systems
Crop model simulations
Actual yields
Yield gaps
Countries currently in the GYGA website
Completed (27)
In progress (19)
Likely additions (4)
Summary of GYGA outputs
 Interactive website with yield potential, yield gaps, and water
productivity for 8 major crops in 27 countries (46 soon)
• Open access to data
• Transparent, reproducible protocols
 Robust spatial framework based on climate zonation
 First high resolution digital map with functional soil properties
in SSA
 Novel protocols for propagating weather data, selection of data
sources, and crop modeling
 ~15 highly cited publications
Yield gaps in 10 countries in SSA
Application: GYGA technology extrapolation domains
• Targeting field research/experimentation
• Technology transfer and adoption at scale
• Research prioritization for R & D investments
• Ex-ante and ex-poste impact assessment
• Research on climate change impacts
Claessens et al., in prep.
Application: country food self-sufficiency analyses
Van Ittersum et al., in prep.
Objectives
• Significantly advance scientific capabilities for addressing complex
agricultural & food security issues in the context of climate change
• Integrated assessments (bio-physical, socio-economic) and ex ante
evaluation of adaptation practices & policies
• Global and regional scale levels
Two-Track Science Approach
Track 1: Model Improvement and Intercomparison
Track 2: Climate Change Multi-Model Assessment
Regional and Global Scales
Teams, Linkages and Outcomes
Capacity Building
and Decision Making
• Regional vulnerability
• Adaptation strategies
• Trade policy instruments
• Technology exchange
Climate Team
Crop Modeling Team
Economics Team
Information
Technology
Team
Improvements and
Intercomparisons
• Crop models
• Agricultural economic models
• Scenario construction
• Aggregation methodologies
Cross-Cutting
Themes
• Uncertainty
• Aggregation and
Scaling
• Representative
Agricultural
Pathways
Assessments
• Regional
• Global
• Crop-specific
Work
Groups
• Soils
• Water
Resources
• Livestock
and
Grasslands
• Pests and
Diseases
Regional Integrated Assessments
• 4 regional projects in SSA, 4 in SA
• Impact assessment of climate change and adaptation
• Systems modeling: crops, livestock, climate, economics
• Multiple climate and socio-economic scenarios (RAPs)
• Stakeholder interactions along research pathway

How can ‘Yield gap analysis’ be useful :Global yield gap atlas (gyga)

  • 1.
    Global Yield GapAtlas (GYGA) www.yieldgap.org
  • 2.
    How can ‘Yieldgap analysis’ be useful  Critical questions of policy makers and R&D organizations:  Where and how can food production be increased on existing agricultural land?  Will it be possible for country/region X to be self- sufficient in food production by 2030 or 2050?  What are the causes of yield gaps and how to overcome them?  How can we better target options for sustainable intensification?
  • 3.
    What is novelabout the GYGA approach? ‘top-down’ approach Gridded weather, soil, and crop data allows full coverage but has large uncertainty Simulation unit: grid ? Too coarse to be locally relevant and difficult to validate Targeting a tractable number of locations for data collection Simulation unit: location x soil x crop system combination within a climate zone Upscaling from location to region or country by a robust CZ scheme Soil 2 Soil 3Soil 1 LOCATION A Full coverage without loosing local relevance GYGA ‘bottom-up’ approach Soil 2
  • 4.
    Yield gap analysis:protocol Climate zones Crop-specific harvested areas Weather station buffer zones Soil types and cropping systems Crop model simulations Actual yields Yield gaps
  • 5.
    Countries currently inthe GYGA website Completed (27) In progress (19) Likely additions (4)
  • 6.
    Summary of GYGAoutputs  Interactive website with yield potential, yield gaps, and water productivity for 8 major crops in 27 countries (46 soon) • Open access to data • Transparent, reproducible protocols  Robust spatial framework based on climate zonation  First high resolution digital map with functional soil properties in SSA  Novel protocols for propagating weather data, selection of data sources, and crop modeling  ~15 highly cited publications
  • 7.
    Yield gaps in10 countries in SSA
  • 8.
    Application: GYGA technologyextrapolation domains • Targeting field research/experimentation • Technology transfer and adoption at scale • Research prioritization for R & D investments • Ex-ante and ex-poste impact assessment • Research on climate change impacts Claessens et al., in prep.
  • 9.
    Application: country foodself-sufficiency analyses Van Ittersum et al., in prep.
  • 10.
    Objectives • Significantly advancescientific capabilities for addressing complex agricultural & food security issues in the context of climate change • Integrated assessments (bio-physical, socio-economic) and ex ante evaluation of adaptation practices & policies • Global and regional scale levels
  • 11.
    Two-Track Science Approach Track1: Model Improvement and Intercomparison Track 2: Climate Change Multi-Model Assessment Regional and Global Scales
  • 12.
    Teams, Linkages andOutcomes Capacity Building and Decision Making • Regional vulnerability • Adaptation strategies • Trade policy instruments • Technology exchange Climate Team Crop Modeling Team Economics Team Information Technology Team Improvements and Intercomparisons • Crop models • Agricultural economic models • Scenario construction • Aggregation methodologies Cross-Cutting Themes • Uncertainty • Aggregation and Scaling • Representative Agricultural Pathways Assessments • Regional • Global • Crop-specific Work Groups • Soils • Water Resources • Livestock and Grasslands • Pests and Diseases
  • 13.
    Regional Integrated Assessments •4 regional projects in SSA, 4 in SA • Impact assessment of climate change and adaptation • Systems modeling: crops, livestock, climate, economics • Multiple climate and socio-economic scenarios (RAPs) • Stakeholder interactions along research pathway