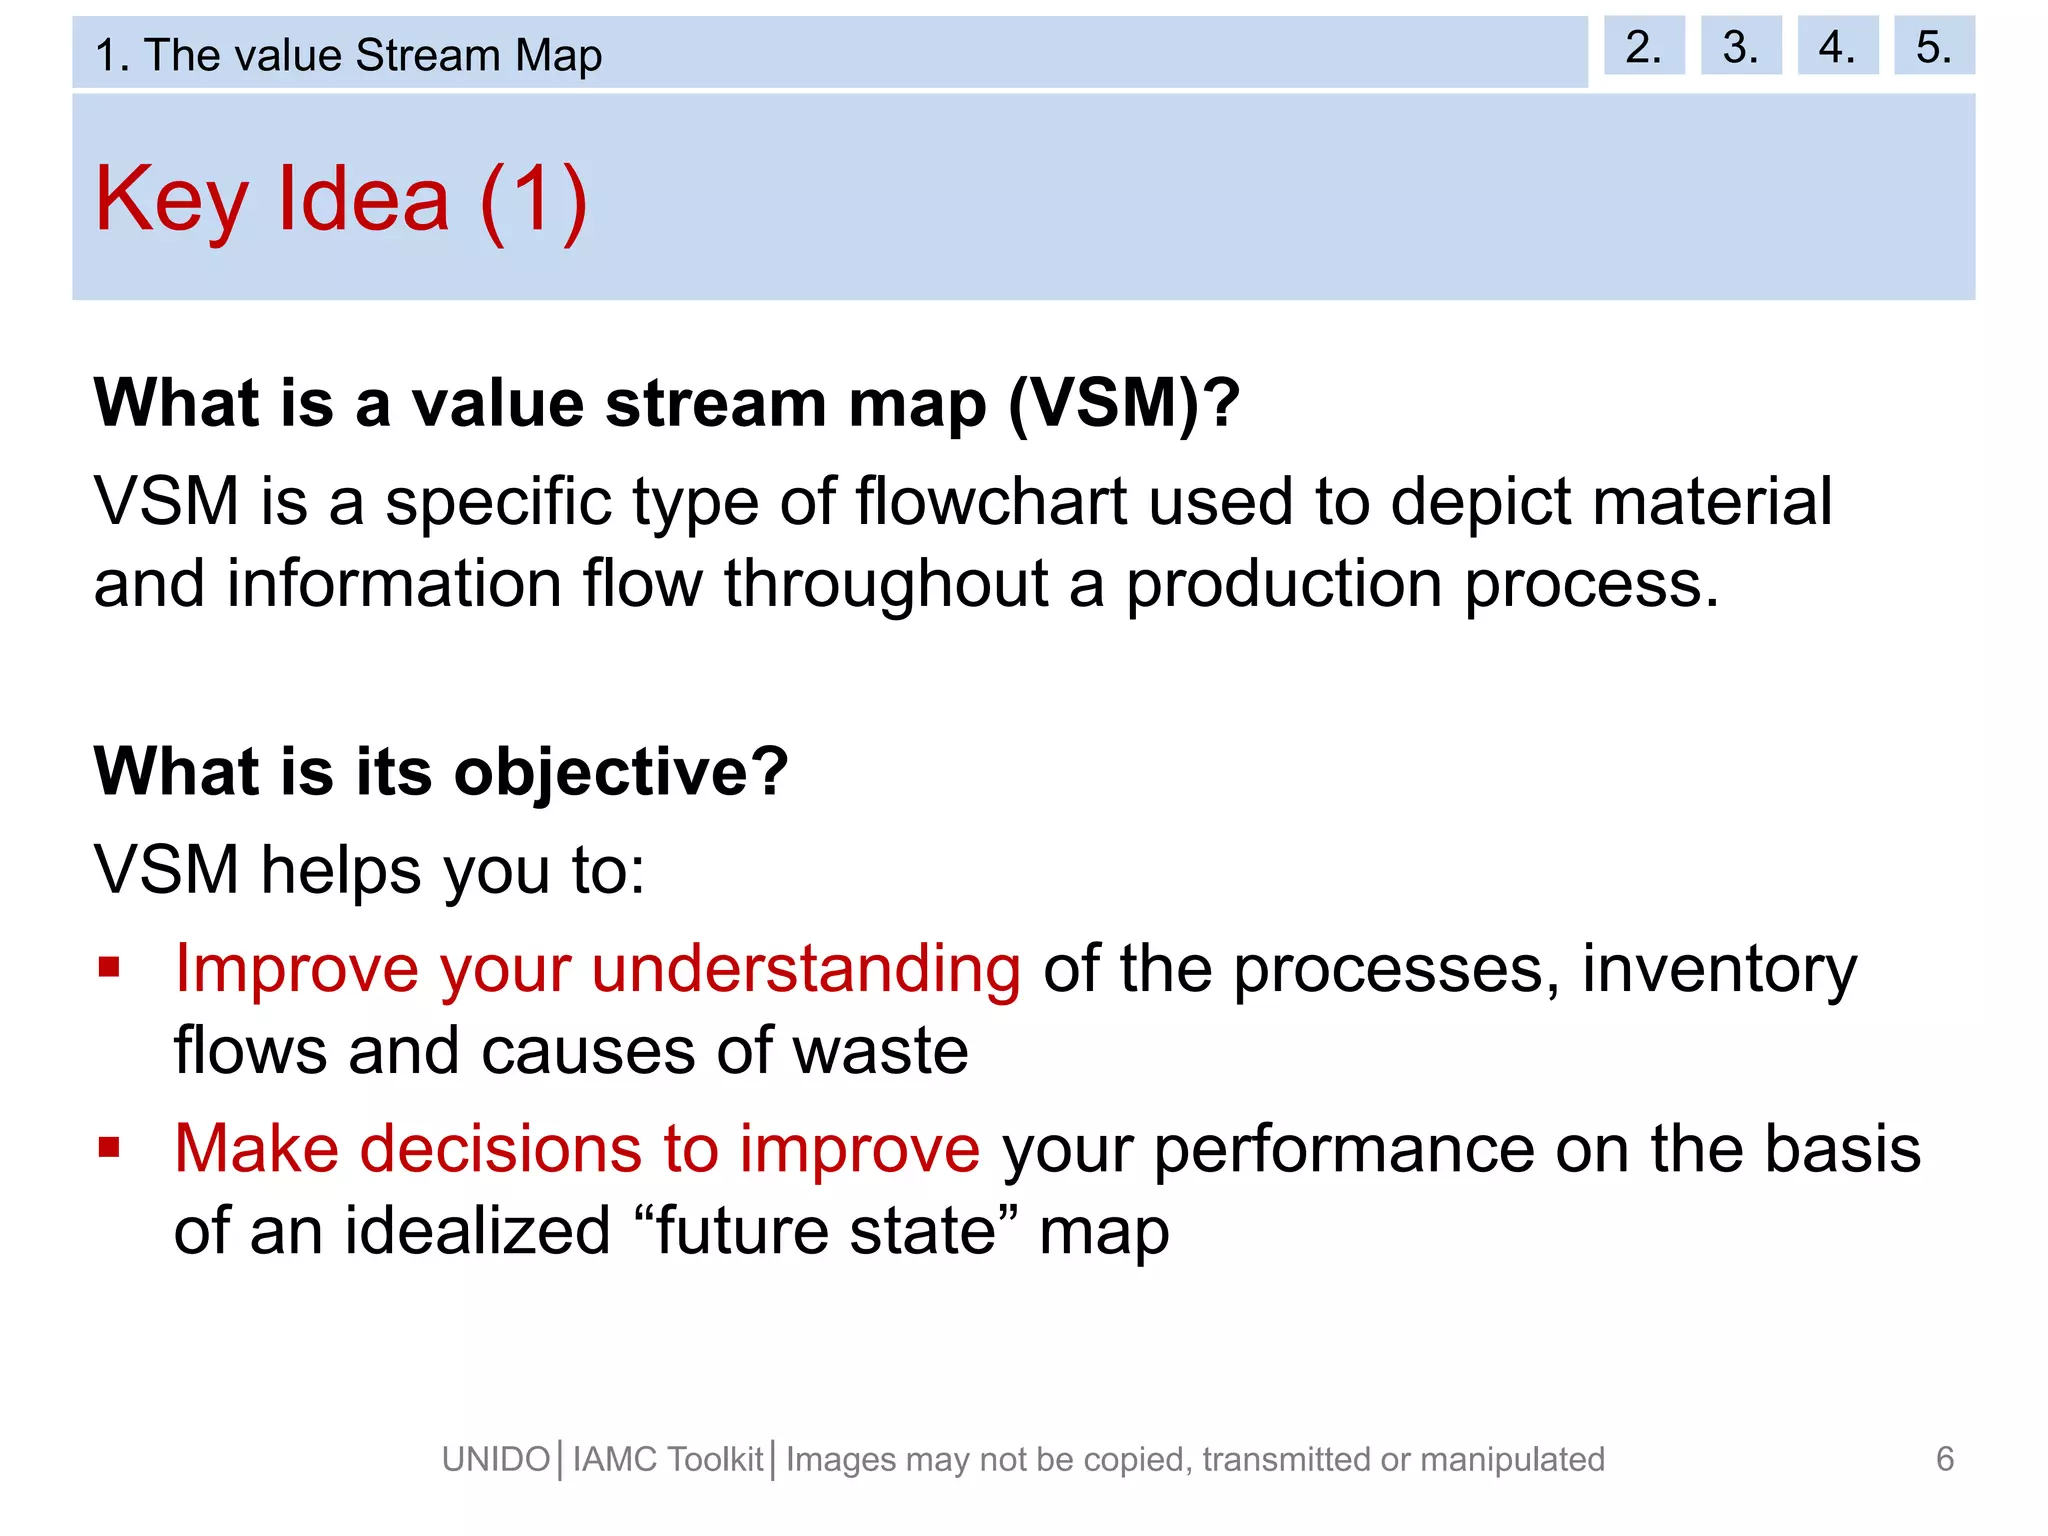
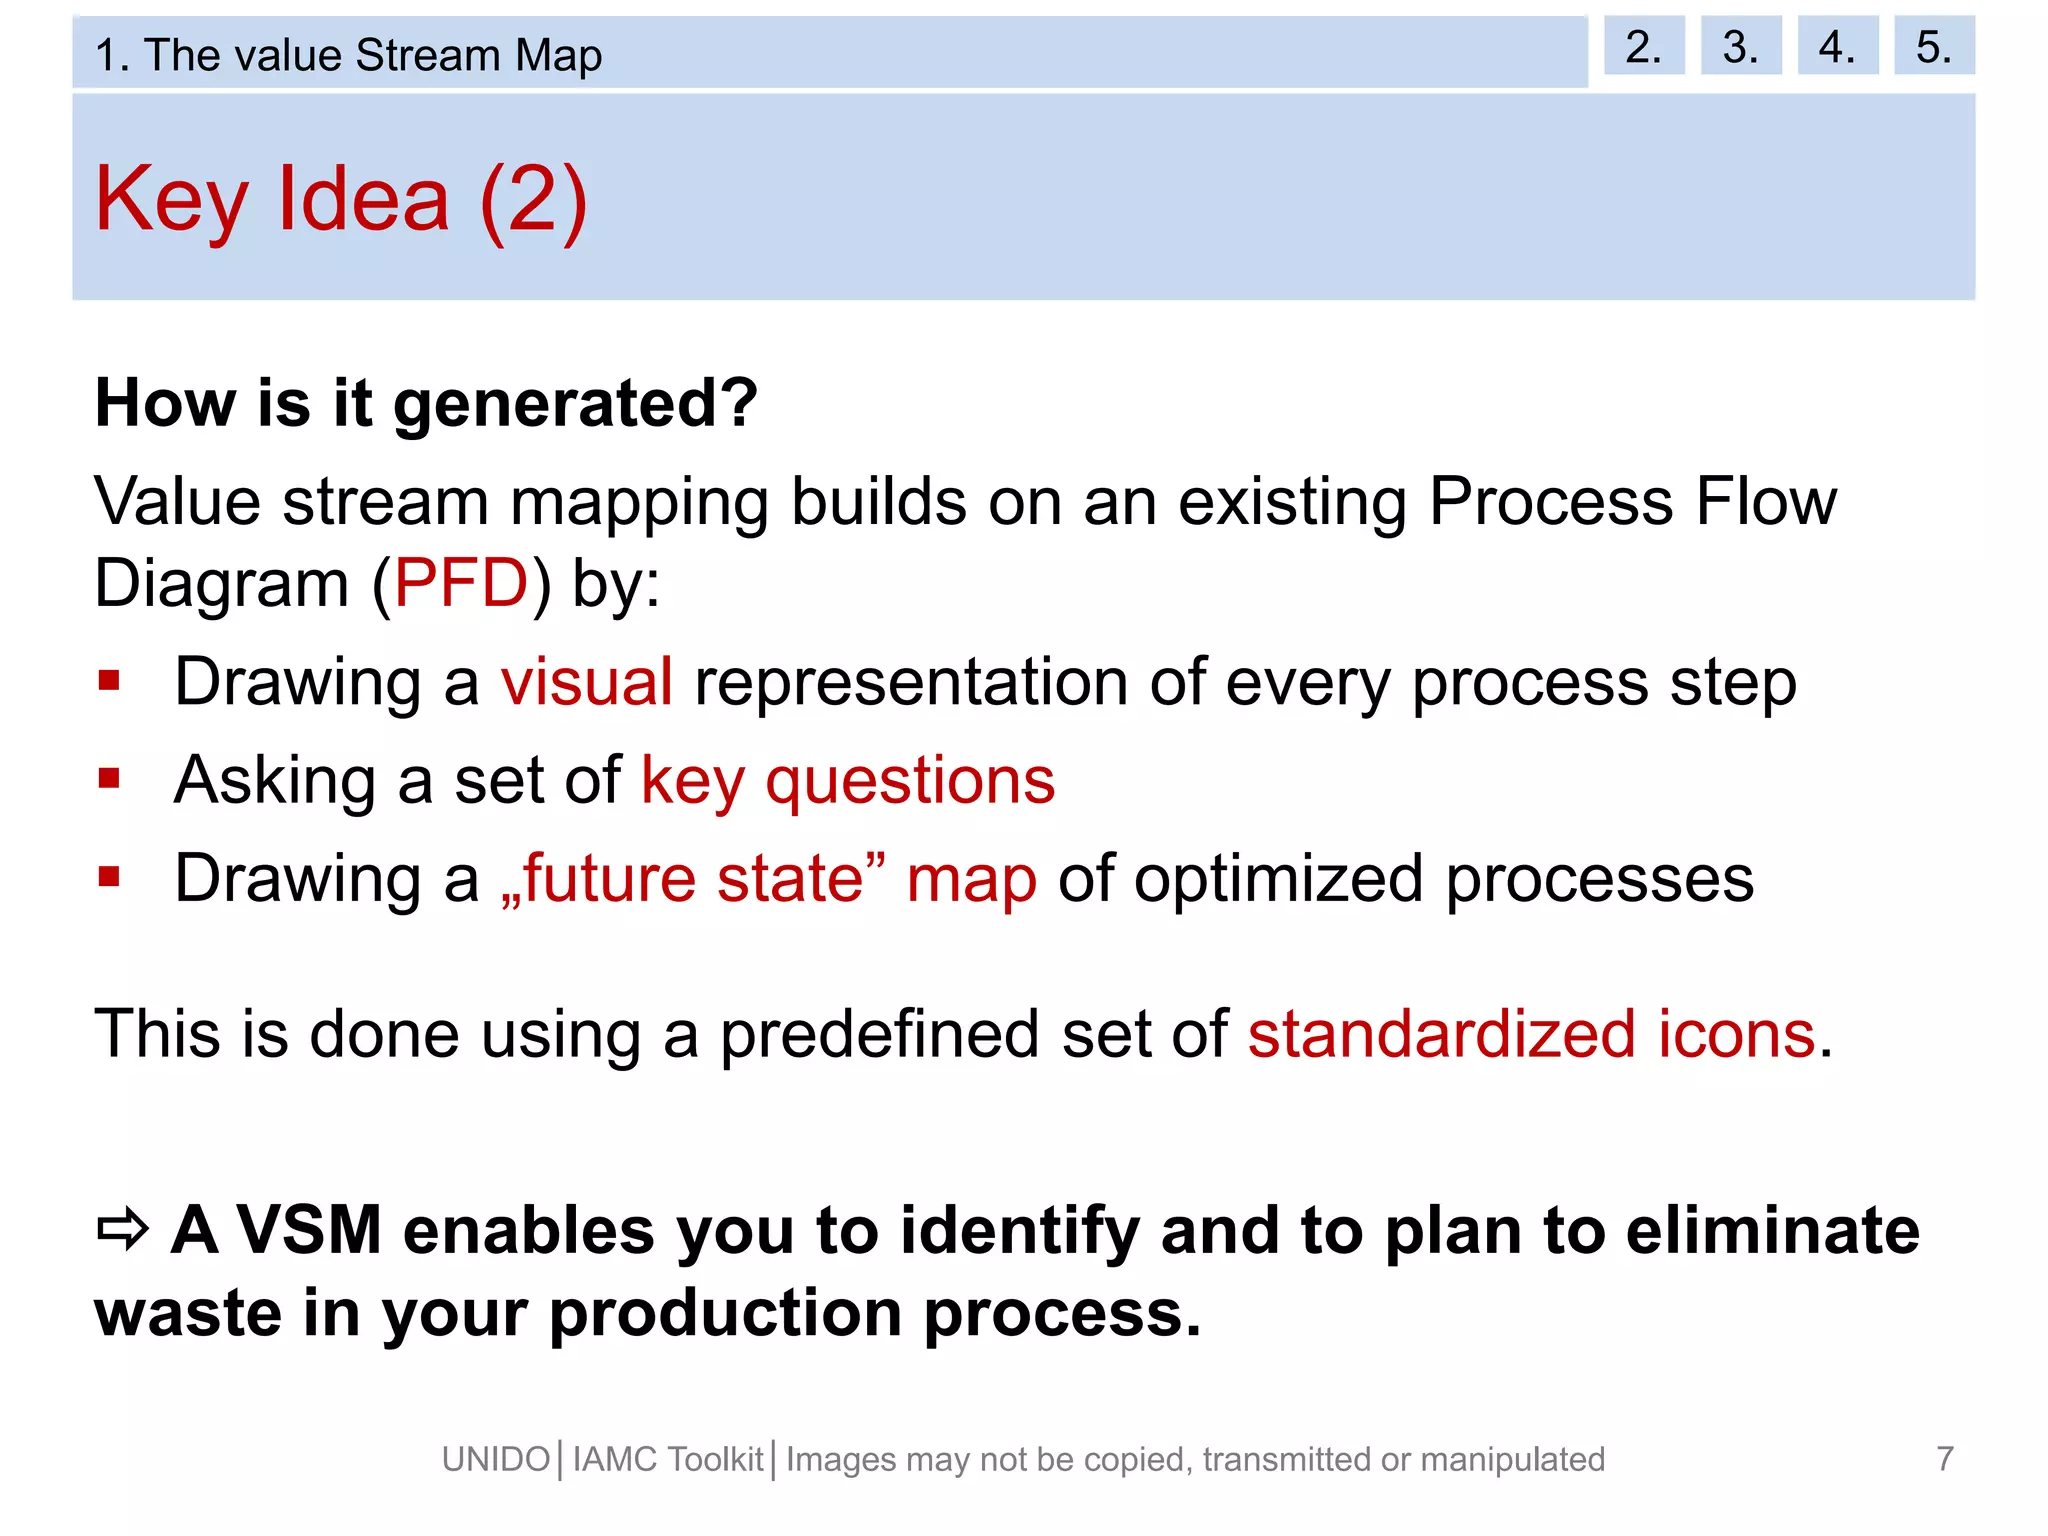
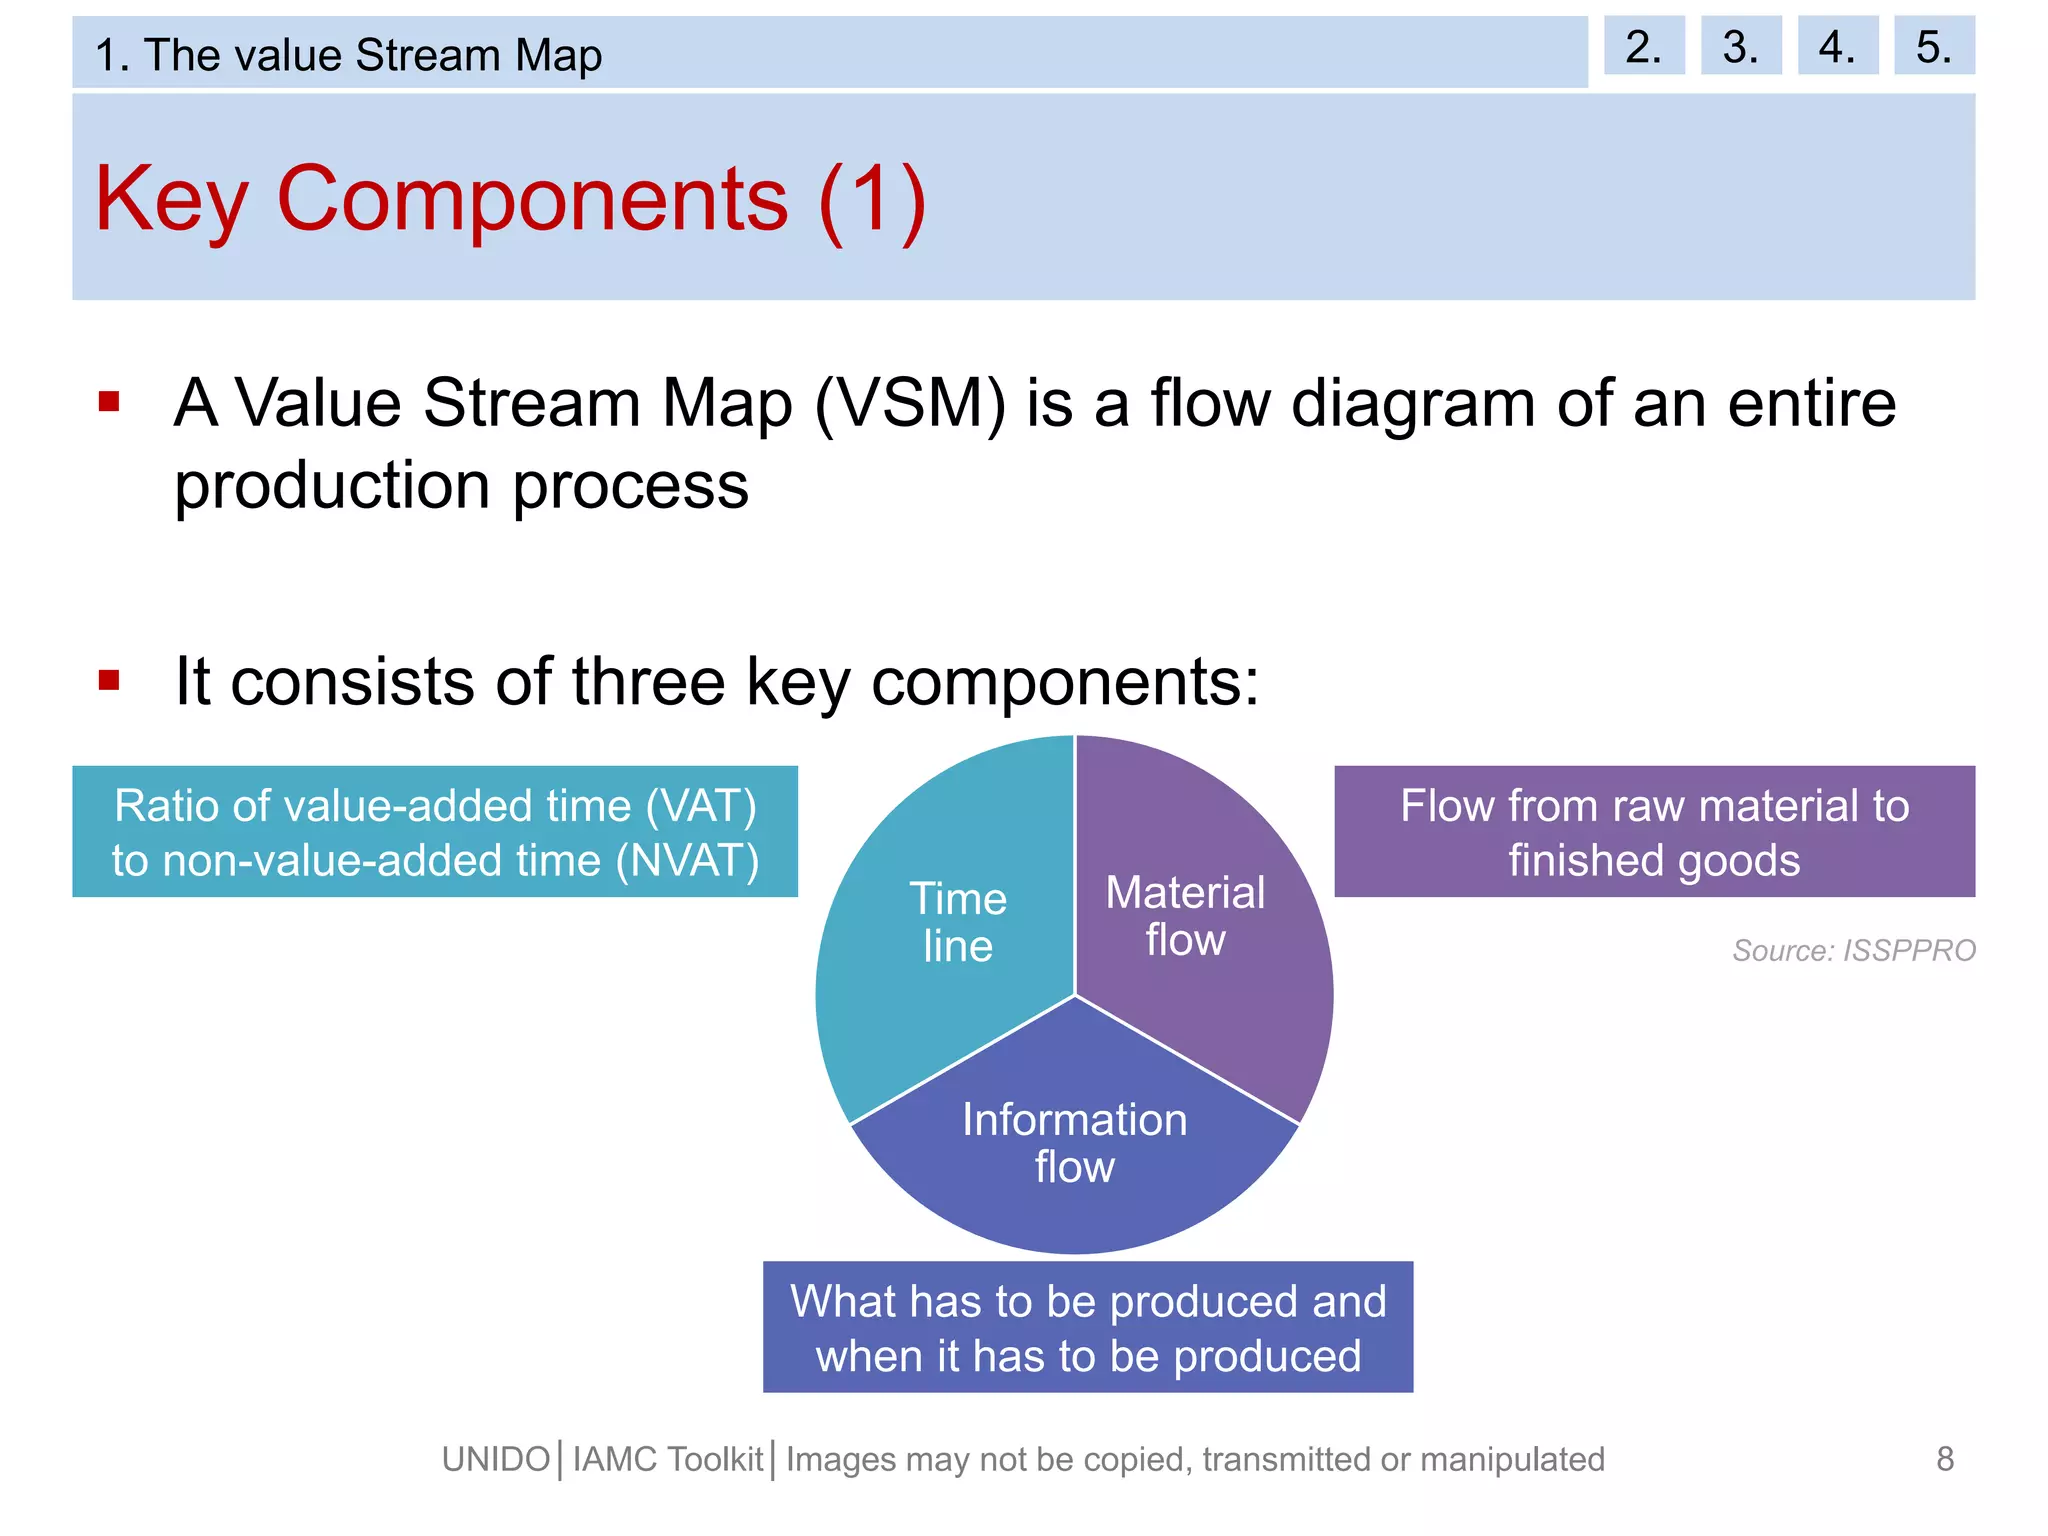
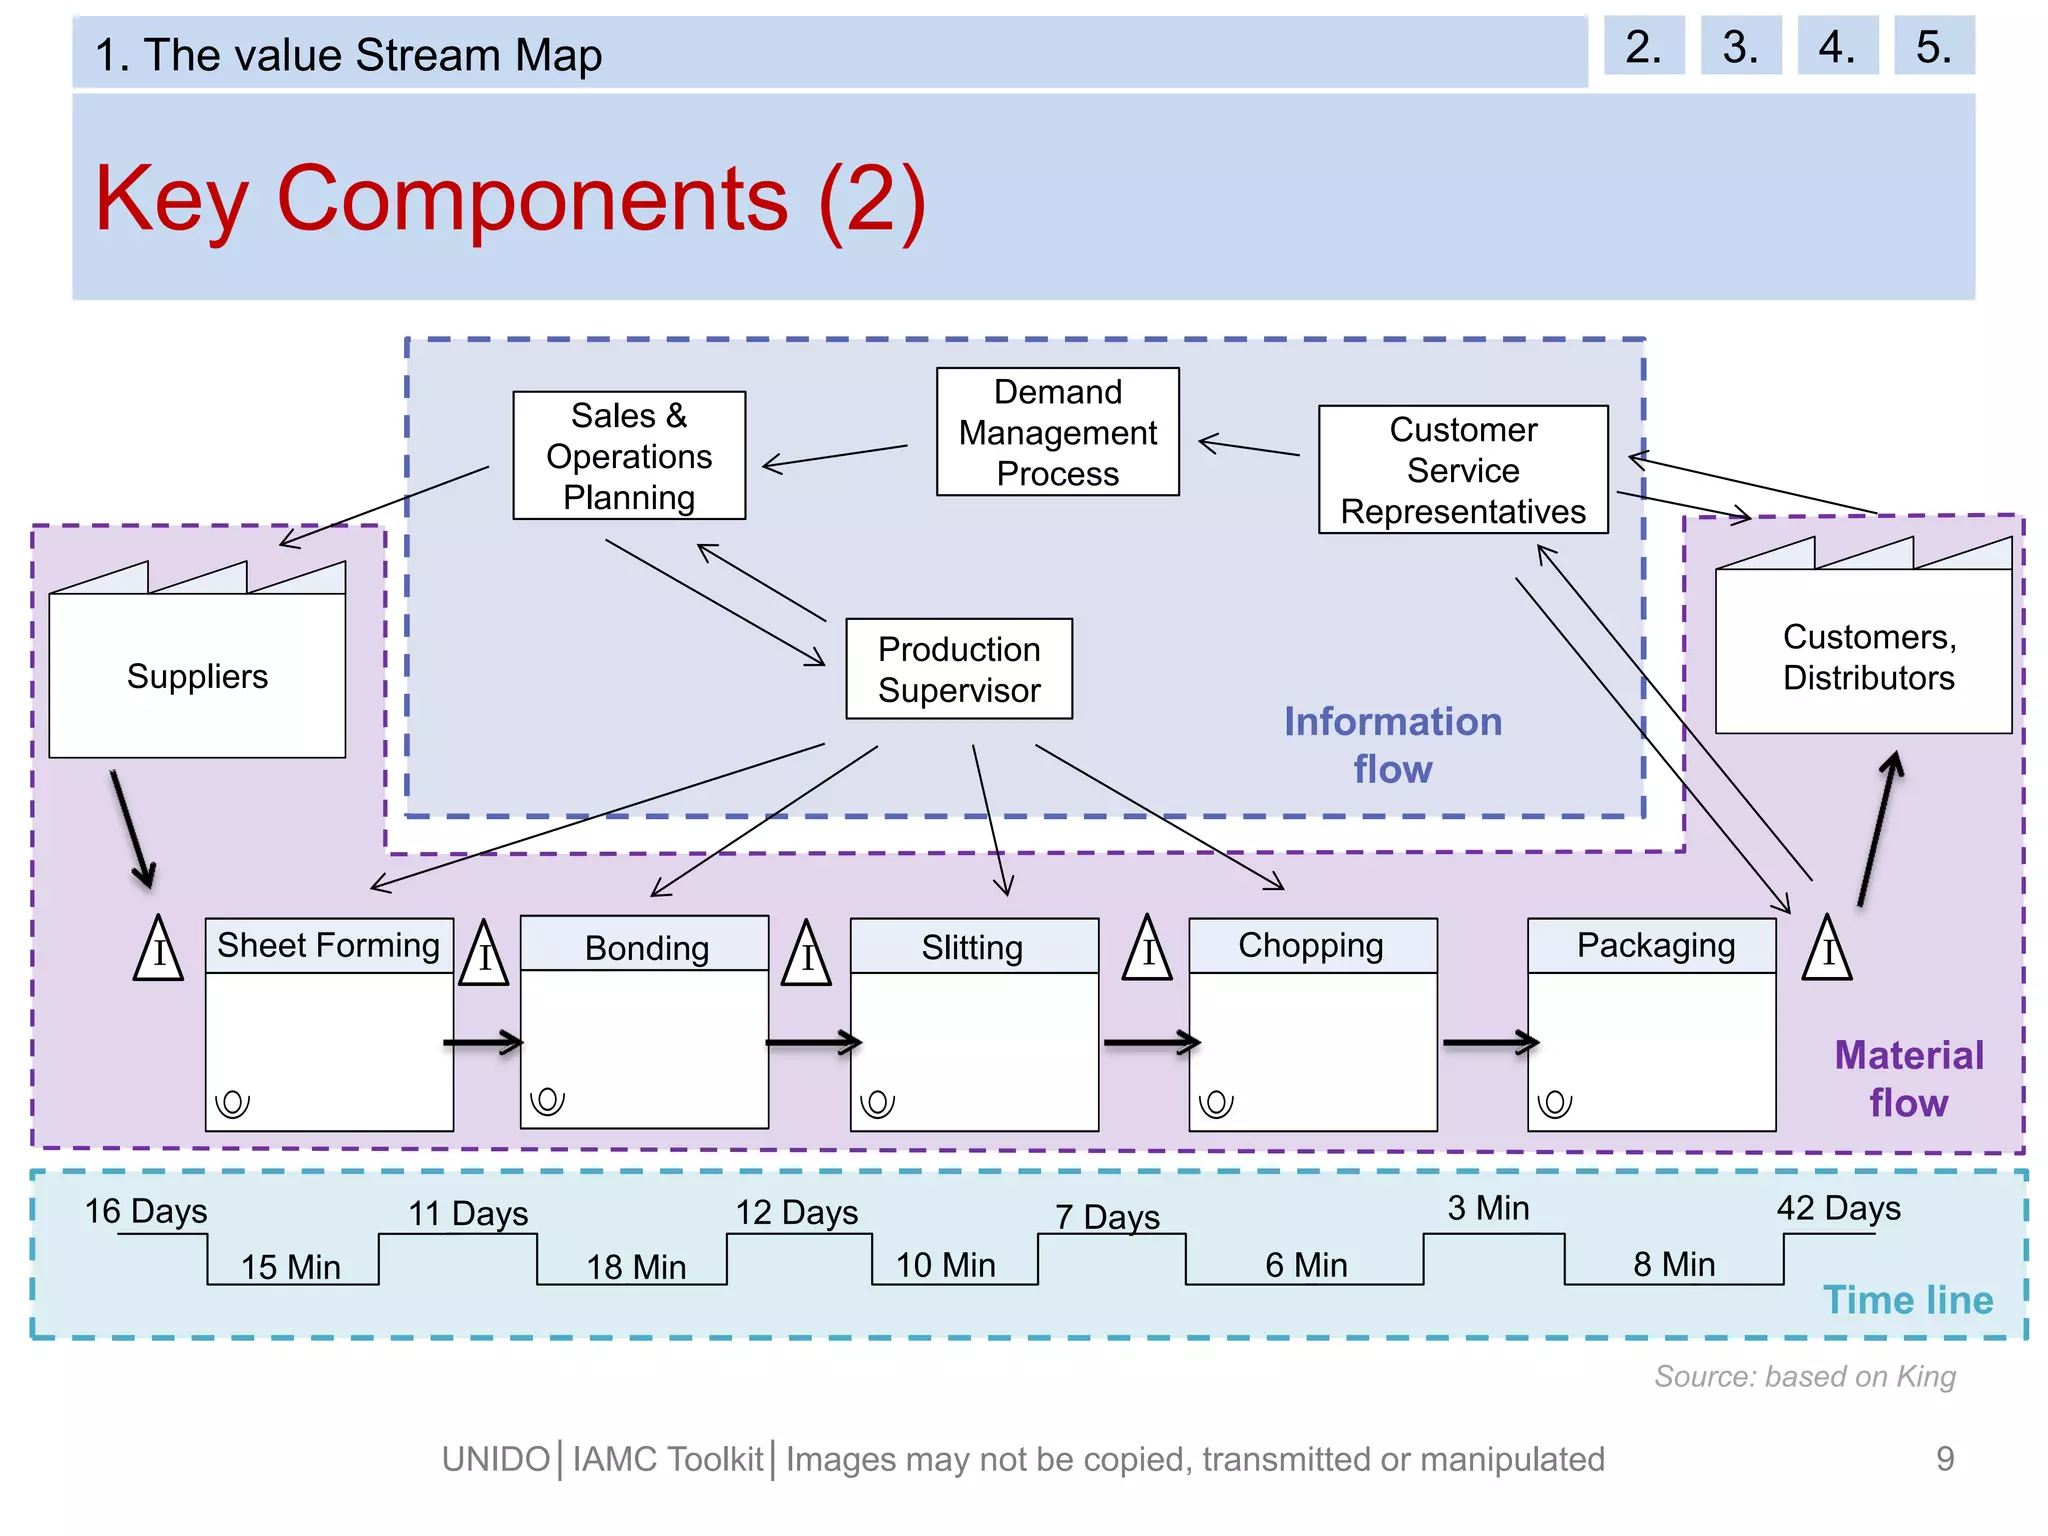
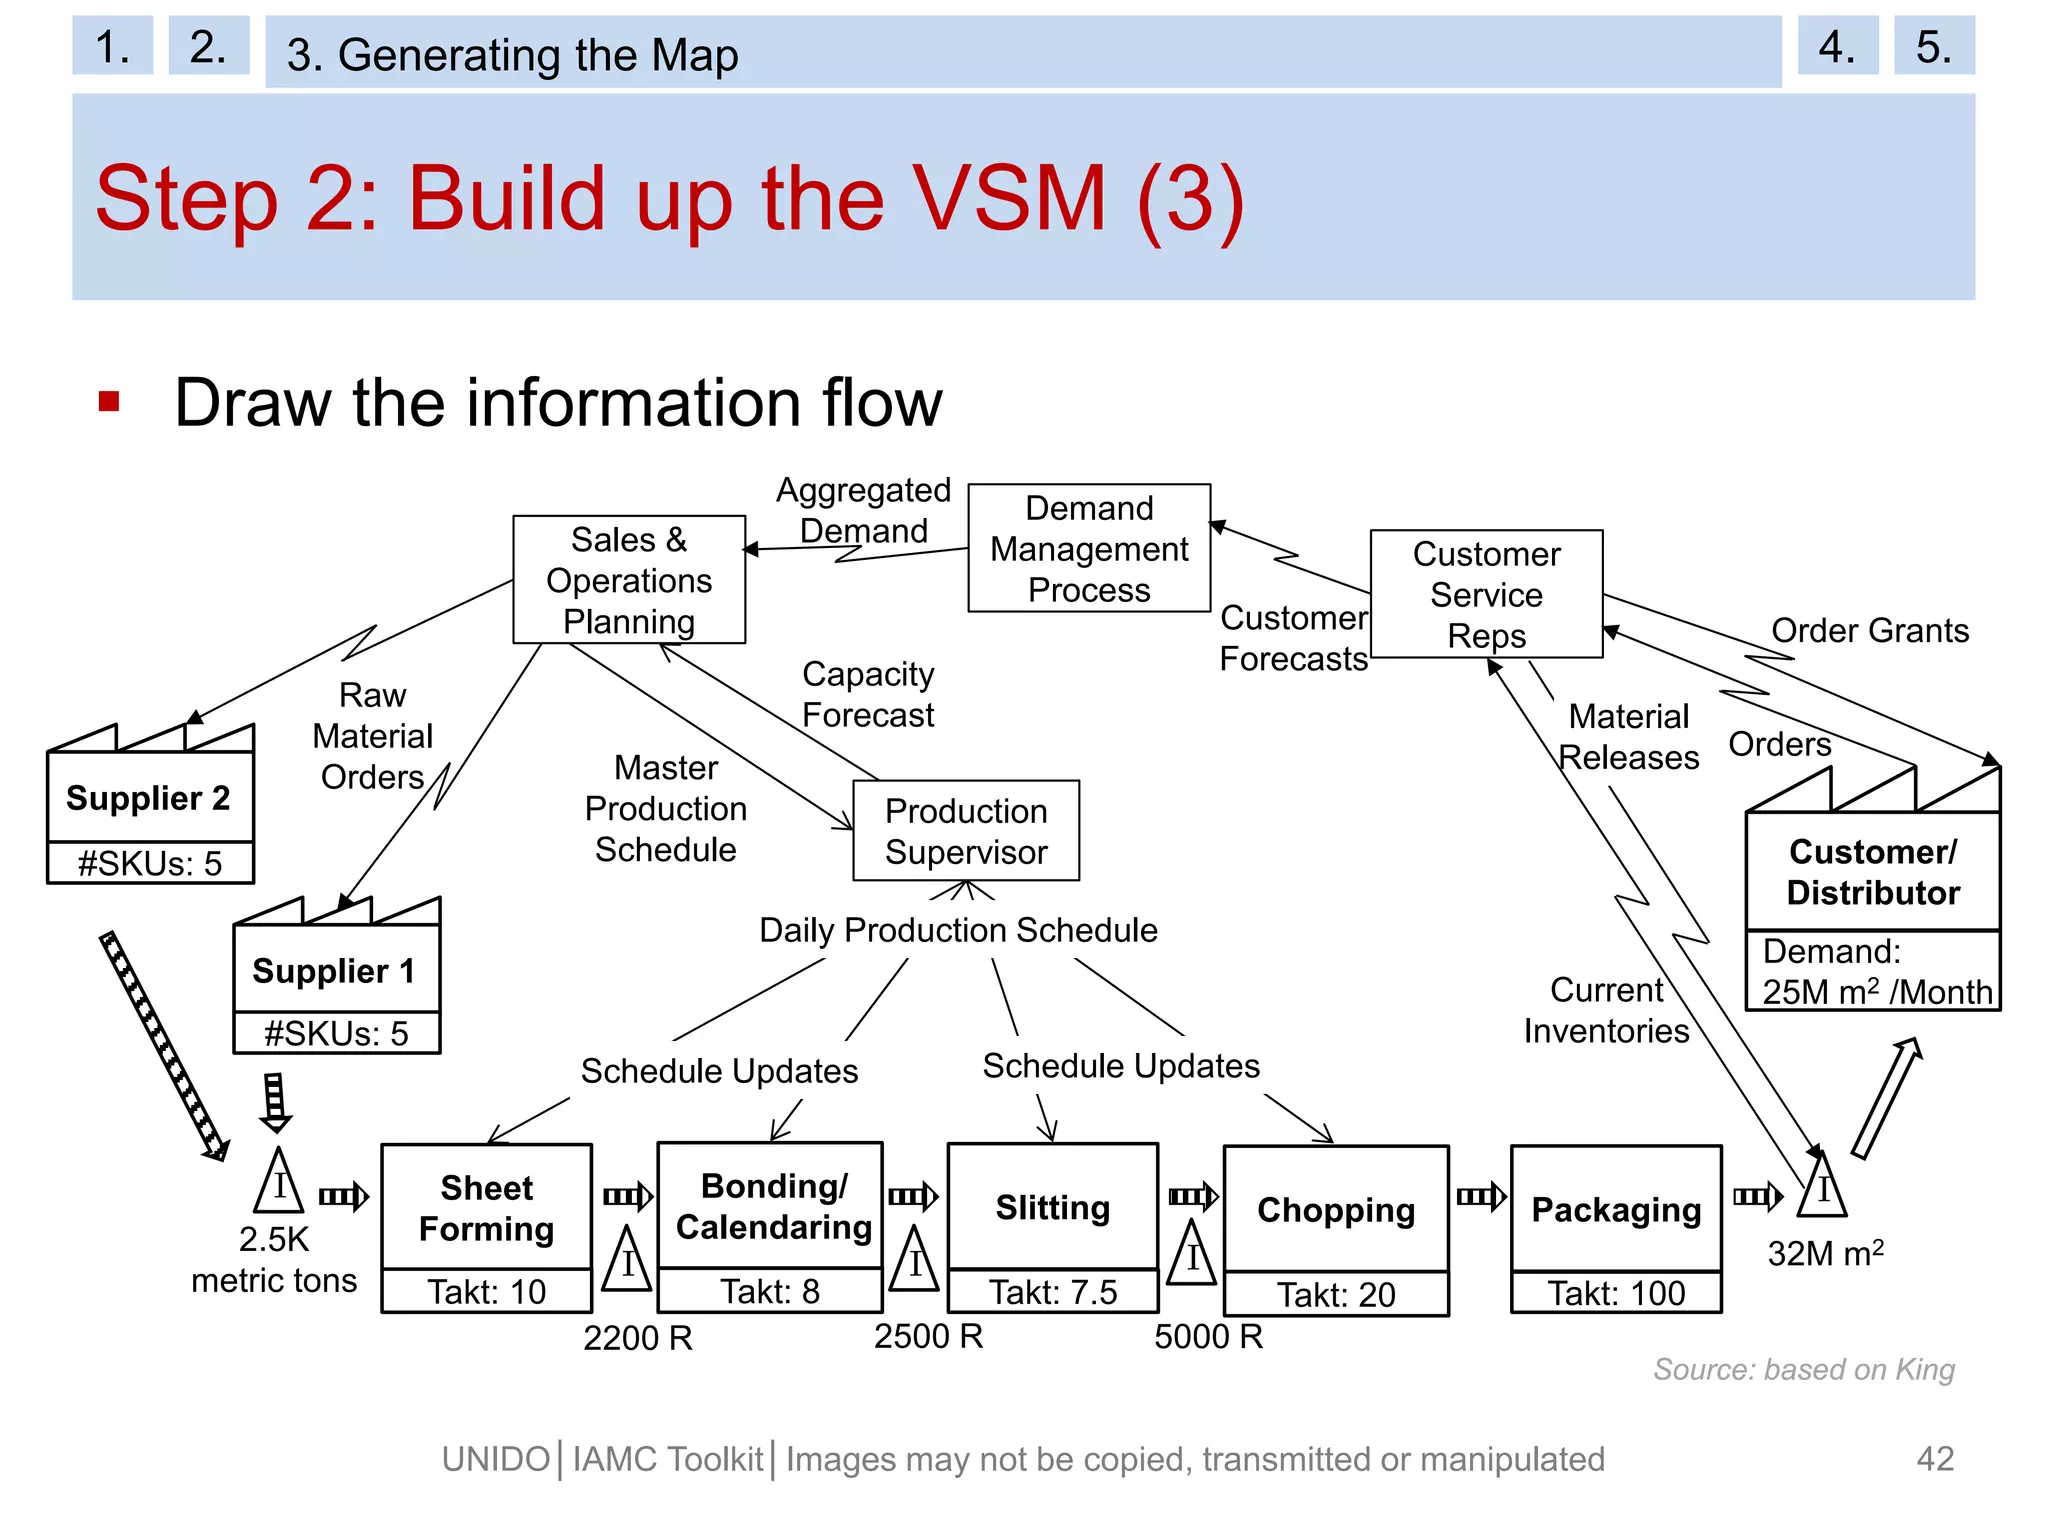
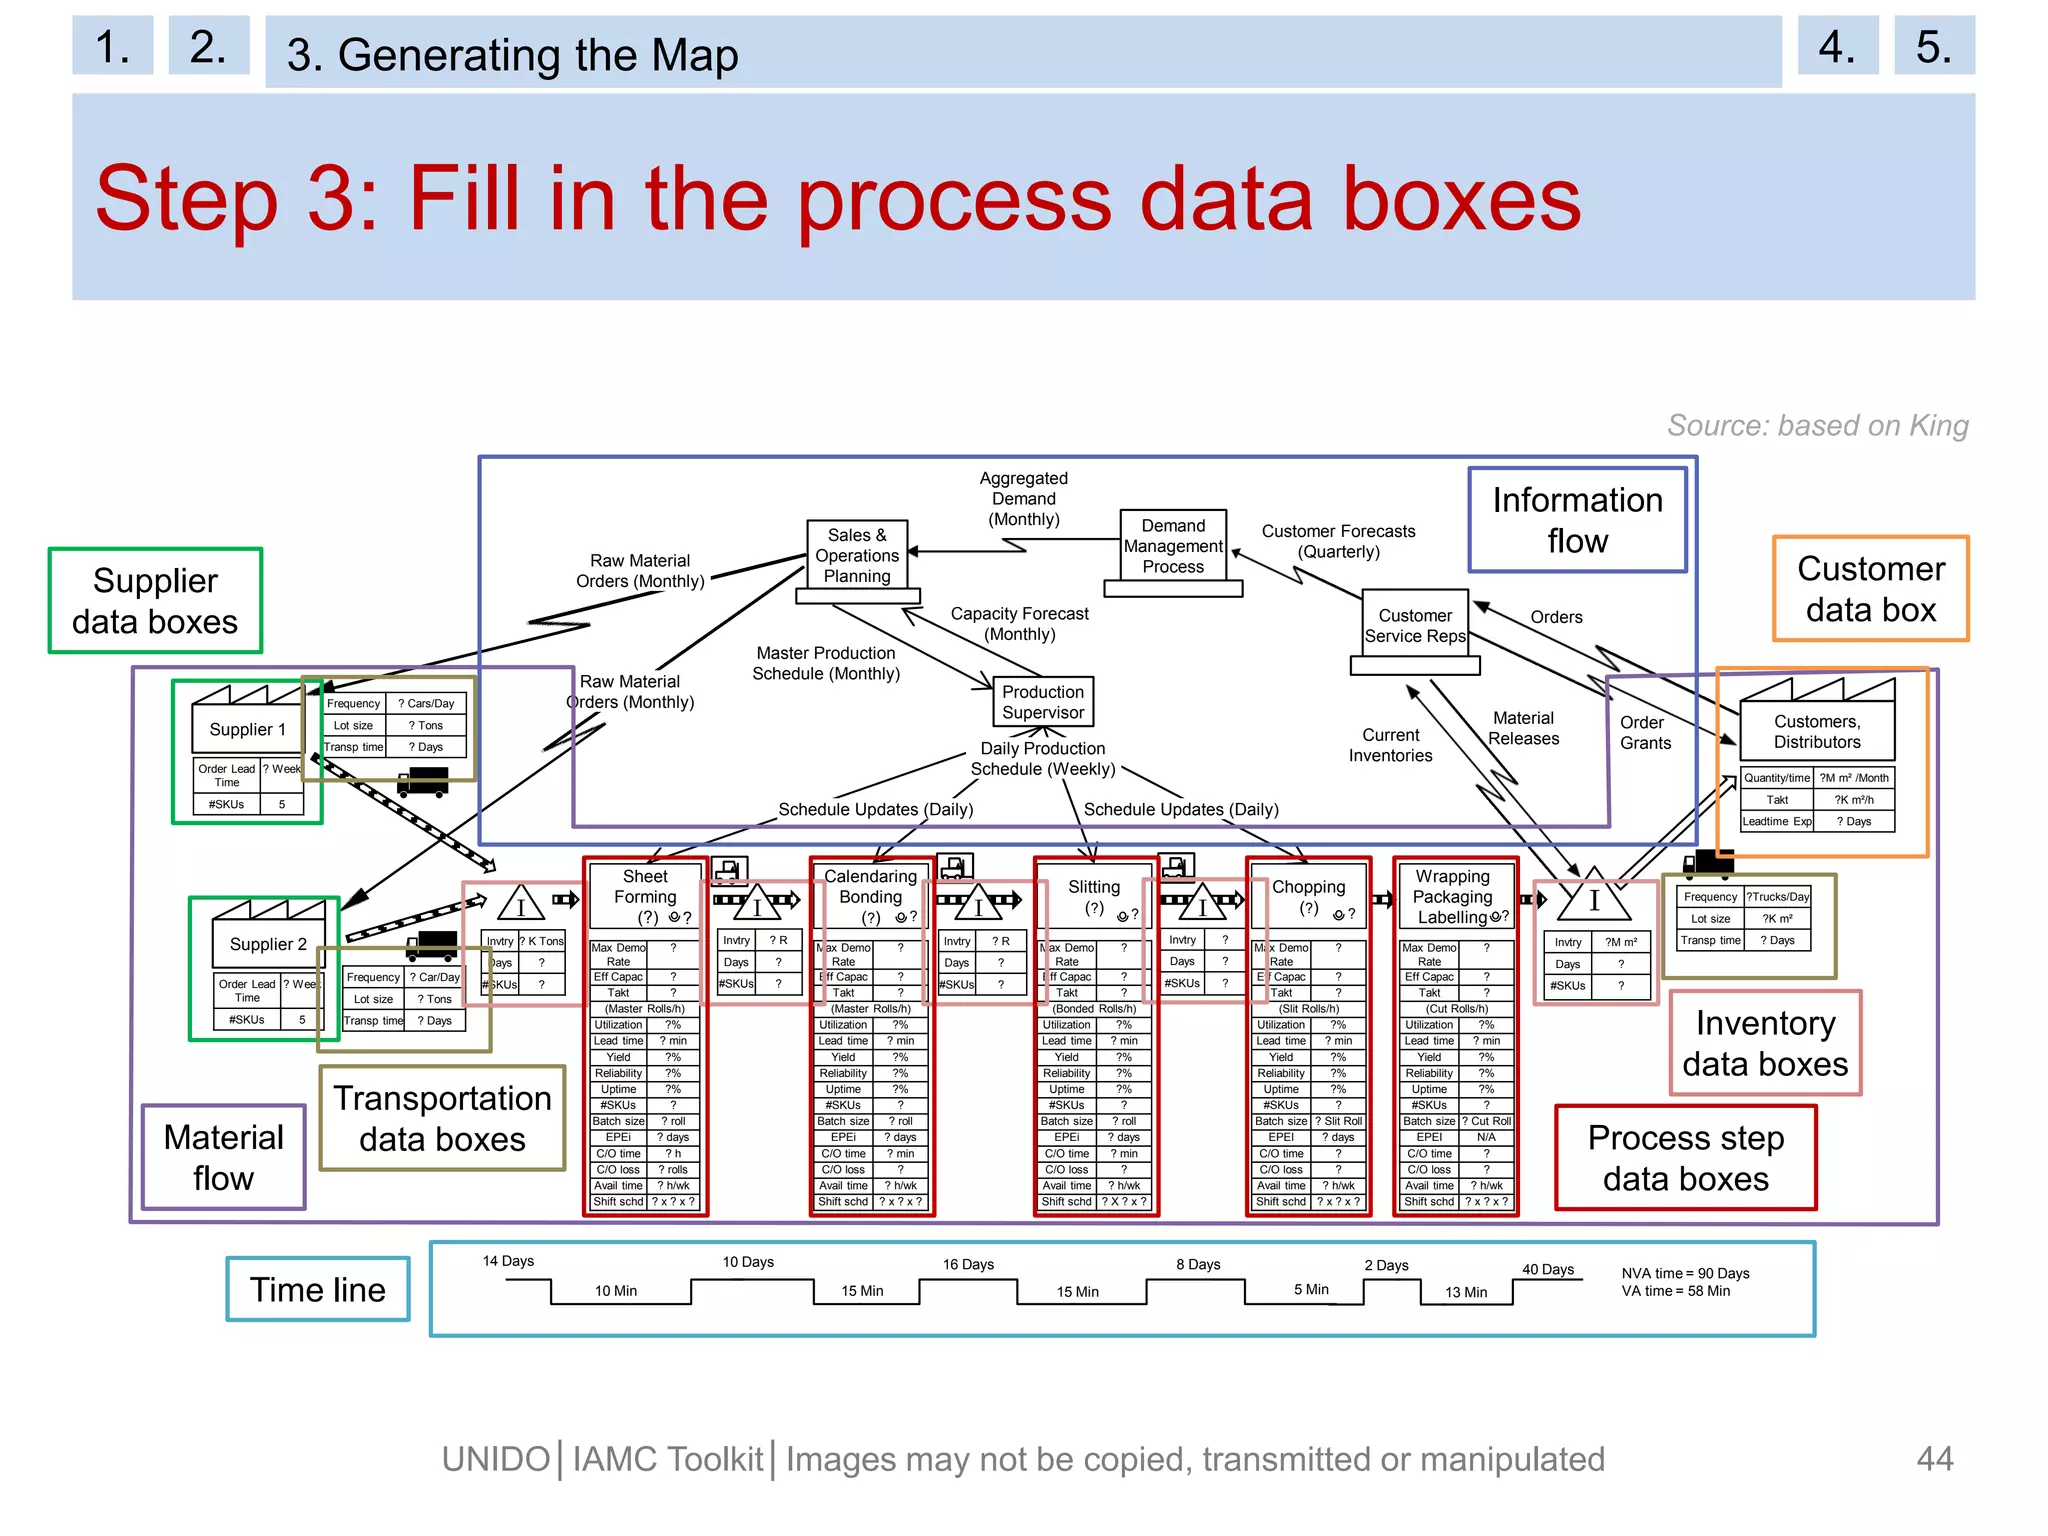
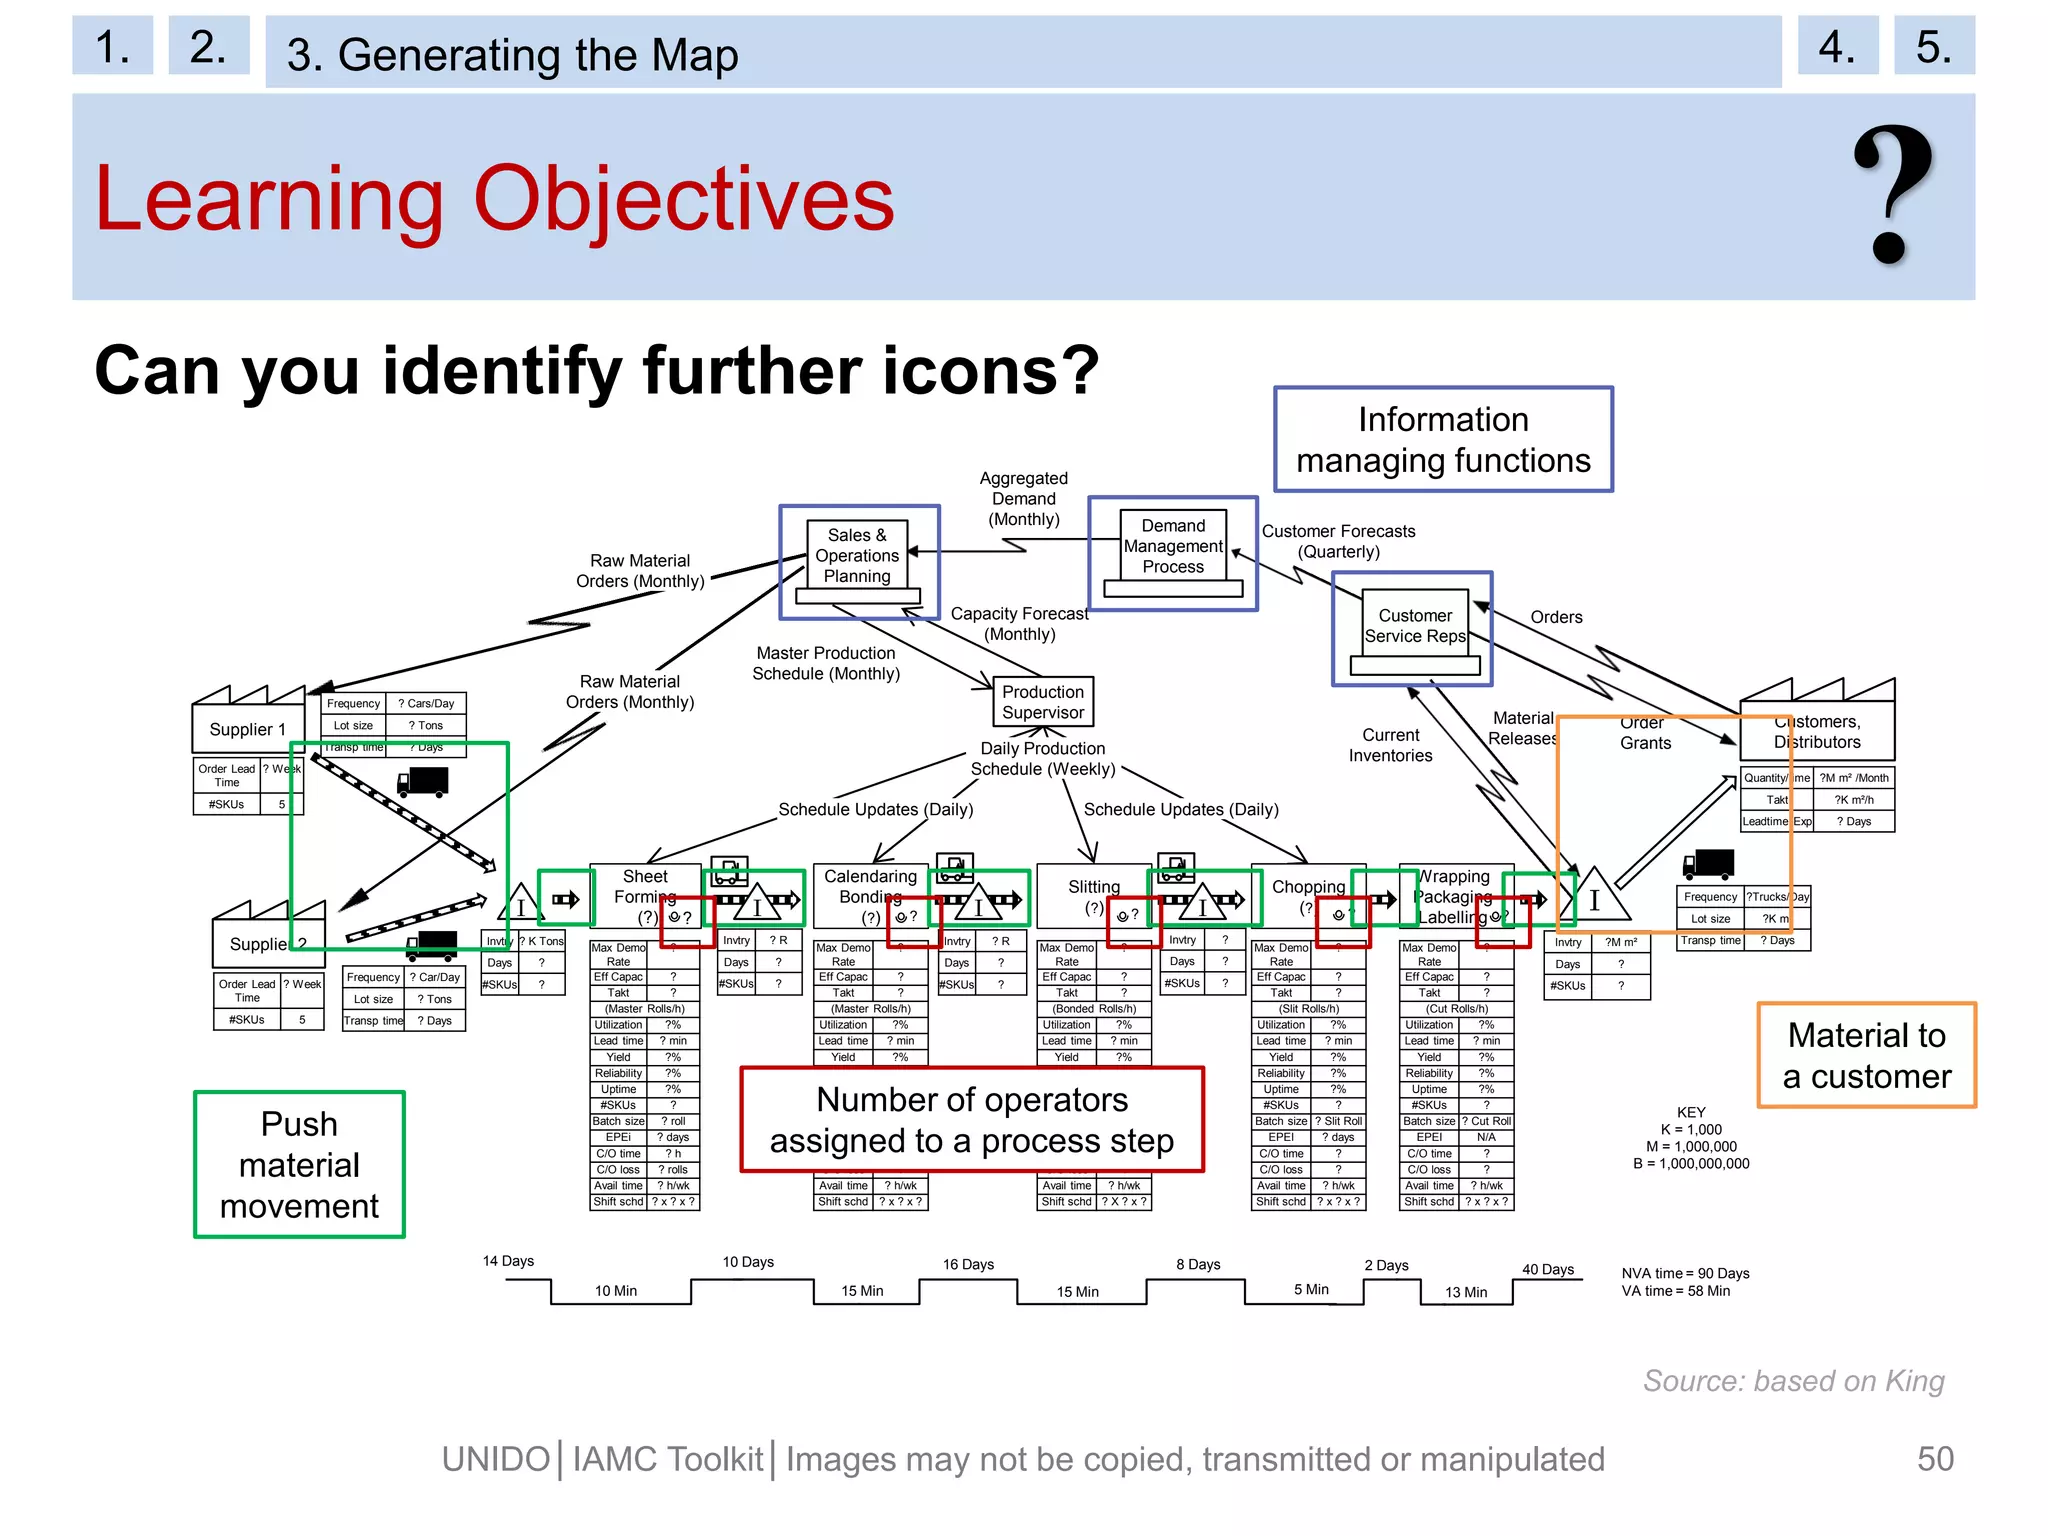
The document provides an introduction to value stream mapping (VSM) for small and medium enterprises in the chemical industry. It explains that VSM is a tool that maps the entire business process to identify sources of waste and their root causes. The goal is to reduce waste, decrease costs and increase productivity. The document outlines the key components of a VSM, including material flow, information flow and timeline. It also explains how a VSM is generated and some best practices. The reader will learn how to use VSM to improve operations in the chemical industry.
![Process Step Data Box (1)
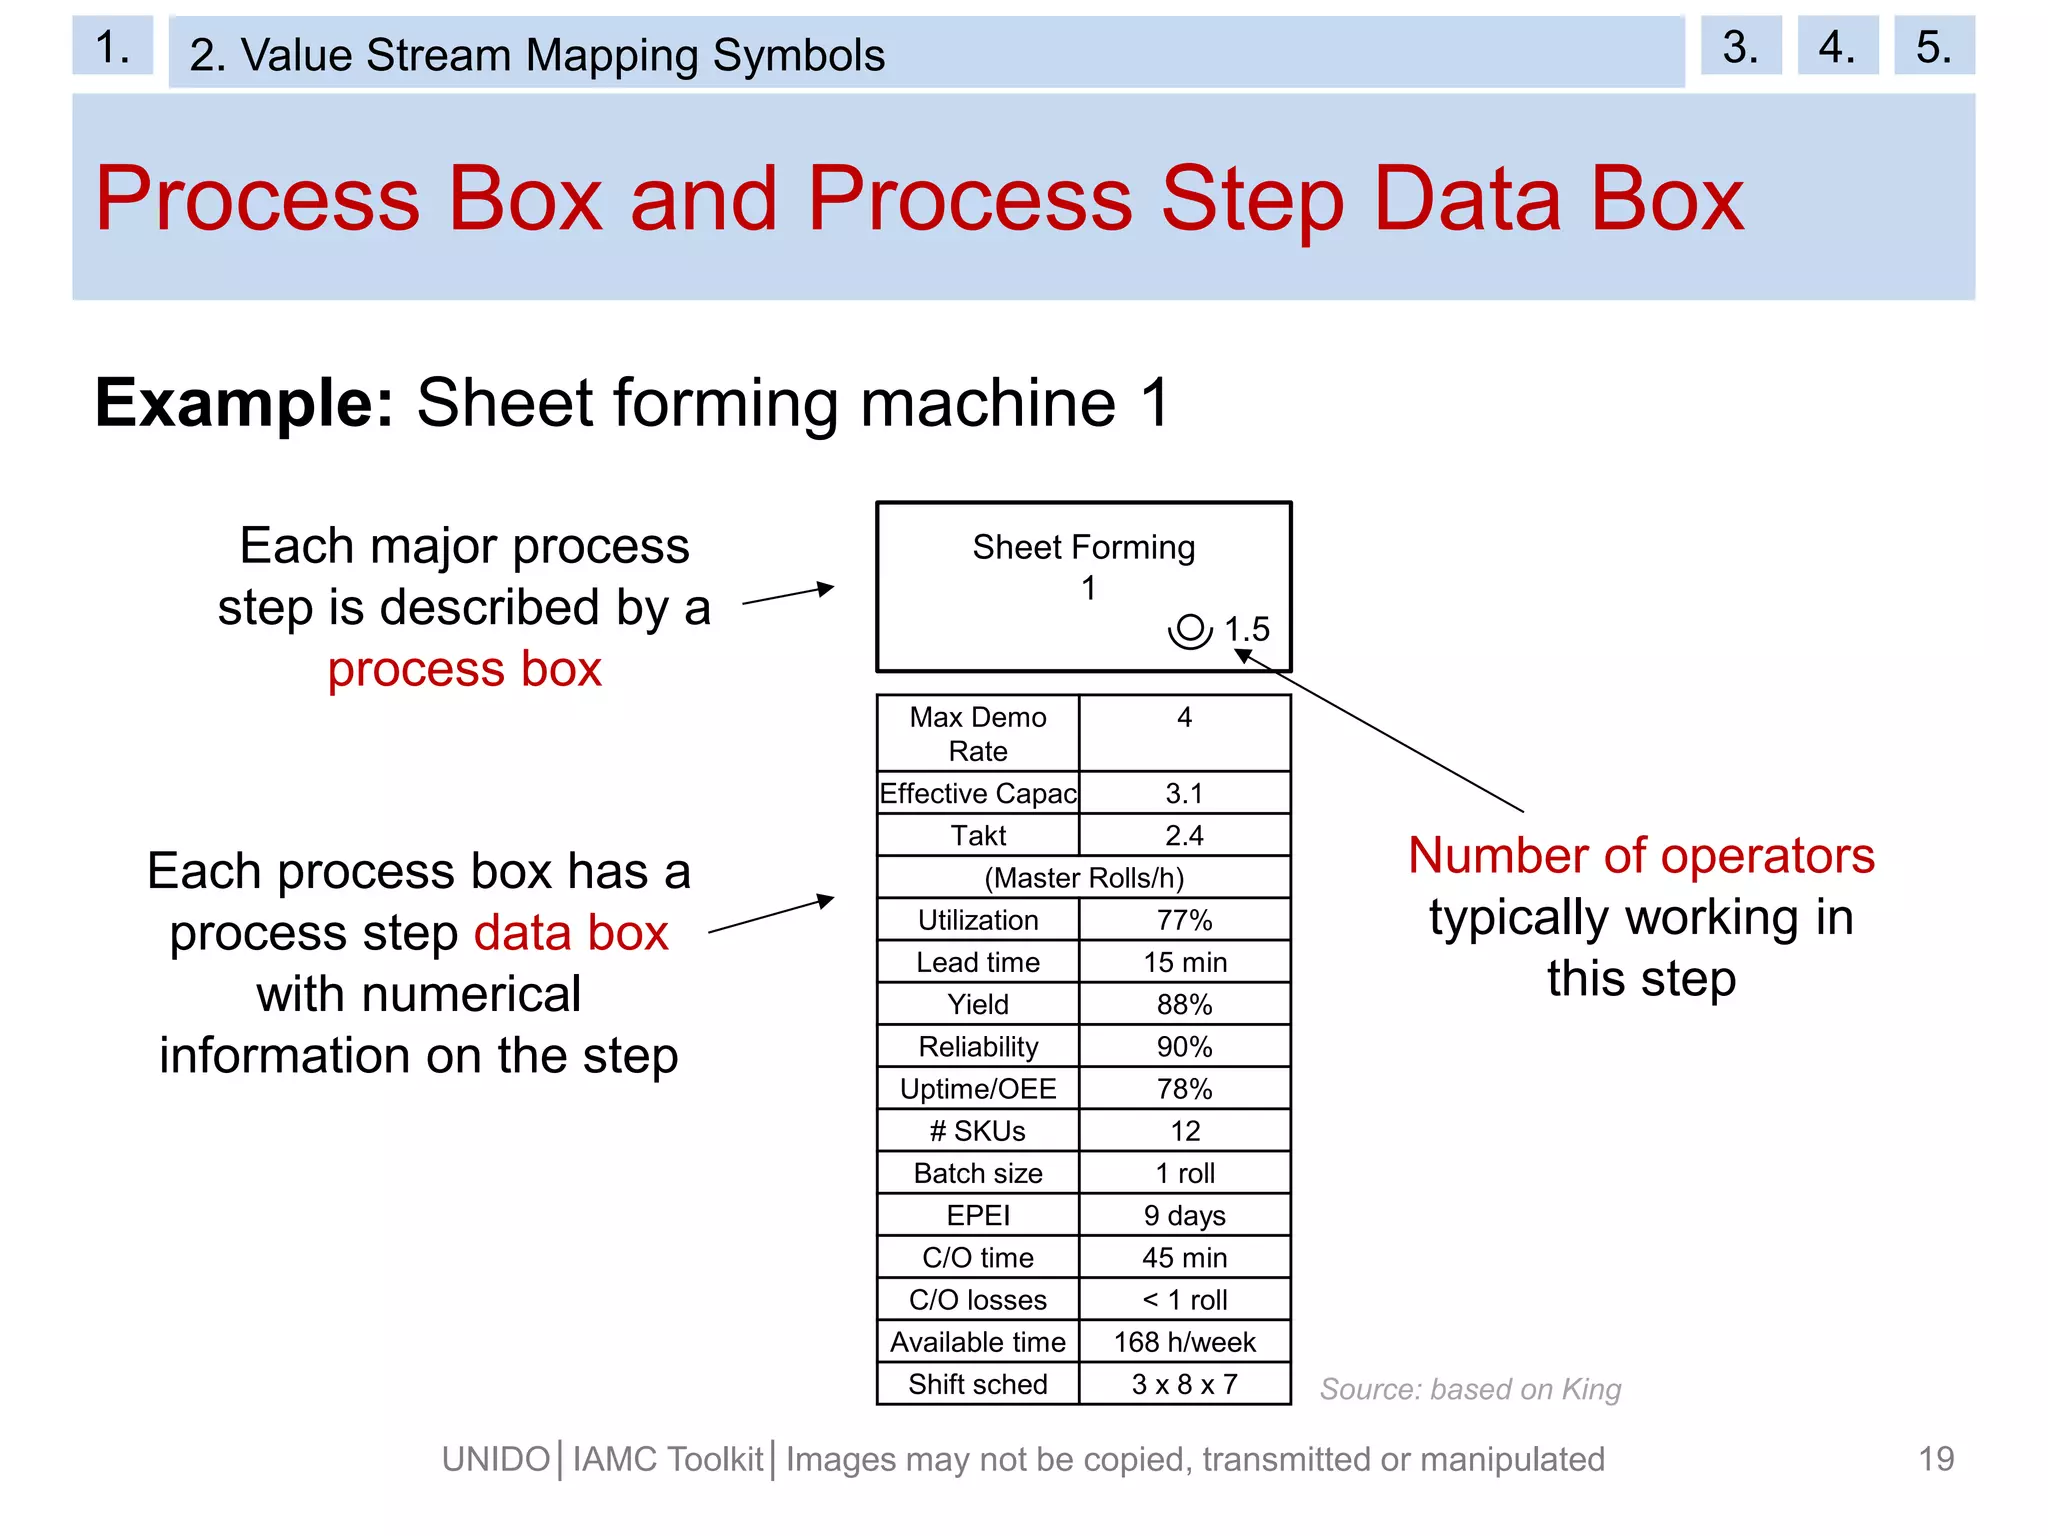
C/T (Cycle time) [min/unit]:Time between releases of
parts or batches
Takt [min/unit]: Time available to produce one unit of
product
Utilization [%]: Measure for how fully utilized a process
step is
Lead time [min]: The time needed for one part or lot to
complete this process step
Yield [%]: Percentage of material entering the step that
leaves it with required quality
Reliability [%]: The percentage of time without any
equipment failure
Uptime [%]: Measure reflecting all sorts of time lost
UNIDO│IAMC Toolkit│Images may not be copied, transmitted or manipulated 20
Process Step Data Box
C/T ## [min/unit]
Takt ## [min/unit]
Utilization ## [%]
Lead time ## [min]
Yield ## [%]
Reliability ## [%]
Uptime ## [%]
# SKUs ## [units]
Batch size ## [units]
EPEI ## [days]
C/O time ## [min]
C/O losses ## [units]
Available time ## [h/week]
Shift sched ## [h/week]
1. 2. Value Stream Mapping Symbols 3. 4. 5.](https://image.slidesharecdn.com/e121value-stream-mapping-final-web-161121103757/75/E12-1-value-stream-mapping-final-web-20-2048.jpg)
![Process Step Data Box (2)
Number of SKUs (Stock keeping units) [units]: Number
of specific products leaving this process step
Batch size [units]: Amount of material produced as a
single lot
EPEI [days]: Time span over which all product types
are made
C/O (Changeover) time [min]: Time needed to change
from one product to another
C/O (Changeover) losses [units]: Amount of material
lost in the change from one product to another
Available time [h/week]: Total time this process step is
planned to run
Shift sched(ule) [h/week]: Number of hours per shift,
shifts per day and days per week
UNIDO│IAMC Toolkit│Images may not be copied, transmitted or manipulated 21
Process Step Data Box
C/T ## [min/unit]
Takt ## [min/unit]
Utilization ## [%]
Lead time ## [min]
Yield ## [%]
Reliability ## [%]
Uptime ## [%]
# SKUs ## [units]
Batch size ## [units]
EPEI ## [days]
C/O time ## [min]
C/O losses ## [units]
Available time ## [h/week]
Shift sched ## [h/week]
1. 2. Value Stream Mapping Symbols 3. 4. 5.](https://image.slidesharecdn.com/e121value-stream-mapping-final-web-161121103757/75/E12-1-value-stream-mapping-final-web-21-2048.jpg)
![Process Step Data Box (3)
The process data box can be
complemented by specific
environmental data, such as:
Hazardous waste generation
Water consumption
Energy consumption
Emissions generation
Environmental, health and safety
hotspots (EHS HS)
Can also be appropriate for
inventory data boxes!
UNIDO│IAMC Toolkit│Images may not be copied, transmitted or manipulated 22
Process Step Data Box
C/T ## [min/unit]
Takt ## [min/unit]
Utilization ## [%]
Lead time ## [min]
…
Material and Energy Data
Hazardous waste ## [kg/batch]
Water consumption ## [L/batch]
Energy
consumption
## [kWh/batch]
Emissions ## [kg/batch]
EHS HS ##
1. 2. Value Stream Mapping Symbols 3. 4. 5.](https://image.slidesharecdn.com/e121value-stream-mapping-final-web-161121103757/75/E12-1-value-stream-mapping-final-web-22-2048.jpg)
![Key Metrics (1)
UNIDO│IAMC Toolkit│Images may not be copied, transmitted or manipulated 23
Apart from takt and cycle time, the following parameters
are commonly indicated:
Utilisation: Measure of how fully utilized a process step is
Uptime: Ratio of actual production time to availability time
𝑈𝑡𝑖𝑙𝑖𝑠𝑎𝑡𝑖𝑜𝑛 [%] =
𝑐𝑦𝑐𝑙𝑒 𝑡𝑖𝑚𝑒
𝑚𝑖𝑛
𝑢𝑛𝑖𝑡
𝑡𝑎𝑘𝑡 𝑡𝑖𝑚𝑒
𝑚𝑖𝑛
𝑢𝑛𝑖𝑡
=
𝑡𝑎𝑘𝑡 𝑟𝑎𝑡𝑒
𝑢𝑛𝑖𝑡𝑠
ℎ
𝑒𝑓𝑓𝑒𝑐𝑡𝑖𝑣𝑒 𝑐𝑎𝑝𝑎𝑐𝑖𝑡𝑦
𝑢𝑛𝑖𝑡𝑠
ℎ
𝑈𝑝𝑡𝑖𝑚𝑒 % =
𝑣𝑎𝑙𝑢𝑎𝑏𝑙𝑒 𝑜𝑝𝑒𝑟𝑎𝑡𝑖𝑛𝑔 𝑡𝑖𝑚𝑒 [𝑚𝑖𝑛]
𝑣𝑎𝑙𝑢𝑎𝑏𝑙𝑒 𝑜𝑝𝑒𝑟𝑎𝑡𝑖𝑛𝑔 𝑡𝑖𝑚𝑒 + 𝑙𝑜𝑠𝑠𝑒𝑠 [𝑚𝑖𝑛]
1. 2. Value Stream Mapping Symbols 3. 4. 5.](https://image.slidesharecdn.com/e121value-stream-mapping-final-web-161121103757/75/E12-1-value-stream-mapping-final-web-23-2048.jpg)
![Key Metrics (2)
UNIDO│IAMC Toolkit│Images may not be copied, transmitted or manipulated 24
Apart from takt and cycle time, the following parameters
are commonly indicated:
Yield: Percentage of good parts leaving a process step
Reliability: Measure of the steadiness of a machine
𝑌𝑖𝑒𝑙𝑑 [%] =
𝑚𝑎𝑡𝑒𝑟𝑖𝑎𝑙 𝑙𝑒𝑎𝑣𝑖𝑛𝑔 𝑎 𝑠𝑡𝑒𝑝 𝑤𝑖𝑡ℎ 𝑎𝑐𝑐𝑒𝑝𝑡𝑎𝑏𝑙𝑒 𝑝𝑟𝑜𝑝𝑒𝑟𝑡𝑖𝑒𝑠
𝑡𝑜𝑡𝑎𝑙 𝑎𝑚𝑜𝑢𝑛𝑡 𝑜𝑓 𝑚𝑎𝑡𝑒𝑟𝑖𝑎𝑙 𝑒𝑛𝑡𝑒𝑟𝑖𝑛𝑔 𝑡ℎ𝑒 𝑠𝑡𝑒𝑝
𝑅𝑒𝑙𝑖𝑎𝑏𝑖𝑙𝑖𝑡𝑦 [%] =
𝑡𝑖𝑚𝑒 𝑒𝑞𝑢𝑖𝑝𝑚𝑒𝑛𝑡 𝑖𝑠 𝒏𝒐𝒕 𝒅𝒐𝒘𝒏 𝑑𝑢𝑒 𝑡𝑜 𝑒𝑞𝑢𝑖𝑝𝑚𝑒𝑛𝑡 𝑓𝑎𝑖𝑙𝑢𝑟𝑒𝑠
𝑡𝑜𝑡𝑎𝑙 𝑡𝑖𝑚𝑒 𝑎𝑣𝑎𝑖𝑙𝑎𝑏𝑙𝑒
1. 2. Value Stream Mapping Symbols 3. 4. 5.](https://image.slidesharecdn.com/e121value-stream-mapping-final-web-161121103757/75/E12-1-value-stream-mapping-final-web-24-2048.jpg)


![Step 4: Determine Key Metrics (1)
UNIDO│IAMC Toolkit│Images may not be copied, transmitted or manipulated 45
For the summary metrics box:
Sum of individual process metrics
Total cycle time: Sum of all (process step) cycle times
Value-Added Time, VAT: Total time spent on value-added
activities
Non-Value-Added Time, NVAT: Total time spent on non-
value-added activities
VAT and NVAT are measured directly from the process
𝑇𝑜𝑡𝑎𝑙 𝑐𝑦𝑐𝑙𝑒 𝑡𝑖𝑚𝑒 𝑚𝑖𝑛 = 𝑉𝐴𝑇 𝑚𝑖𝑛 + 𝑁𝑉𝐴𝑇 [𝑚𝑖𝑛]
NVAT = 2.39 days
VAT = 97 secs.
PCE = 0.15%
0.183 days
1. 2. 3. VSM Symbols 4. 5.1. 2. 3. Generating the Map 4. 5.](https://image.slidesharecdn.com/e121value-stream-mapping-final-web-161121103757/75/E12-1-value-stream-mapping-final-web-45-2048.jpg)
![Step 4: Determine Key Metrics (2)
UNIDO│IAMC Toolkit│Images may not be copied, transmitted or manipulated 46
Entire process performance indicators:
Process cycle efficiency (PCE): Value-added percentage
of the process
PCE[%] =
𝑉𝐴𝑇
𝑡𝑜𝑡𝑎𝑙 𝑐𝑦𝑐𝑙𝑒 𝑡𝑖𝑚𝑒
NVAT = 2.39 days
VAT = 97 secs.
PCE = 0.15%
25 secs 30 secs 42 secs
1 day 0.51 days 0.69 days 0.18 days
1. 2. 3. VSM Symbols 4. 5.1. 2. 3. Generating the Map 4. 5.](https://image.slidesharecdn.com/e121value-stream-mapping-final-web-161121103757/75/E12-1-value-stream-mapping-final-web-46-2048.jpg)
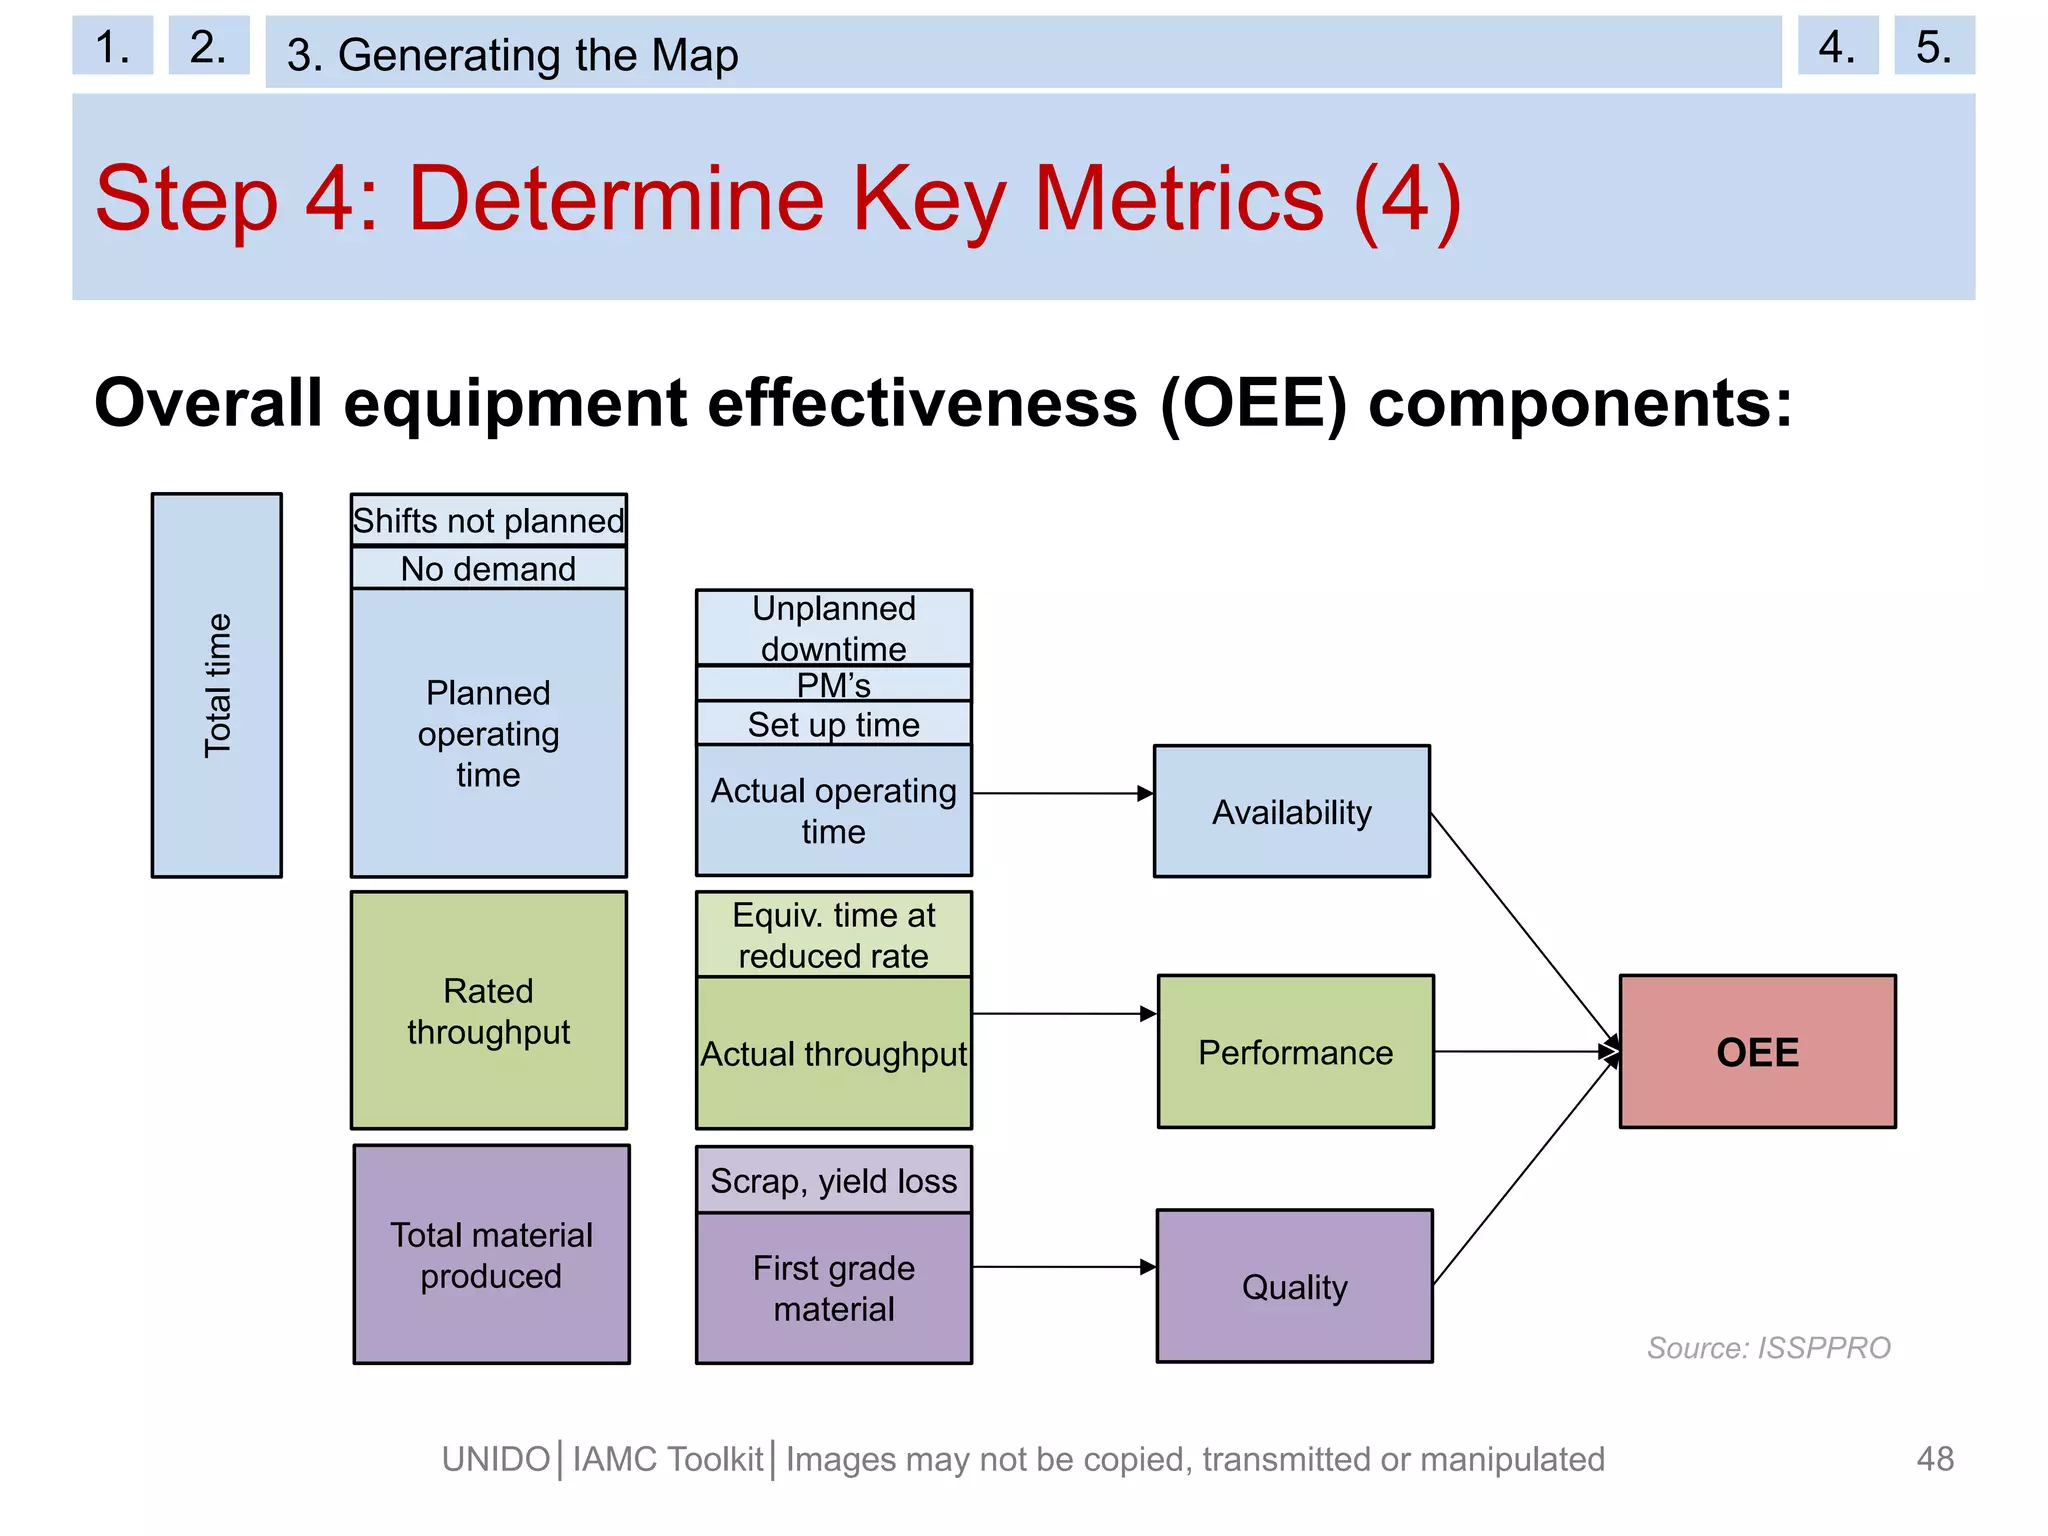
![Step 4: Determine Key Metrics (3)
UNIDO│IAMC Toolkit│Images may not be copied, transmitted or manipulated 47
Entire process performance indicators:
Overall equipment effectiveness (OEE): reflects all the
factors detracting from optimum equipment performance
𝑂𝐸𝐸 % = 𝐴𝑣𝑎𝑖𝑙𝑎𝑏𝑖𝑙𝑖𝑡𝑦 × 𝑃𝑒𝑟𝑓𝑜𝑟𝑚𝑎𝑛𝑐𝑒 × 𝑄𝑢𝑎𝑙𝑖𝑡𝑦
𝐴𝑣𝑎𝑖𝑙𝑎𝑏𝑖𝑙𝑖𝑡𝑦 [%] =
𝐴𝑐𝑡𝑢𝑎𝑙 𝑜𝑝𝑒𝑟𝑎𝑡𝑖𝑛𝑔 𝑡𝑖𝑚𝑒
𝑃𝑙𝑎𝑛𝑛𝑒𝑑 𝑜𝑝𝑒𝑟𝑎𝑡𝑖𝑛𝑔 𝑡𝑖𝑚𝑒
𝑃𝑒𝑟𝑓𝑜𝑟𝑚𝑎𝑛𝑐𝑒 % =
𝐴𝑐𝑡𝑢𝑎𝑙 𝑡ℎ𝑟𝑜𝑢𝑔ℎ𝑝𝑢𝑡
𝑃𝑙𝑎𝑛𝑛𝑒𝑑 𝑡ℎ𝑟𝑜𝑢𝑔ℎ𝑝𝑢𝑡
𝑄𝑢𝑎𝑙𝑖𝑡𝑦 [%] =
𝑄𝑢𝑎𝑛𝑡𝑖𝑡𝑦 𝑜𝑓 𝑓𝑖𝑟𝑠𝑡 𝑔𝑟𝑎𝑑𝑒 𝑚𝑎𝑡𝑒𝑟𝑖𝑎𝑙
𝑇𝑜𝑡𝑎𝑙 𝑞𝑢𝑎𝑛𝑡𝑖𝑡𝑦 𝑝𝑟𝑜𝑑𝑢𝑐𝑒𝑑
1. 2. 3. VSM Symbols 4. 5.1. 2. 3. Generating the Map 4. 5.](https://image.slidesharecdn.com/e121value-stream-mapping-final-web-161121103757/75/E12-1-value-stream-mapping-final-web-47-2048.jpg)


![ A-type process: Converging production process, typically
found in assembly plants (starting with a variety of raw
materials, producing a small amount of final products)
Batch size [units]: Amount of material produced as a single
lot
Changeover (C/O) losses [units]: Amount of material lost in
the change from one product to another
Changeover (C/O) time [min]: Time needed to change from
one product to another
Cycle rate/Effective capacity [units/min]: Reciprocal of
cycle time
Glossary (1)
UNIDO│IAMC Toolkit│Images may not be copied, transmitted or manipulated 62](https://image.slidesharecdn.com/e121value-stream-mapping-final-web-161121103757/75/E12-1-value-stream-mapping-final-web-62-2048.jpg)
![ Cycle time (C/T) [min/unit]: Time needed to produce a part
or lot; reflects equipment capacity
Effective capacity: See cycle rate
Every part every interval (EPEI) [days]: Time span over
which all product types are made
Future state map: A VSM presenting an optimized state
serving as target of all improvement activities
Lead time [min]: The time needed for one part or lot to
complete a specific process step
Glossary (2)
UNIDO│IAMC Toolkit│Images may not be copied, transmitted or manipulated 63](https://image.slidesharecdn.com/e121value-stream-mapping-final-web-161121103757/75/E12-1-value-stream-mapping-final-web-63-2048.jpg)
![ Maximum demonstrated rate [units/min]: Maximum
production capacity possible under specific process
equipment configuration; reciprocal of ideal cycle time
Non-value-added time (NVA time or NVAT) [min]: Total
time spent on non-value-added activities
Order lead time [days]: Time from replenishment order
until the material arrives
Overall equipment effectiveness (OEE) [%]: Measure
capturing all the factors detracting from optimum
equipment performance; comprising an availability factor, a
performance factor and a quality factor
Glossary (3)
UNIDO│IAMC Toolkit│Images may not be copied, transmitted or manipulated 64](https://image.slidesharecdn.com/e121value-stream-mapping-final-web-161121103757/75/E12-1-value-stream-mapping-final-web-64-2048.jpg)
![ PFD / Process flow diagram: Diagram visualizing the flow
of plant processes and the major equipment
Process cycle efficiency (PCE) [%]: Value-added
percentage of the process, calculated as VAT divided by
total cycle time
Reliability [%]: Measure of the steadiness of a machine;
percentage of time without any equipment failure
Shift schedule [h/week]: Number of hours per shift, shifts
per day and days per week
Stock keeping units (SKUs) [units]: Product varieties
entering or leaving a process step
Glossary (4)
UNIDO│IAMC Toolkit│Images may not be copied, transmitted or manipulated 65](https://image.slidesharecdn.com/e121value-stream-mapping-final-web-161121103757/75/E12-1-value-stream-mapping-final-web-65-2048.jpg)
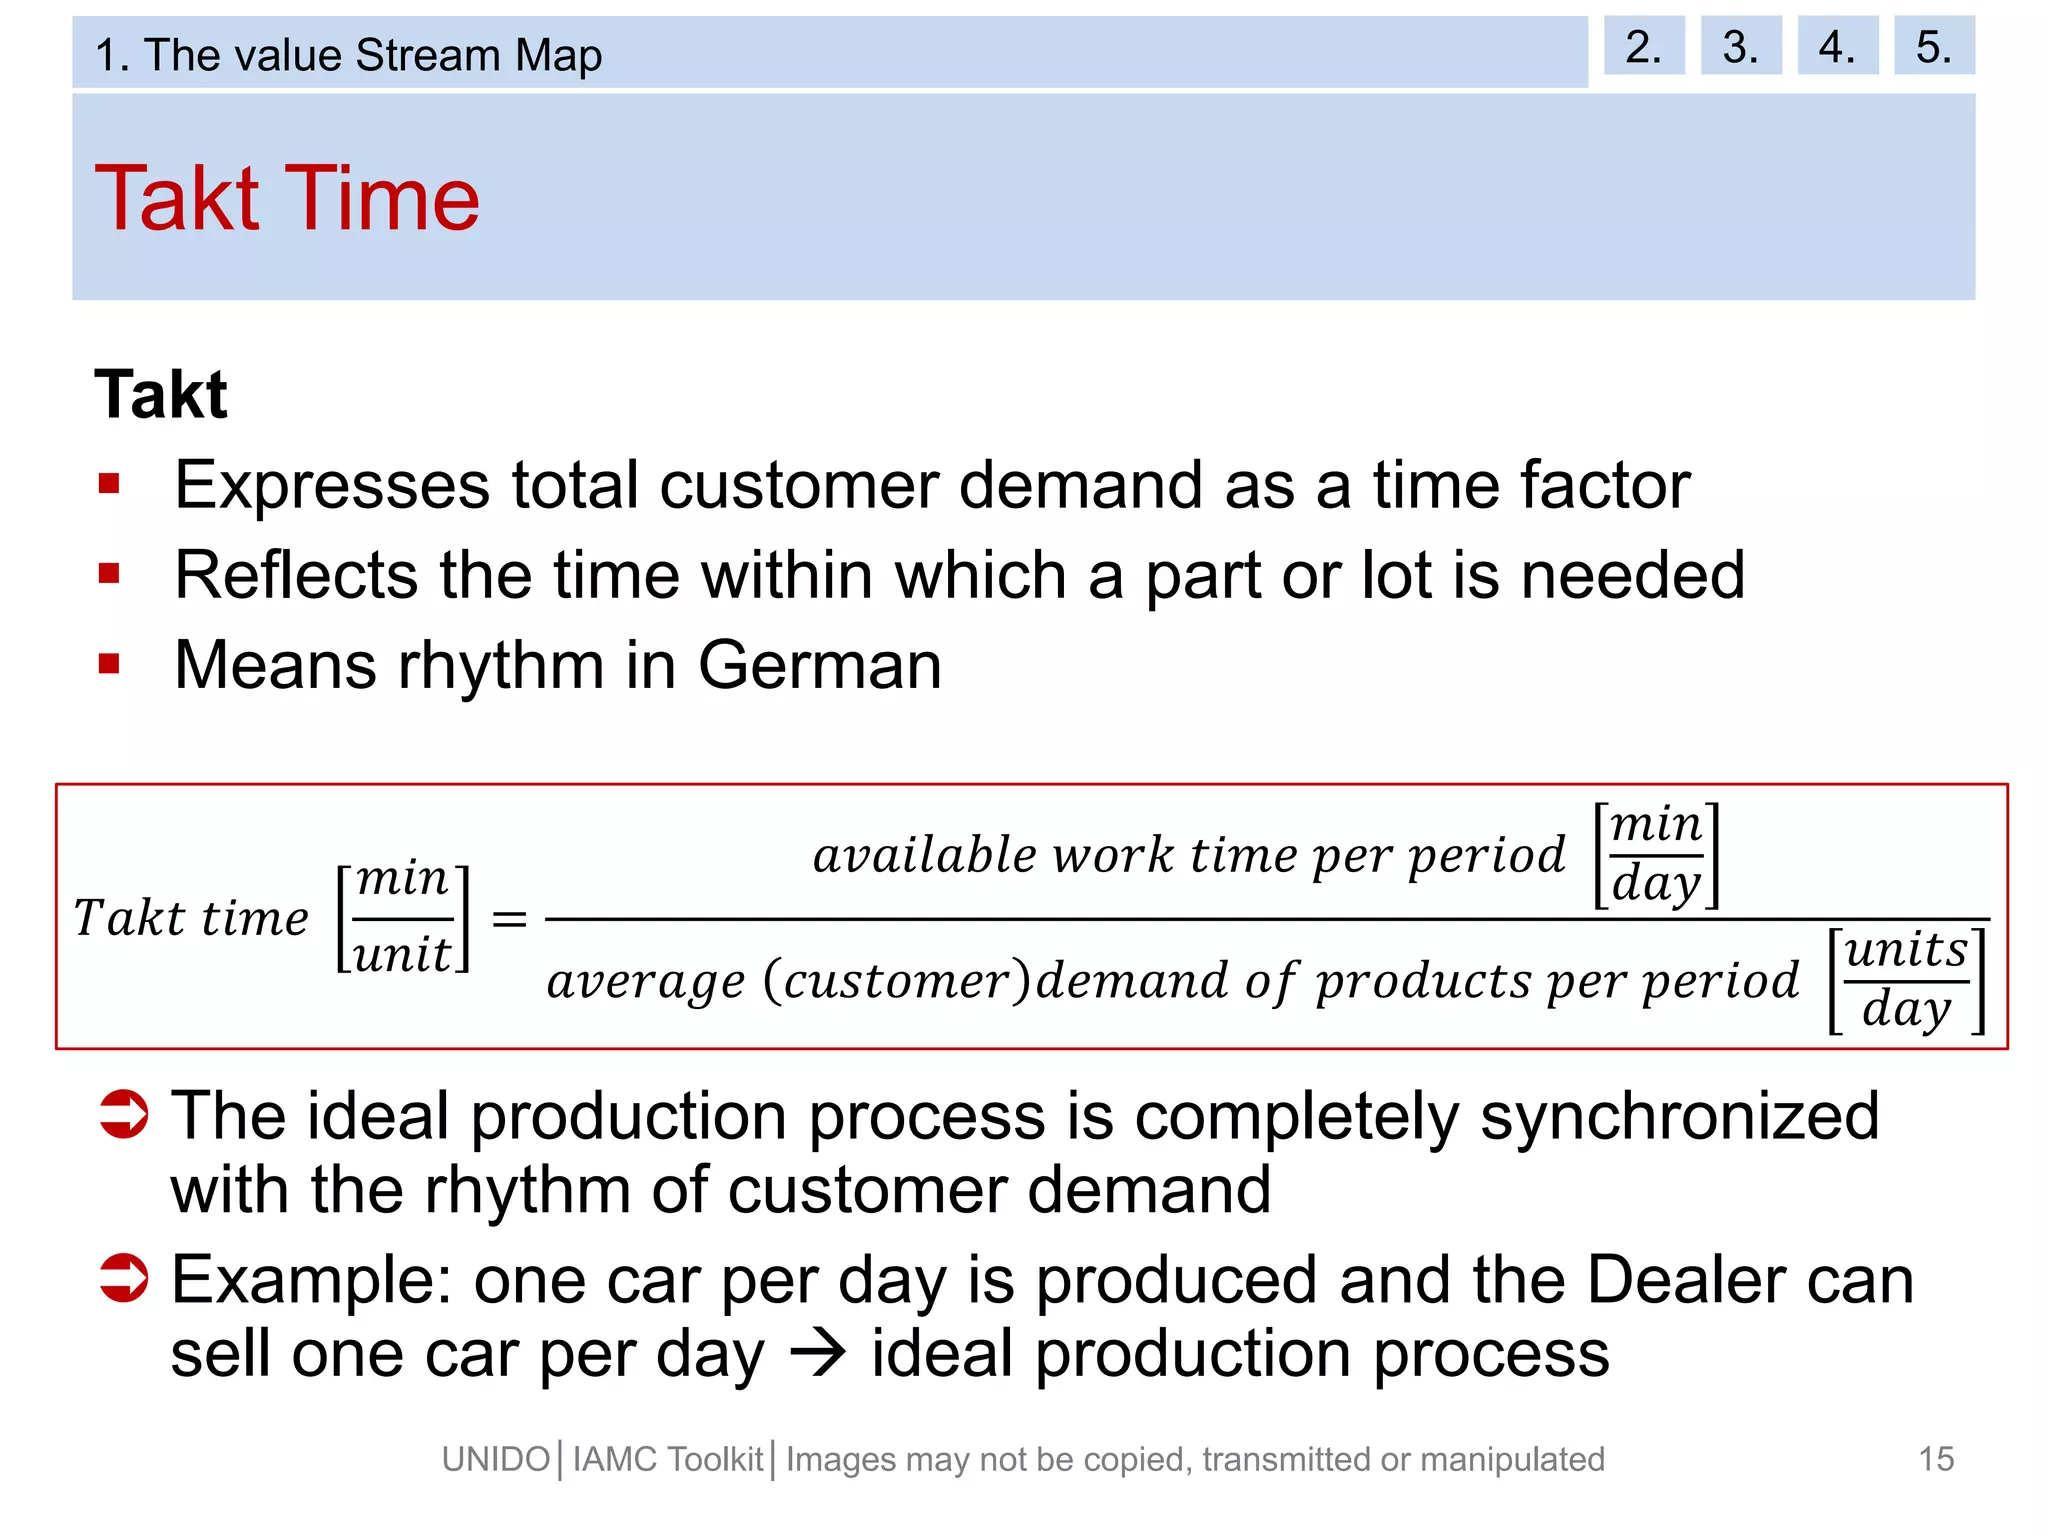
![ Takt rate [units/min]: Rate at which a part or lot is needed,
reciprocal of takt time
Takt time [min/unit]: Time within which a part or lot is
needed; calculated by dividing the time available in a
period by the average demand of products during this
period
Total cycle time: Sum of all (process step) cycle times;
calculated by adding VAT and NVAT
Uptime [%]: Measure reflecting all sorts of time lost;
calculated as net operating time divided by available
operating time
Glossary (5)
UNIDO│IAMC Toolkit│Images may not be copied, transmitted or manipulated 66](https://image.slidesharecdn.com/e121value-stream-mapping-final-web-161121103757/75/E12-1-value-stream-mapping-final-web-66-2048.jpg)
![ Utilization [%]: Measure for how fully utilized a process
step is; calculated by dividing cycle time by takt time or
takt rate by effective capacity
Value Stream Map (VSM): Visual tool used to identify the
current flow of material and information throughout a
production process
Value-added time (VA time or VAT) [min]: Total time spent
on value-added activities
V-type process: diverging production process, typically
found in process industries (starting from a small number
of raw materials, producing a wide range of different final
products)
Glossary (6)
UNIDO│IAMC Toolkit│Images may not be copied, transmitted or manipulated 67](https://image.slidesharecdn.com/e121value-stream-mapping-final-web-161121103757/75/E12-1-value-stream-mapping-final-web-67-2048.jpg)
![ Work in Progress (WIP, also Work in Process) [units]: all
materials and partially finished goods within the production
process waiting to be completed
Yield [%]: Percentage of good parts leaving a process step
Glossary (7)
UNIDO│IAMC Toolkit│Images may not be copied, transmitted or manipulated 68](https://image.slidesharecdn.com/e121value-stream-mapping-final-web-161121103757/75/E12-1-value-stream-mapping-final-web-68-2048.jpg)