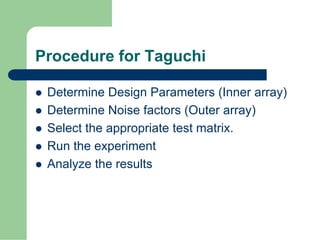
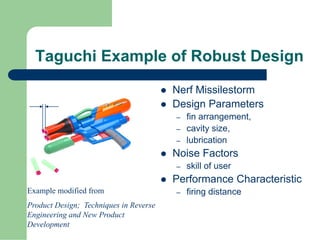
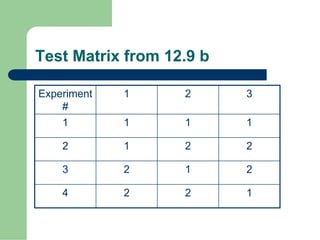
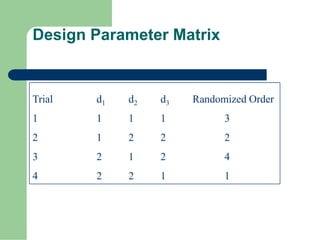
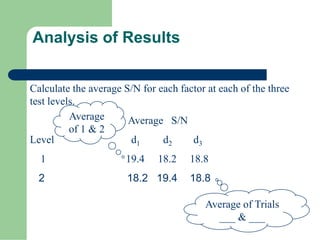
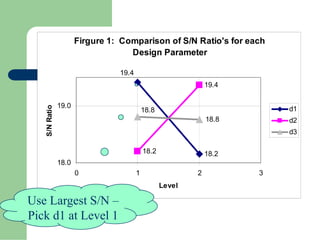
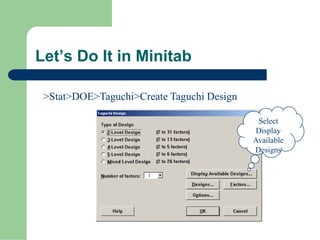
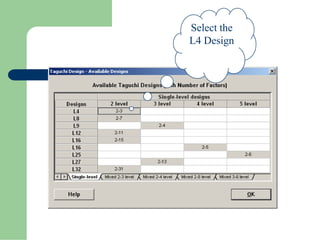
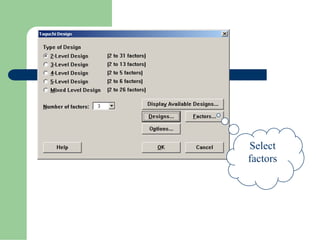
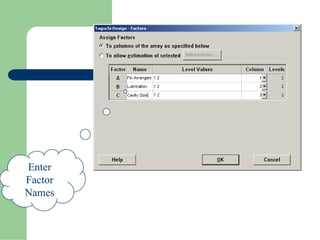
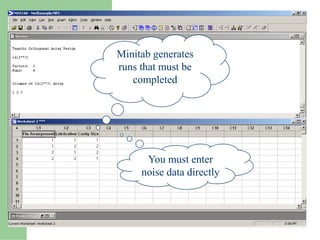
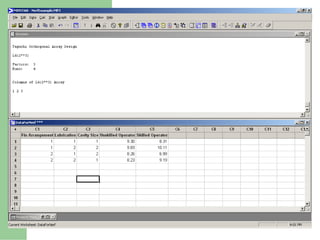
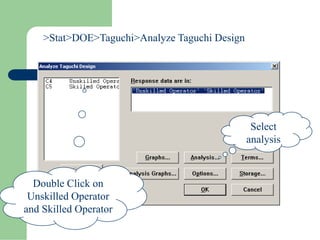
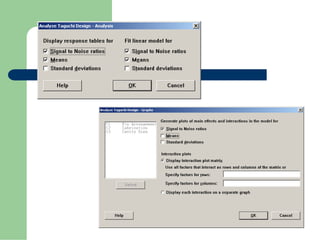
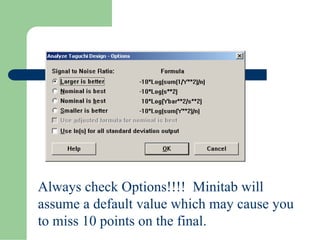
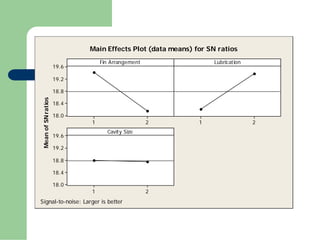
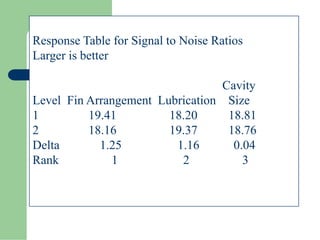
This document discusses the principles and methods of robust design. It defines robustness as a product or process being minimally affected by sources of variation. Taguchi methods are presented for designing products and processes that are robust, including parameter design to optimize the signal-to-noise ratio. An example applies Taguchi methods to the design of a Nerf missile to maximize firing distance while minimizing the impact of noise factors like user skill level. The results of the experiment are analyzed using Minitab to identify the optimal settings for the design parameters to achieve the most robust performance.
PPT ON TAGUCHI METHODS / TECHNIQUES - KAUSTUBH BABREKARKaustubh Babrekar
A brief brief to Taguchi Methods / Techniques; Loss function; Orthogonal arrays; Fractional Factprials and various case studies and examples related to each topic covered in detail.
PPT presented by Kaustubh Babrekar under the guidance of Prof. Dr. N. G. Phafat. MGM JNEC Aurangabad.
Taguchi Method is a new engineering design optimisation methodology that improves the quality of existing products and processes and simultaneously reduces their costs very rapidly, with minimum engineering resources and development man-hours
Chapter 1
1.1 Introduction 5
1.2 Definitions of quality 6
1.2.1 Traditional and Taguchi definition of Quality 7
1.3 Taguchi’s quality philosophy 8
1.4 Objective of Taguchi Methods 10
1.5 8-Steps in Taguchi Methodology 10
Chapter 2 (Loss Function)
2.1 Taguchi Loss Function 11
2.2 Variation of Quadratic Loss function 17 Chapter 3 (Analysis of Variation)
3.1 Understanding Variation 19
3.2 What is ANOVA 19
3.2.1 No Way ANOVA 19
3.2. 1.1 Degree of Freedom 20
3.2.2 One Way ANOVA 24
3.2.3 Two Way ANOVA 30
3.3 Example of ANOVA 36
Chapter 4 (Orthogonal Array)
4.1 What is Array 46
4.2 History of Array 46
4.3 Introduction of Orthogonal Array 47
4.3.1 Intersecting many factor- A case study 49
4.3.1.1 Example of Orthogonal Array 50
4.3.2 A Full factorial Experiment 58
4.4 Steps in developing Orthogonal Array 60
4.4.1 Selection of factors and/or interactions to be evaluated 60
4.4.2 Selection of number of levels for the factors 60
4.4.3 Selection of the appropriate OA 62
4.4.4 Assignment of factors and/or interactions to columns 63
4.4.5 Conduct tests 65
4.4.6 Analyze results 66
4.4.7 Confirmation experiment 69
4.5 Example Experimental Procedure
Introduction to Quality Engineering / Quality ControlAFAQAHMED JAMADAR
Quality Control Introduction,
Definition and concept of quality,
Quality control,
Set up policy and objectives of quality control
Quality of design and quality of conformance
Compromise between quality & cost
Quality cost and planning for quality
Cost of Quality is a widely spread and widely misunderstood concept.Here is a presentation that will evaporate all your doubts regarding this topic.A very well explained case study of H&S motors.It is a very well structured presentation.
QFD (Quality Function Deployment) introduction,
Concept of QFD, History of QFD, Traditional systems & Development of QFD, Technical story as for QFD, Scope of QFD, Benefits of QFD, where does QFD fits, when to use QFD, House of quality (HOQ) model in QFD, relationship matrix of QFD, QFD overview, References, Conclusion
Control Charts for variables Xbar and R chart and attributes P, nP, C, and u ...Dr.Raja R
Control Charts for variables Xbar and R chart
and attributes P, nP, C, and u charts, Variables Control Charts,X bar chart using R chart or X bar chart using s chart, X & MR (moving range) chart, Attributes Control Charts,
A presentation on the continuous improvement tool of total quality management, i.e. PDCA- Plan,Do,Check,Act. Covers the basics of PDCA to give an idea on it's need, use, methodology etc. The presentation will help the beginners gain knowledge about the PDCA cycle and will cover their basic needs on it.
Priekšlikumi obligātās veselības apdrošināšanas ieviešanai LatvijāLatvijas Banka
Latvijas Bankas Monetārās politikas pārvaldes vadītāja Ulda Rutkastes prezentācija "Priekšlikumi obligātās veselības apdrošināšanas ieviešanai Latvijā", kas tika demonstrēta 2016. gada 28. septembrī Latvijas Bankas rīkotajā tautsaimniecības konferencē "Reformas – konkurētspējas un izaugsmes atslēga".
El 7è Simposi sobre Salut, Medicina, i Esport d'enguany està dedicat a la mort sobtada a l'esport. El director de l'Àrea de Praxi del COMB, Dr. Josep Arimany, explica en la seva presetanció els aspectes medicolegas.
A Visual Guide to Design of Experiments using Quantum XLRamon Balisnomo
An introductory course on developing transfer functions through Design of Experiment (DOE) using the statistical software Quantum XL (QXL). The presentation's purpose is to: (1) give practical advice on the trade-off between the required number of experiments and the accuracy of the transfer function; (2) showcase the user interface for Quantum XL, which integrates DOE and Monte Carlo seamlessly in one package.
dxDOE design of experiment for students.ppttenadrementees
Text on statistics which can be used by students and professionals. This covers more topics which are relevant to professionals in the field who need the knowledge"
Statistics is not just a subject confined to textbooks; it's a powerful tool that permeates every aspect of our lives. Whether you're a student embarking on your academic journey or a seasoned professional navigating the complexities of your field, a solid understanding of statistics is indispensable. That's where this comprehensive text comes in.
From the foundational principles to advanced techniques, this text is designed to equip both students and professionals with the knowledge and skills necessary to harness the full potential of statistics. We start by laying the groundwork with essential concepts such as probability theory, random variables, and descriptive statistics. Through clear explanations and illustrative examples, we ensure that readers grasp these fundamental building blocks with ease.
But statistics is not just about crunching numbers; it's about making sense of data and drawing meaningful insights. That's why we delve into inferential statistics, exploring hypothesis testing, confidence intervals, and regression analysis. By learning how to infer conclusions from sample data, readers gain the ability to make informed decisions and predictions based on statistical evidence.
But the journey doesn't stop there. We go beyond the basics to cover advanced topics that are crucial for professionals in today's data-driven world. Multivariate analysis, time series analysis, and Bayesian statistics are just a few of the advanced techniques that readers will master, providing them with the tools to tackle complex problems and extract deeper insights from data.
What sets this text apart is its emphasis on real-world relevance. Each chapter is carefully crafted to bridge the gap between theory and practice, with practical examples and case studies drawn from a wide range of industries and disciplines. Whether you're working in finance, healthcare, marketing, or any other field, you'll find that the principles and techniques covered in this text are directly applicable to your day-to-day work.
Moreover, we recognize that proficiency in statistical software is essential for modern professionals. That's why we include discussions on popular tools such as R, Python, and SPSS, empowering readers to analyze data efficiently and effectively. With hands-on exercises and tutorials, readers can develop their skills in data analysis and visualization, gaining practical experience that will serve them well in their careers.
In sum, this text is more than just a book; it's a comprehensive guide to mastering the art and science of statistics. Whether you're a student seeking to build a strong foundation or a professional looking to expand your analytical toolkit, this text has everything you need to succeed in today's data-driven world. With its clear explanations, practical examples.
Empowering the Unbanked: The Vital Role of NBFCs in Promoting Financial Inclu...Vighnesh Shashtri
In India, financial inclusion remains a critical challenge, with a significant portion of the population still unbanked. Non-Banking Financial Companies (NBFCs) have emerged as key players in bridging this gap by providing financial services to those often overlooked by traditional banking institutions. This article delves into how NBFCs are fostering financial inclusion and empowering the unbanked.
how to sell pi coins at high rate quickly.DOT TECH
Where can I sell my pi coins at a high rate.
Pi is not launched yet on any exchange. But one can easily sell his or her pi coins to investors who want to hold pi till mainnet launch.
This means crypto whales want to hold pi. And you can get a good rate for selling pi to them. I will leave the telegram contact of my personal pi vendor below.
A vendor is someone who buys from a miner and resell it to a holder or crypto whale.
Here is the telegram contact of my vendor:
@Pi_vendor_247
Even tho Pi network is not listed on any exchange yet.
Buying/Selling or investing in pi network coins is highly possible through the help of vendors. You can buy from vendors[ buy directly from the pi network miners and resell it]. I will leave the telegram contact of my personal vendor.
@Pi_vendor_247
Falcon stands out as a top-tier P2P Invoice Discounting platform in India, bridging esteemed blue-chip companies and eager investors. Our goal is to transform the investment landscape in India by establishing a comprehensive destination for borrowers and investors with diverse profiles and needs, all while minimizing risk. What sets Falcon apart is the elimination of intermediaries such as commercial banks and depository institutions, allowing investors to enjoy higher yields.
how can I sell pi coins after successfully completing KYCDOT TECH
Pi coins is not launched yet in any exchange 💱 this means it's not swappable, the current pi displaying on coin market cap is the iou version of pi. And you can learn all about that on my previous post.
RIGHT NOW THE ONLY WAY you can sell pi coins is through verified pi merchants. A pi merchant is someone who buys pi coins and resell them to exchanges and crypto whales. Looking forward to hold massive quantities of pi coins before the mainnet launch.
This is because pi network is not doing any pre-sale or ico offerings, the only way to get my coins is from buying from miners. So a merchant facilitates the transactions between the miners and these exchanges holding pi.
I and my friends has sold more than 6000 pi coins successfully with this method. I will be happy to share the contact of my personal pi merchant. The one i trade with, if you have your own merchant you can trade with them. For those who are new.
Message: @Pi_vendor_247 on telegram.
I wouldn't advise you selling all percentage of the pi coins. Leave at least a before so its a win win during open mainnet. Have a nice day pioneers ♥️
#kyc #mainnet #picoins #pi #sellpi #piwallet
#pinetwork
how to sell pi coins on Bitmart crypto exchangeDOT TECH
Yes. Pi network coins can be exchanged but not on bitmart exchange. Because pi network is still in the enclosed mainnet. The only way pioneers are able to trade pi coins is by reselling the pi coins to pi verified merchants.
A verified merchant is someone who buys pi network coins and resell it to exchanges looking forward to hold till mainnet launch.
I will leave the telegram contact of my personal pi merchant to trade with.
@Pi_vendor_247
If you are looking for a pi coin investor. Then look no further because I have the right one he is a pi vendor (he buy and resell to whales in China). I met him on a crypto conference and ever since I and my friends have sold more than 10k pi coins to him And he bought all and still want more. I will drop his telegram handle below just send him a message.
@Pi_vendor_247
USDA Loans in California: A Comprehensive Overview.pptxmarketing367770
USDA Loans in California: A Comprehensive Overview
If you're dreaming of owning a home in California's rural or suburban areas, a USDA loan might be the perfect solution. The U.S. Department of Agriculture (USDA) offers these loans to help low-to-moderate-income individuals and families achieve homeownership.
Key Features of USDA Loans:
Zero Down Payment: USDA loans require no down payment, making homeownership more accessible.
Competitive Interest Rates: These loans often come with lower interest rates compared to conventional loans.
Flexible Credit Requirements: USDA loans have more lenient credit score requirements, helping those with less-than-perfect credit.
Guaranteed Loan Program: The USDA guarantees a portion of the loan, reducing risk for lenders and expanding borrowing options.
Eligibility Criteria:
Location: The property must be located in a USDA-designated rural or suburban area. Many areas in California qualify.
Income Limits: Applicants must meet income guidelines, which vary by region and household size.
Primary Residence: The home must be used as the borrower's primary residence.
Application Process:
Find a USDA-Approved Lender: Not all lenders offer USDA loans, so it's essential to choose one approved by the USDA.
Pre-Qualification: Determine your eligibility and the amount you can borrow.
Property Search: Look for properties in eligible rural or suburban areas.
Loan Application: Submit your application, including financial and personal information.
Processing and Approval: The lender and USDA will review your application. If approved, you can proceed to closing.
USDA loans are an excellent option for those looking to buy a home in California's rural and suburban areas. With no down payment and flexible requirements, these loans make homeownership more attainable for many families. Explore your eligibility today and take the first step toward owning your dream home.
Introduction to Indian Financial System ()Avanish Goel
The financial system of a country is an important tool for economic development of the country, as it helps in creation of wealth by linking savings with investments.
It facilitates the flow of funds form the households (savers) to business firms (investors) to aid in wealth creation and development of both the parties
how to sell pi coins effectively (from 50 - 100k pi)DOT TECH
Anywhere in the world, including Africa, America, and Europe, you can sell Pi Network Coins online and receive cash through online payment options.
Pi has not yet been launched on any exchange because we are currently using the confined Mainnet. The planned launch date for Pi is June 28, 2026.
Reselling to investors who want to hold until the mainnet launch in 2026 is currently the sole way to sell.
Consequently, right now. All you need to do is select the right pi network provider.
Who is a pi merchant?
An individual who buys coins from miners on the pi network and resells them to investors hoping to hang onto them until the mainnet is launched is known as a pi merchant.
debuts.
I'll provide you the Telegram username
@Pi_vendor_247
2. Why Bother?
Customers will pay for
increased quality!
Customers will be loyal
for increased quality!
3. Taguchi Case Study
In 1980s, Ford outsourced the construction
of a subassembly to several of its own
plants and to a Japanese manufacturer.
Both US and Japan plants produced parts
that conformed to specification (zero
defects)
Warranty claims on US built products was
far greater!!!
The difference? Variation
Japanese product was far more consistent!
4. Results from Less Variation
Better performance
Lower costs due to less scrap, less rework and
less inventory!
Lower warranty costs
6. Taguichi’s Loss Function
Quality Level = total loss All products suffer some
incurred by society due to loss
the failure of the product The smaller the loss the
to deliver the expected better
performance + harmful Emphasis shifts from being
side effects (including within a range to
operating cost) achieving the target
value
7. L( y) = k ( y − m) 2
(12.7)
L(y) is the quality lost (often measured in$)
y is value of the quality characteristic
m is the target value for y
k is the quality loss coefficient
8. Variations of the quadratic loss
function
Nominal is best (Figure 12.6)
Smaller the better (Figure 12.6)
Larger the better (Figure 12.6)
An asymmetric relationship (we won’t worry
about this)
9. Noise
Output variability Input variability
– Variational noise is the – Tolerances are design
short term, unit to unit factor variability
variation due to – Outer noise represents
manufacturing processes variations in disturbance
– Inner noise is the long- factors such as
term change in product temperature, humidity,
characteristics over time dust, etc
10. Signal to noise ratio
Attempts to control the variation with respect
to both the mean and the variation about the
mean.
Appropriate S/N ratios are given in equation
12.12, 12.13, and 12.14 for nominal is best,
smaller is best, and larger is best. Be careful
that you use the correct equation.
The HIGHER the S/N ratio, the better!
11. Definition of Robust Design
Robustness is defined as a condition in which the product
or process will be minimally affected by sources of
variation.
A product can be robust:
Against variation in raw materials
Against variation in manufacturing conditions
Against variation in manufacturing personnel
Against variation in the end use environment
` Against variation in end-users
Against wear-out or deterioration
12. Back to M&M’s®
The making of M&M's® Milk Chocolates begins with milk chocolate centers,
which are formed in a machine and then quot;tumbledquot; in order to obtain a
smooth, rounded center.
What follows is a process known as quot;panningquot;. Panning involves coating the
chocolates by rotating them in a coating material in a revolving pan.
Panning can be done using syrups and other materials such as chocolate,
fats etc. The principle, briefly, is to coat the center with a layer of
materials, which on evaporation leaves an even layer or shell of dry
substance. The chocolate centers are color coated by rotating them in a
revolving pan, while a sugar and corn syrup mixture is added. This
process is repeated several times until M&M's® have a thin, smooth shell
with the desired thickness.
Then, the machine specially designed for the purpose gently imprints an 'm'
on the surface of the fragile, crispy, colorful shell without cracking the
shell.
14. Parameter Design
Taguchi recommends parameter design to get
the best S/N ratio. If parameter design is not
sufficient, then tolerance design may be used.
Look for two types of design factors
– control factors affect the S/N ratio, but not the mean
– signal factors affect primarily the mean
Taguchi creates a design parameter matrix and
a noise matrix
15. Parameter Design
The book has an excellent example in Section
12.6.1
If tolerance design is necessary, typically
ANOVA is used to determine the relative
contribution of each control parameter
Some STATISTICIANS hate Taguchi!!
But Taguchi is used by many companies!!
16. Design Resolution
Full factorial vs. fractional factorial
In our DOE experiment, we used a full factorial.
This can become costly as the number of
variables or levels increases.
As a result, statisticians use fractional factorials.
As you might suspect, you do not get as much
information from a fractional factorial.
17. Fractional Factorials
A Fractional Factorial Design is a factorial design
in which all possible treatment combinations of
the factors are NOT run. The runs are just a
FRACTION of the full factorial matrix. The
resulting design matrix will not be able to
estimate some of the effects, often the
interaction effects. Minitab and your statistics
textbook will tell you the form necessary for
fractional factorials.
18. Design Resolution
Resolution V (Best)
– Main effects are confounded with 4-way interactions
– 2-way interactions are confounded with 3-way interactions
Resolution IV
– Main effects are confounded with 3-way interactions
– 2-way interactions are confounded with other 2-way
interactions
Resolution III (many Taguchi arrays)
– Main effects are confounded with 2-way interactions
– 2-way interactions may be confounded with other 2-ways
19. Test Schedules Available in Text
Figure 12. 9 (a) L9 experimental design for 4
control factors, each at three levels.
Figure 12.9 (b) L4 experimental design for 3
factors each at 2 levels.
Example 12.6 Three output temperatures,
each at three levels. Use Figure 12.9 (a) and
omit a column.
20. Procedure for Taguchi
Determine Design Parameters (Inner array)
Determine Noise factors (Outer array)
Select the appropriate test matrix.
Run the experiment
Analyze the results
21. Taguchi Example of Robust Design
Nerf Missilestorm
Design Parameters
– fin arrangement,
– cavity size,
– lubrication
Noise Factors
– skill of user
Performance Characteristic
Example modified from – firing distance
Product Design; Techniques in Reverse
Engineering and New Product
Development
22. Form the inner array or the
design parameter matrix
Design parameters (2 ) High (1) Low
d1 is the fin arrangement Angled fins Straight
d2 is the lubrication Graphite powder None
d3 is the cavity size 0 cm 3 cm
Determine the Required Number of Experiments:
One degree of freedom is associated with the overall mean. Next we
add the degrees of freedom associated with each design parameter: (#
of levels of design parameters)*(# of design parameters).
For our case =3*(2-1) or 3. Therefore, we must run at least 1+3 tests.
Test schedules may be found in different texts. We will only use the
ones in our book or Minitab.
23. Test Matrix from 12.9 b
Experiment 1 2 3
#
1 1 1 1
2 1 2 2
3 2 1 2
4 2 2 1
25. Outer array, Noise Factor matrix
Since there is only one Noise Factor in this experiment,
we have a column matrix.
n1
1 Unskilled Operator
2 Skilled Operator
We will have to conduct 8 experiments. Each experiment
will have to be conducted at both levels of the noise factor.
27. Calculate S/N ratio for each row
Because we want to maximize distance, we use Equation 12.14.
1 1
S / N = −10 * log( ∑ 2 )
n y i
So for Trial 1,
1 1 1
S / N = −10 * log( ( 2 + 2
))
2 9.3 8.31
28. Signal to Noise Ratios for Maximum
Distance Tests
Trial # S/N
1 18.85
2 19.97
3 17.55
4 18.76
29. Analysis of Results
Calculate the average S/N for each factor at each of the three
test levels.
Average Average S/N
of 1 & 2
Level d1 d2 d3
1 19.4 18.2 18.8
2 18.2 19.4 18.8
Average of Trials
___ & ___
30. Firgure 1: Comparison of S/N Ratio's for each
Design Parameter
19.4
19.4
19.0
S/N Ratio
18.8 d1
18.8 d2
d3
18.2 18.2
18.0
0 1 2 3
Level
Use Largest S/N –
Pick d1 at Level 1
31. Let’s Do It in Minitab
>Stat>DOE>Taguchi>Create Taguchi Design
Select
Display
Available
Designs
39. Always check Options!!!! Minitab will
assume a default value which may cause you
to miss 10 points on the final.
40. Main Effects Plot (data means) for SN ratios
Fin Arrangement Lubrication
19.6
19.2
18.8
Mean of SN ratios
18.4
18.0
1 2 1 2
Cavity Size
19.6
19.2
18.8
18.4
18.0
1 2
Signal-to-noise: Larger is better
41. Response Table for Signal to Noise Ratios
Larger is better
Cavity
Level Fin Arrangement Lubrication Size
1 19.41 18.20 18.81
2 18.16 19.37 18.76
Delta 1.25 1.16 0.04
Rank 1 2 3
42. Homework: Due Monday, October 30
Individual Assignment
12.9 from Dieter by hand
Modified 12.11 must be done using Minitab