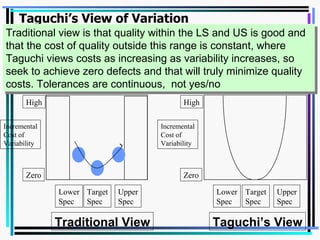
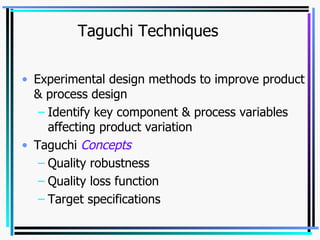
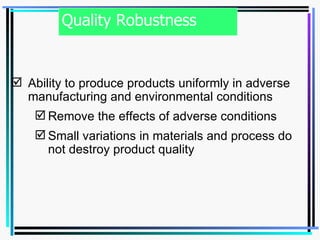
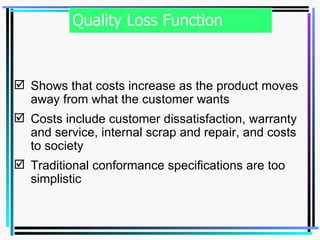
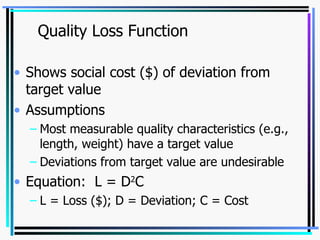
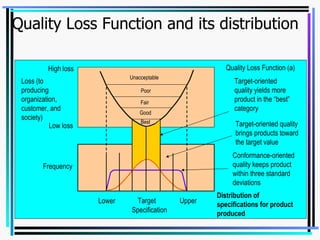
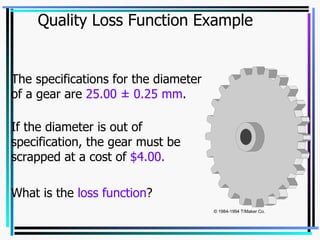
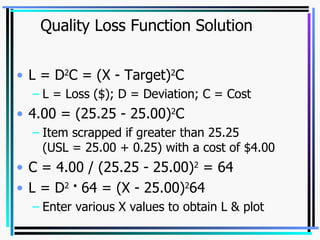
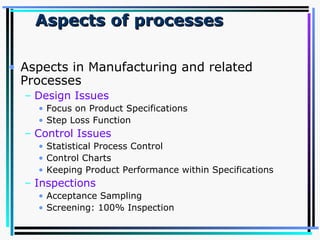
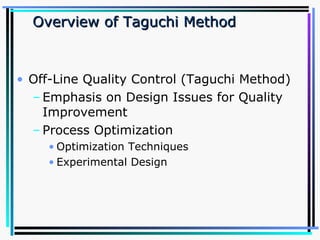
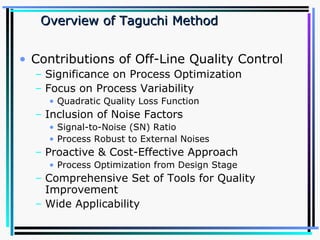
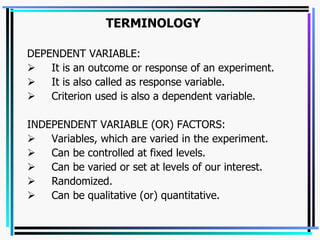
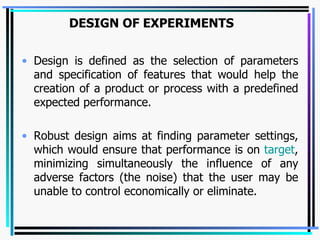
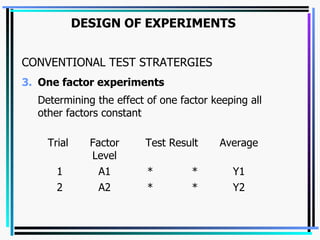
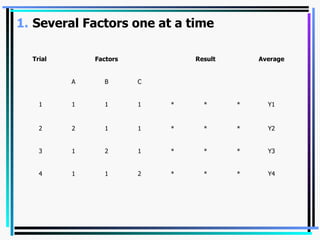
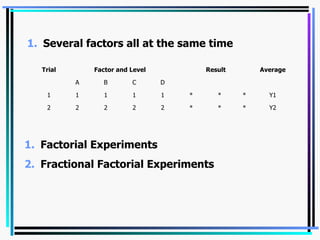
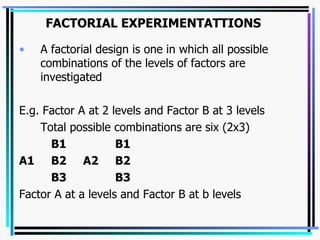
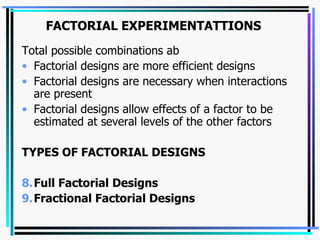
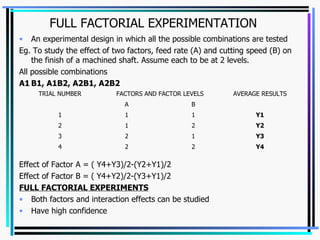
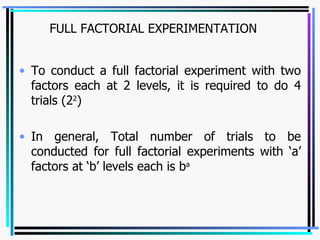
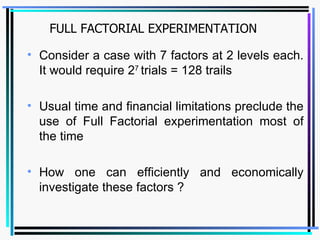
The document discusses design of experiments (DOE) and Taguchi methods. It explains key concepts in Taguchi's approach such as quality robustness, quality loss function, and target specifications. Taguchi techniques use experimental design methods to identify important variables affecting a product or process and optimize the design. The document provides examples of full and fractional factorial experiments to study the effects of multiple factors and interactions. It emphasizes the importance of considering interactions between factors rather than just main effects.
![Operations Management-II Dr. S.Venkataramanaiah Assistant Professor OM & QT Area IIM Indore, Pigdamber, Rau Indore- 453 331 Email : [email_address]](https://image.slidesharecdn.com/om-36060-24887/85/om-1-320.jpg)
![Operations Management-II Dr. S.Venkataramanaiah Assistant Professor OM & QT Area IIM Indore, Pigdamber, Rau Indore- 453 331 Email : [email_address]](https://image.slidesharecdn.com/om-36060-24887/75/om-1-2048.jpg)
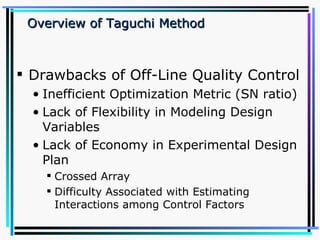
![FACTORIAL DESIGNS MAIN EFFECT : Change in response produced by a change in the level of the factor B A FIG. 1 FIG. 2 FIG 1 Avg. effect of A = [(40-20)+(52 –30)]/2 = 21 Avg. effect of B = [(52-40)+(30-20)]/2 = 11 B A L L H H . . . . 20 40 50 12 L L H H . . . . 20 40 30 52](https://image.slidesharecdn.com/om-36060-24887/85/om-45-320.jpg)