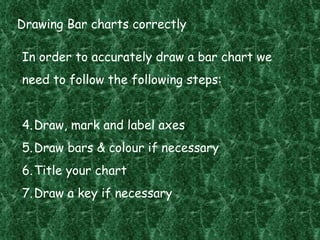
To accurately draw a bar chart, one must follow four steps:
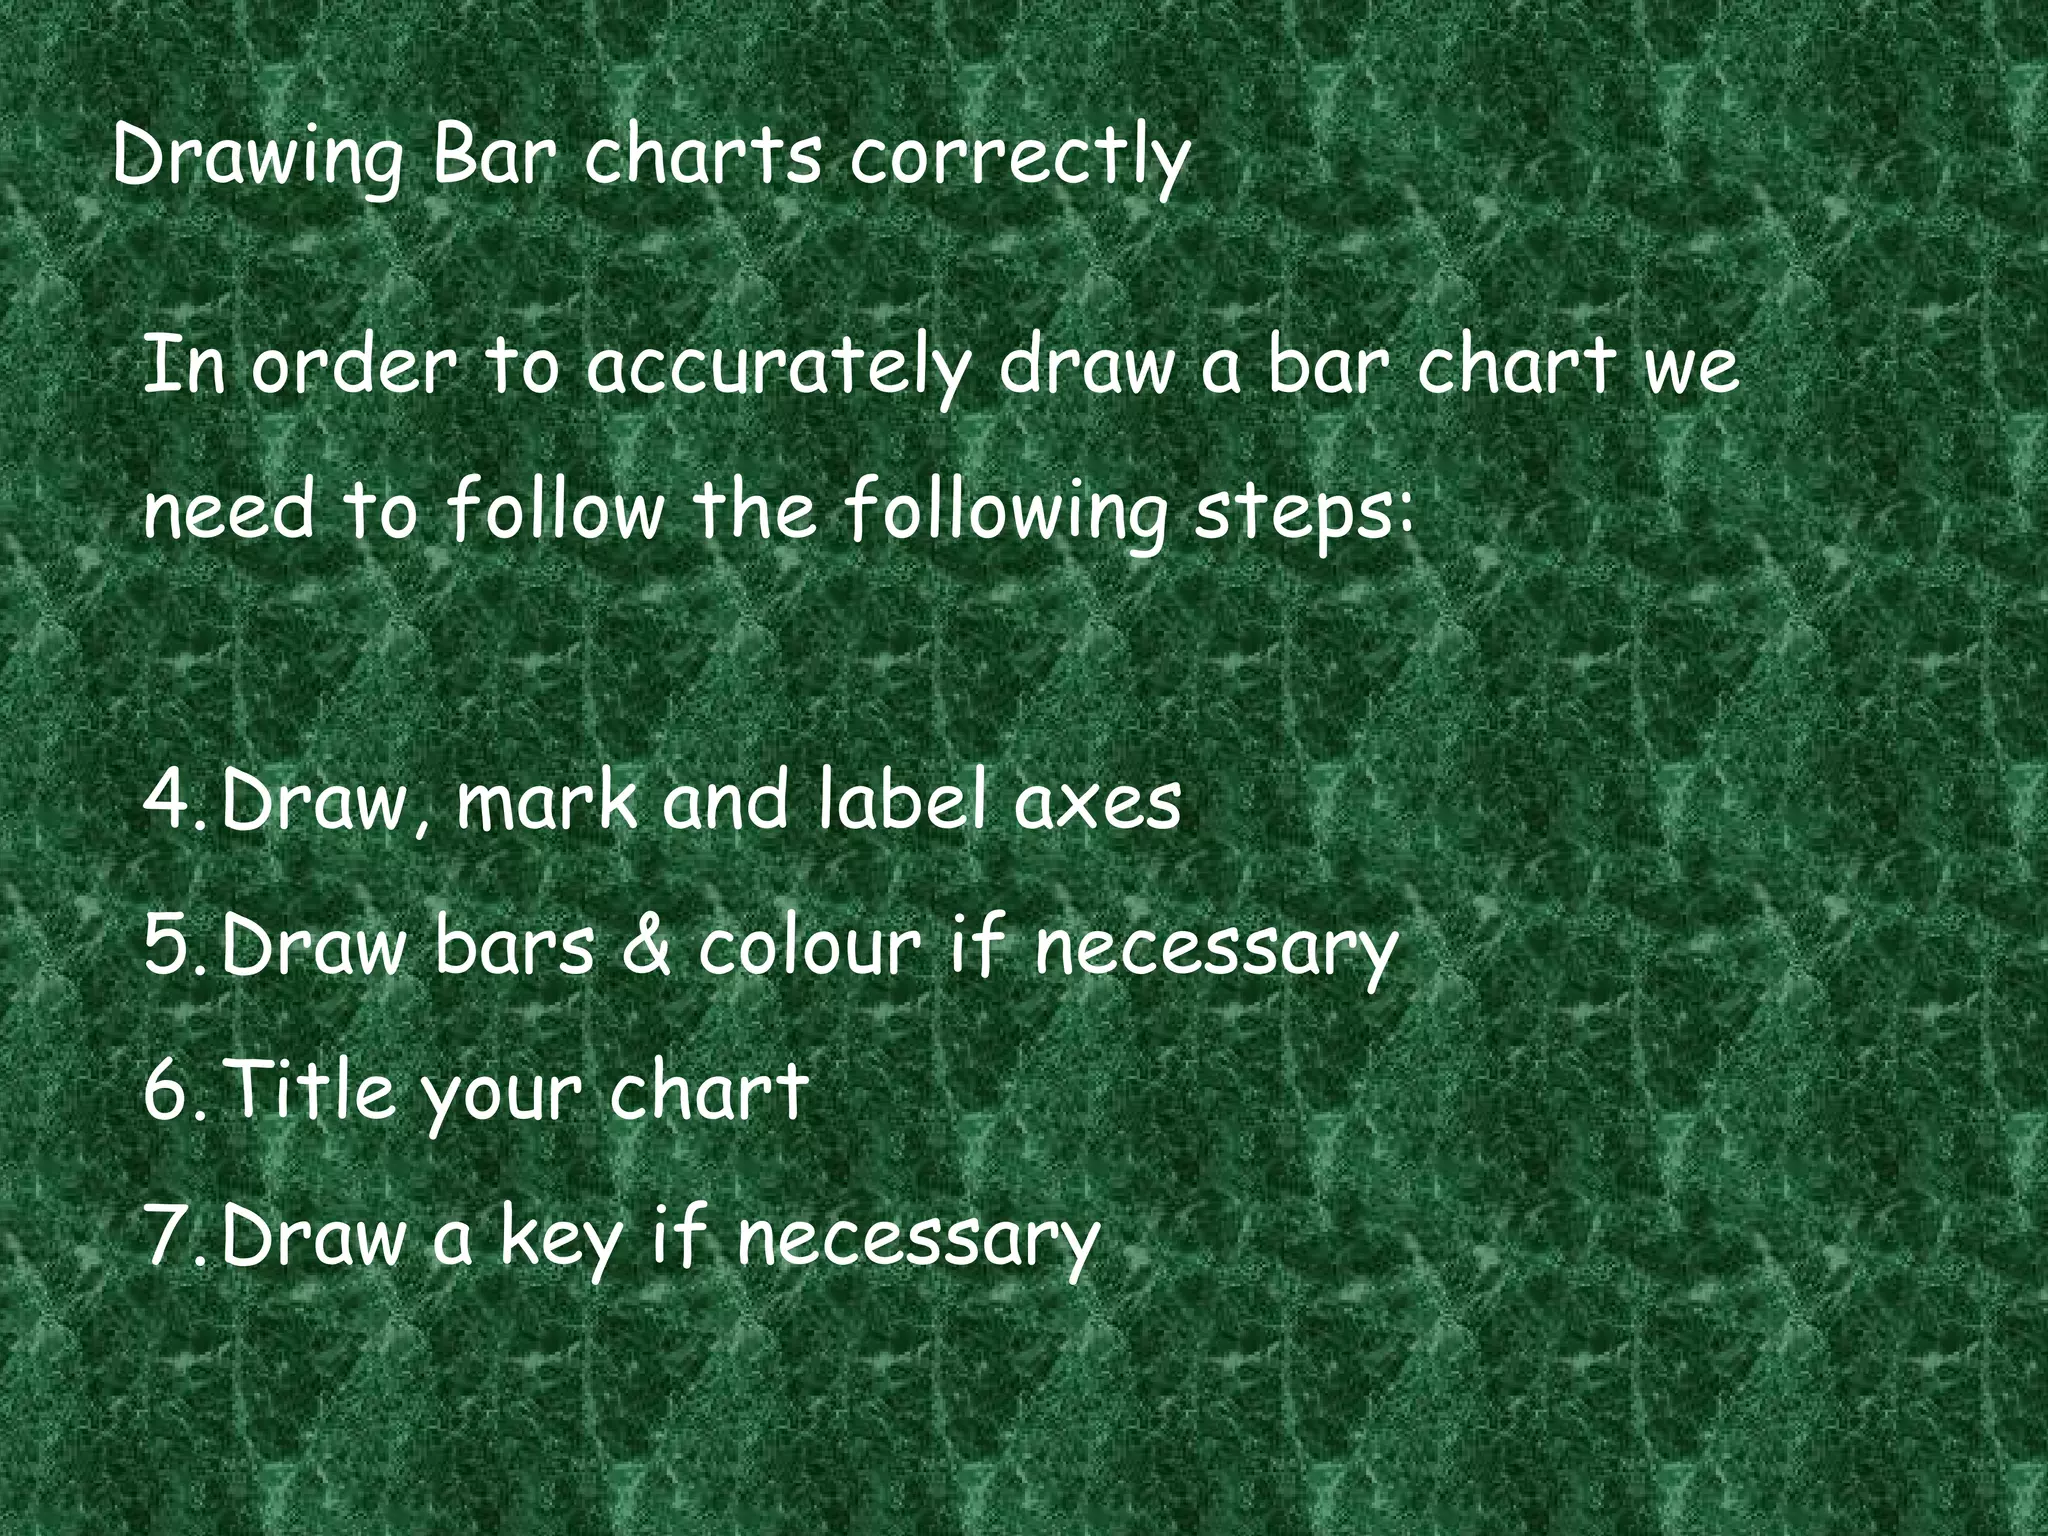
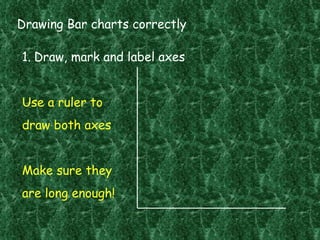
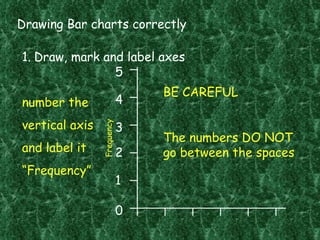
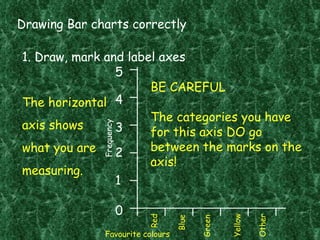
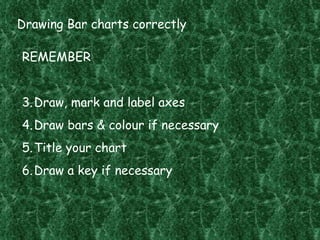
1. Draw, mark, and label the axes clearly.
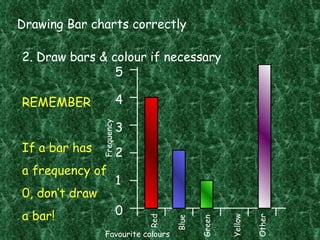
2. Draw the bars and add color if applicable.
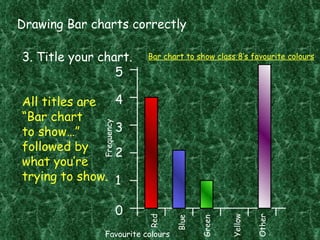
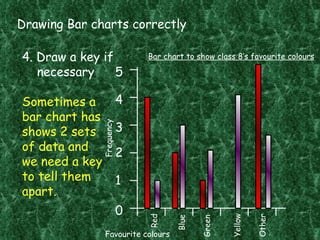
3. Give the chart a clear title that indicates what is being shown.
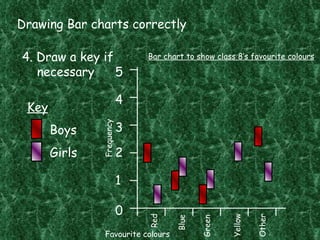
4. Include a key to distinguish data if there are multiple data sets.


![Mat 140.geometric shapes[1]](https://cdn.slidesharecdn.com/ss_thumbnails/mat140-geometricshapes1-110504085344-phpapp02-thumbnail.jpg?width=640&height=640&fit=bounds)


