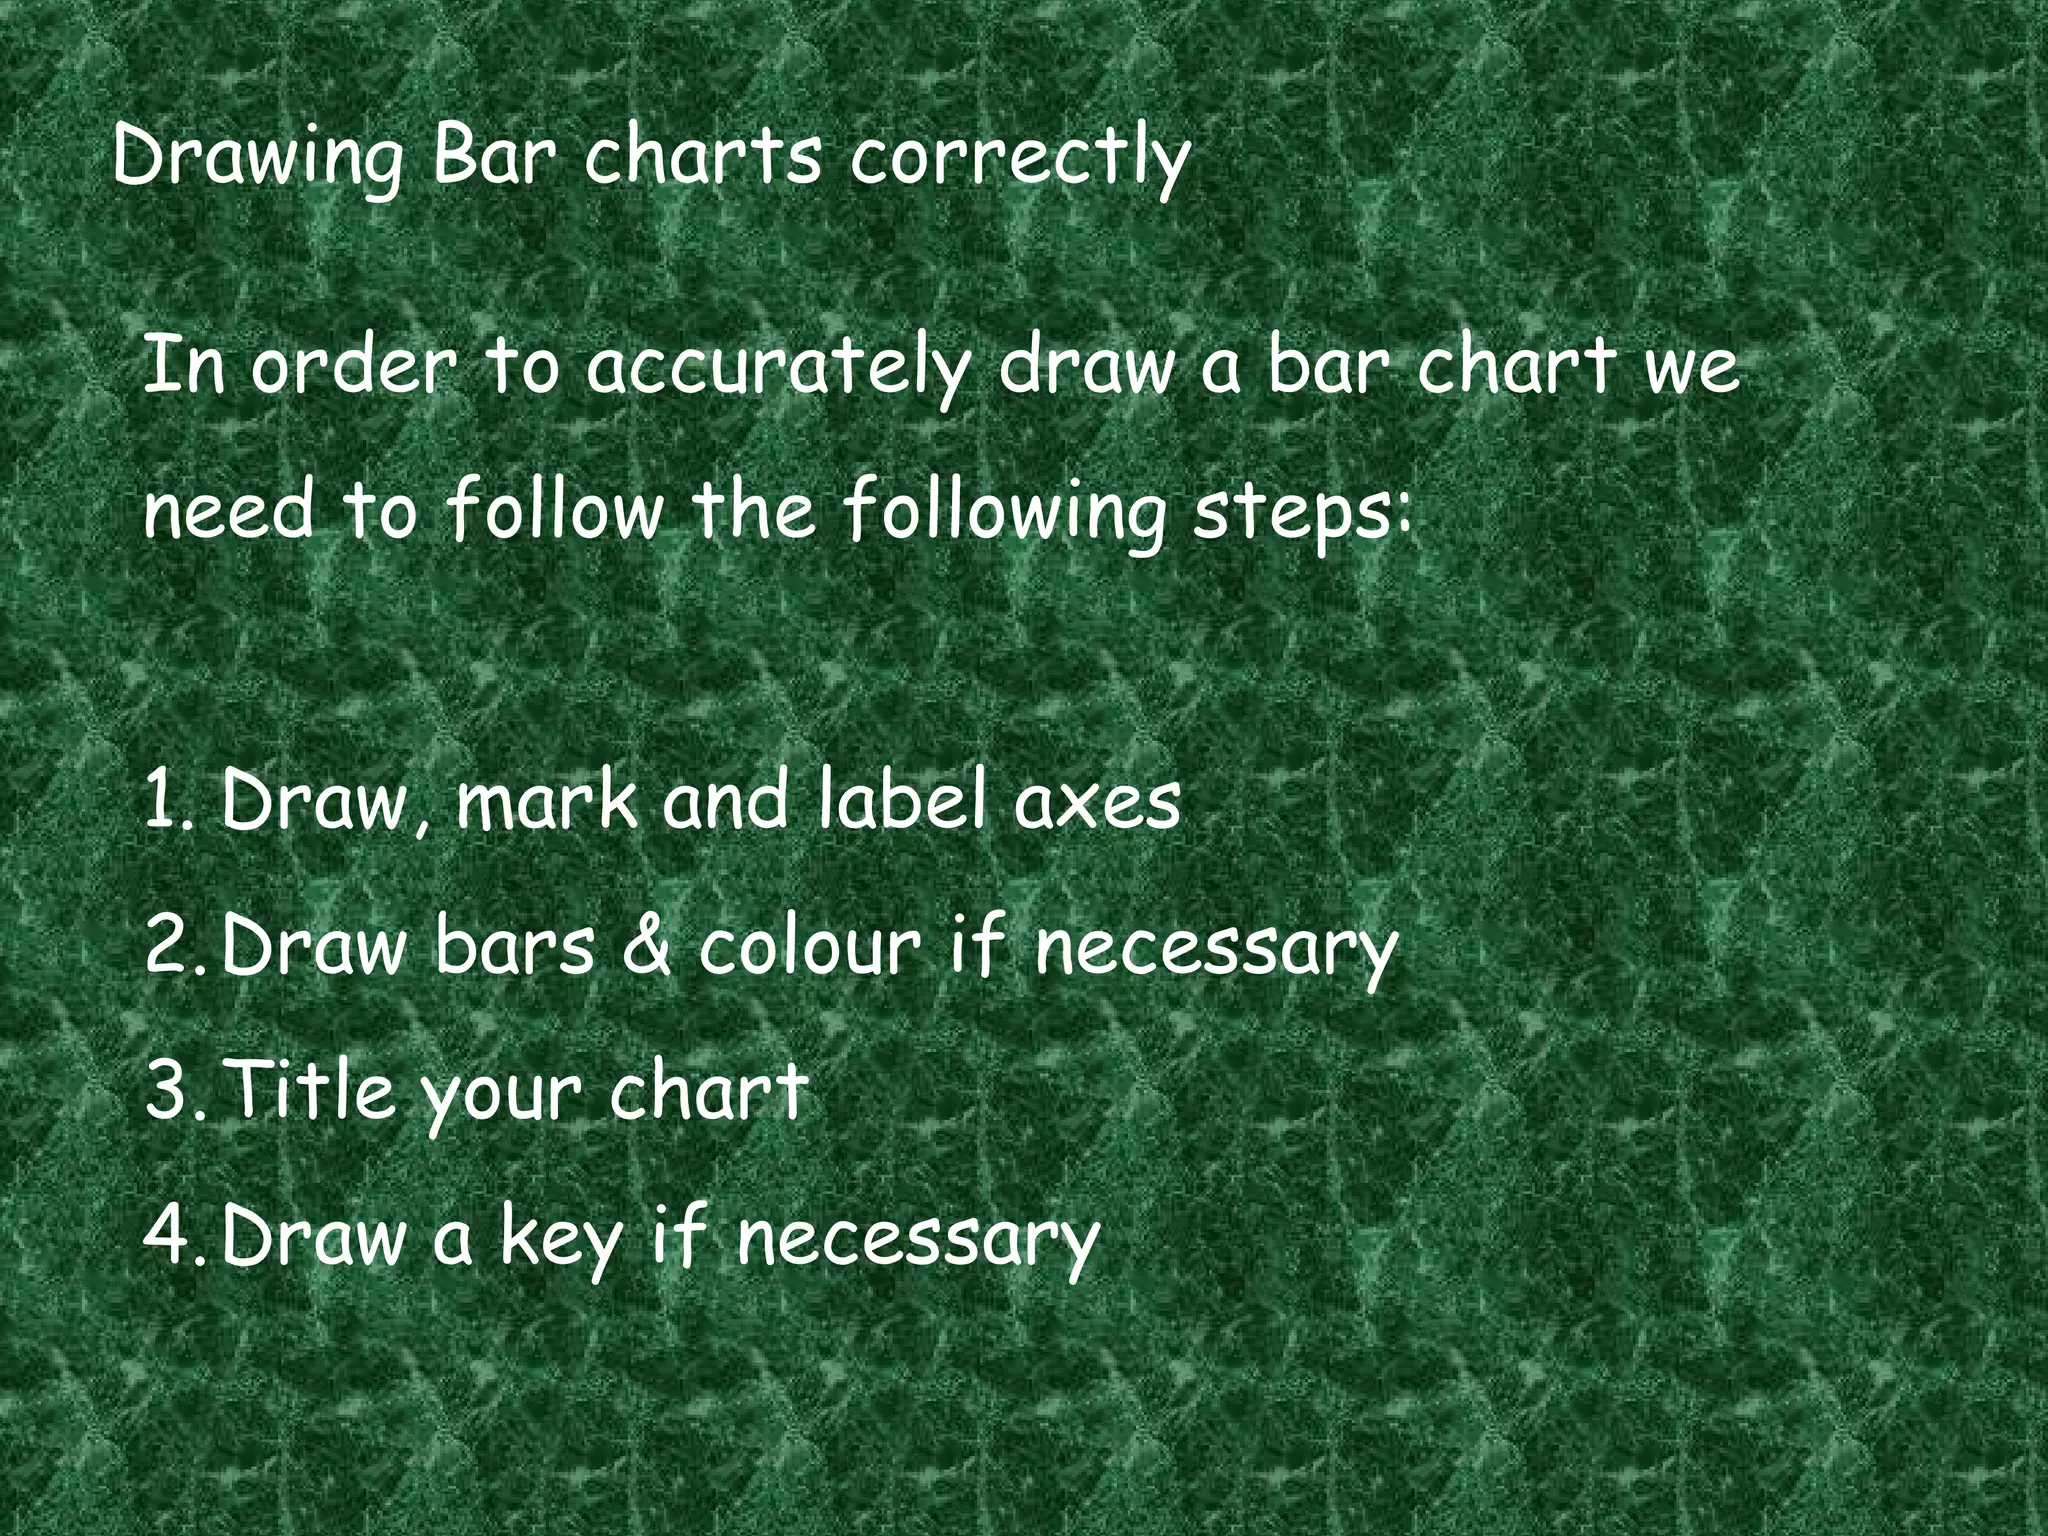
To accurately draw a bar chart, follow these steps:
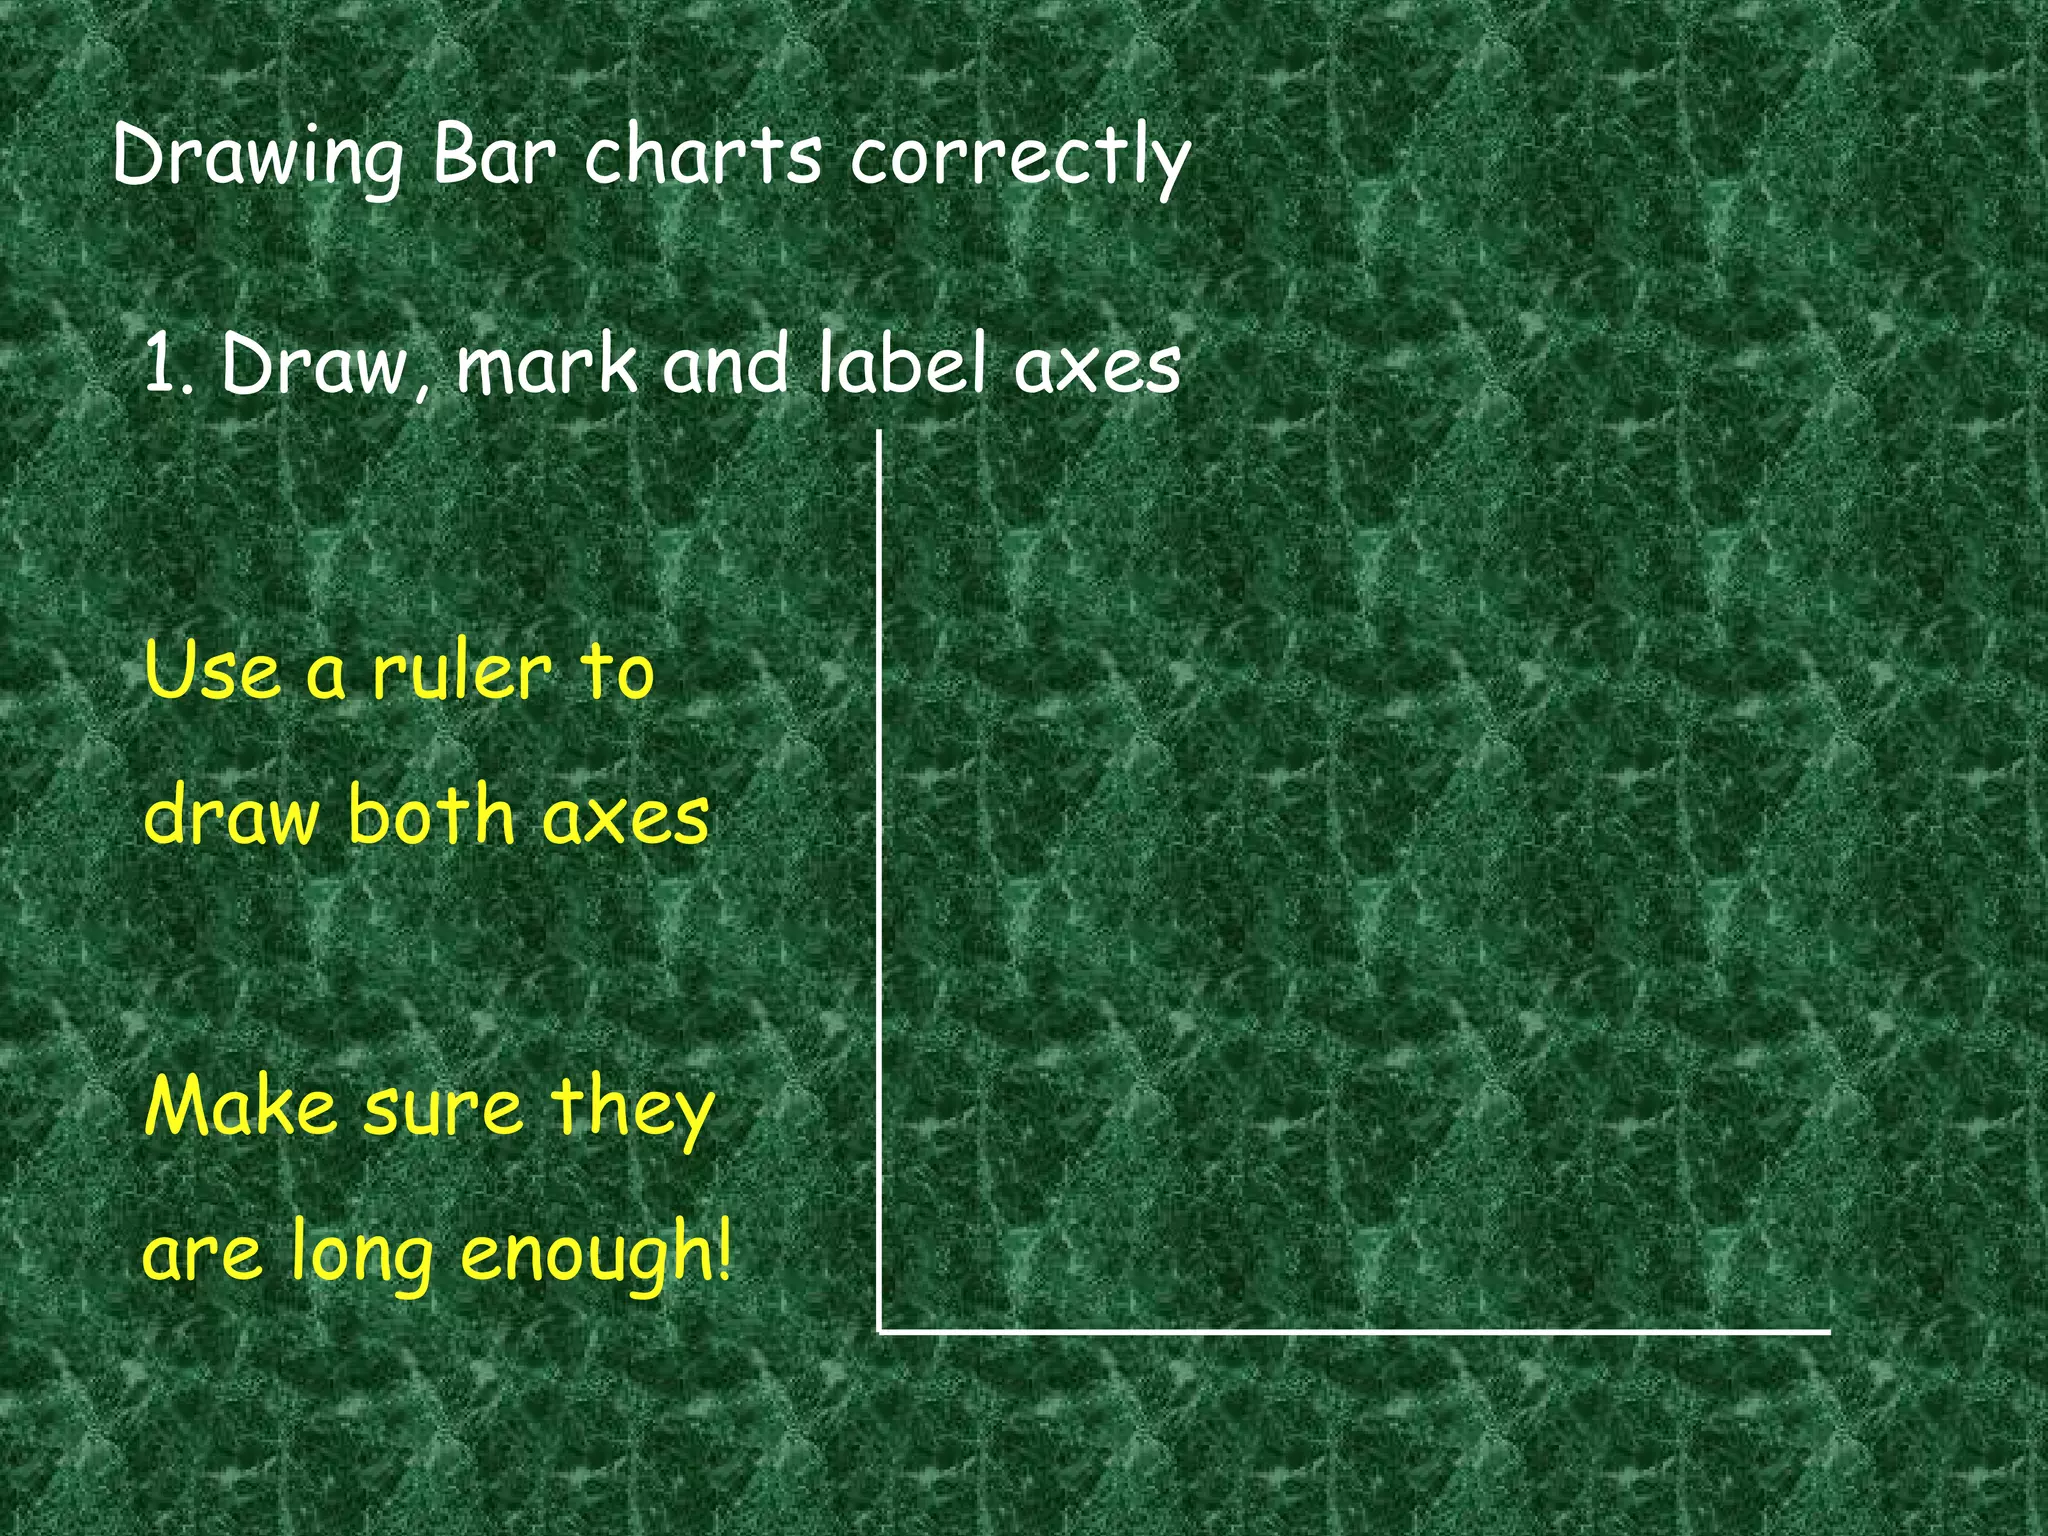
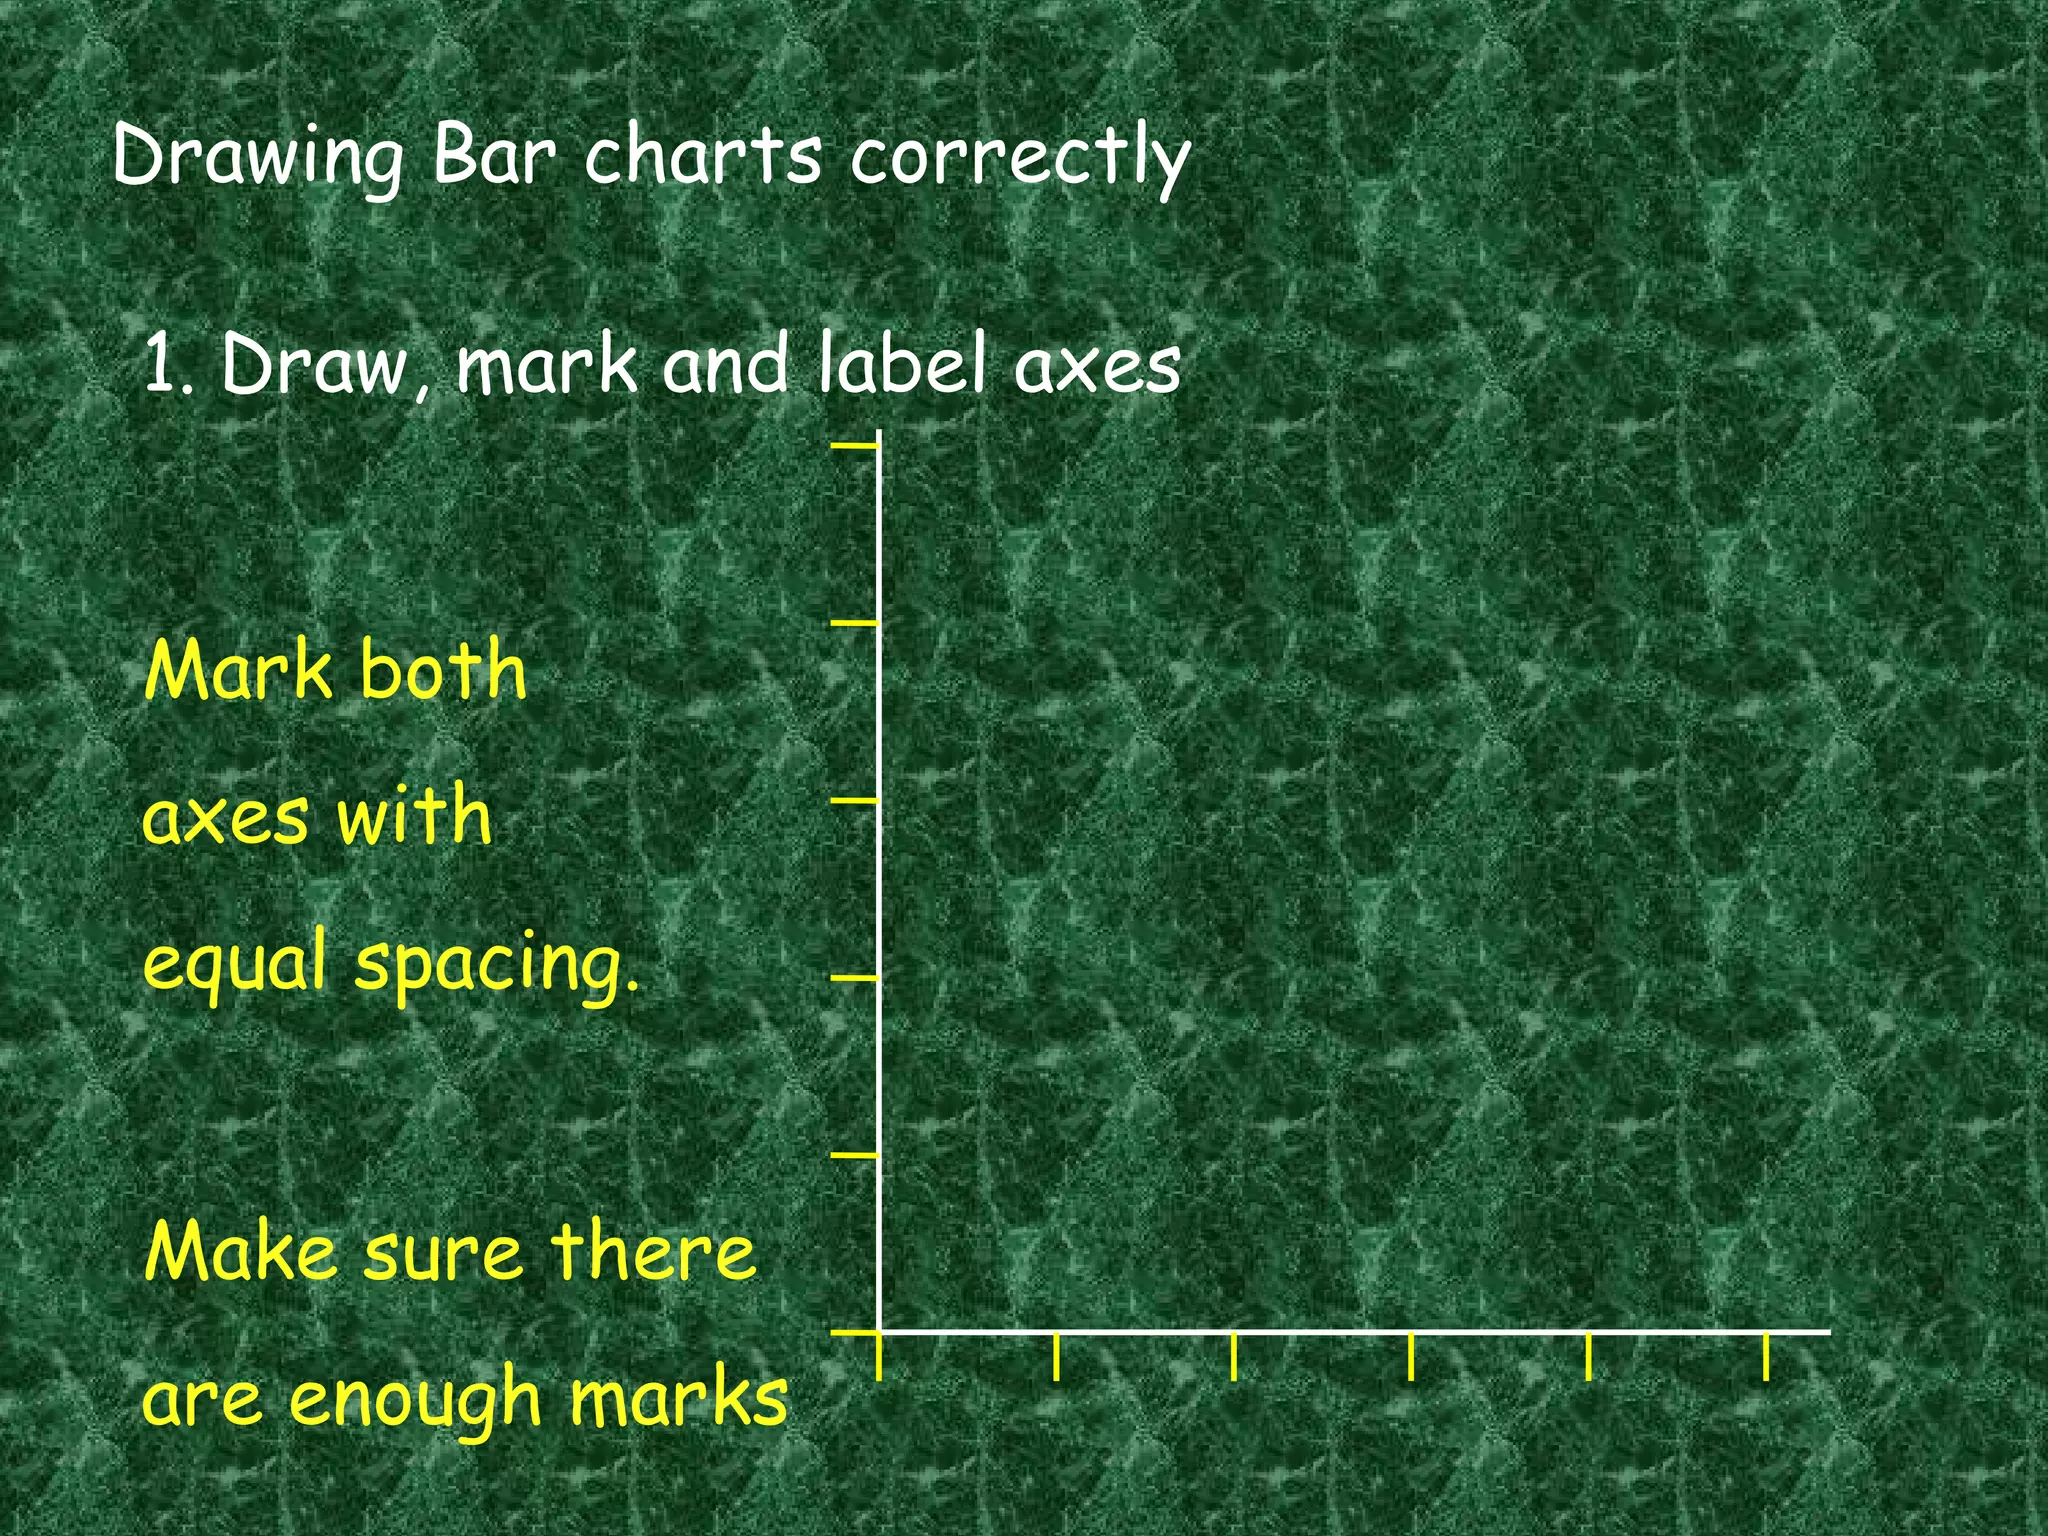
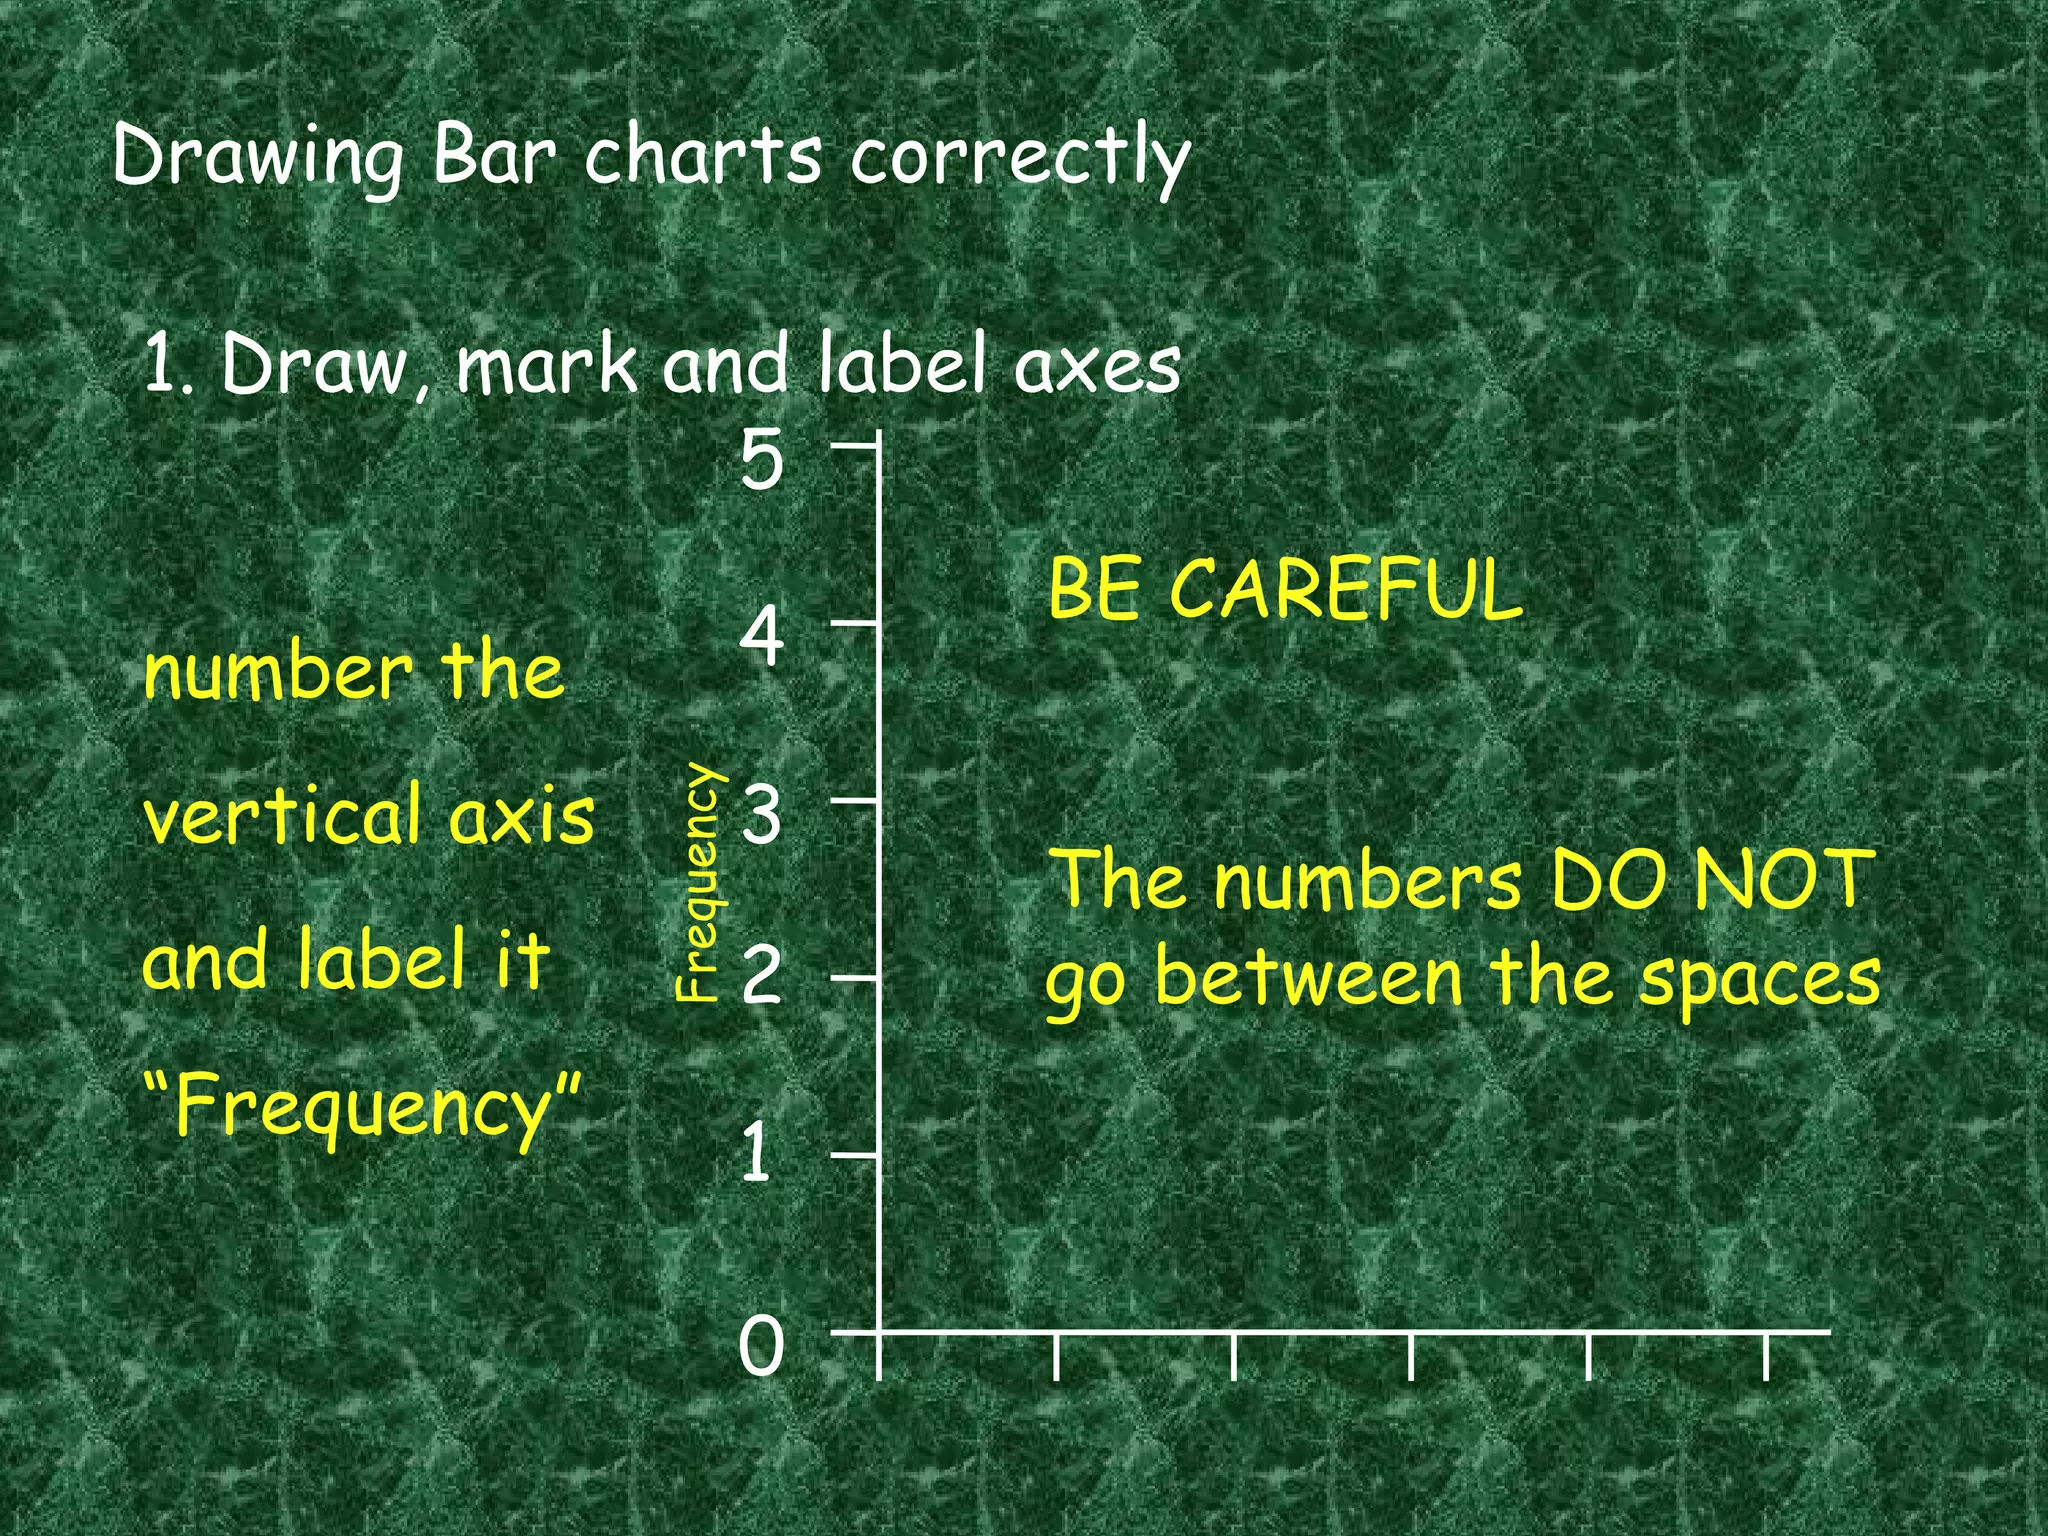
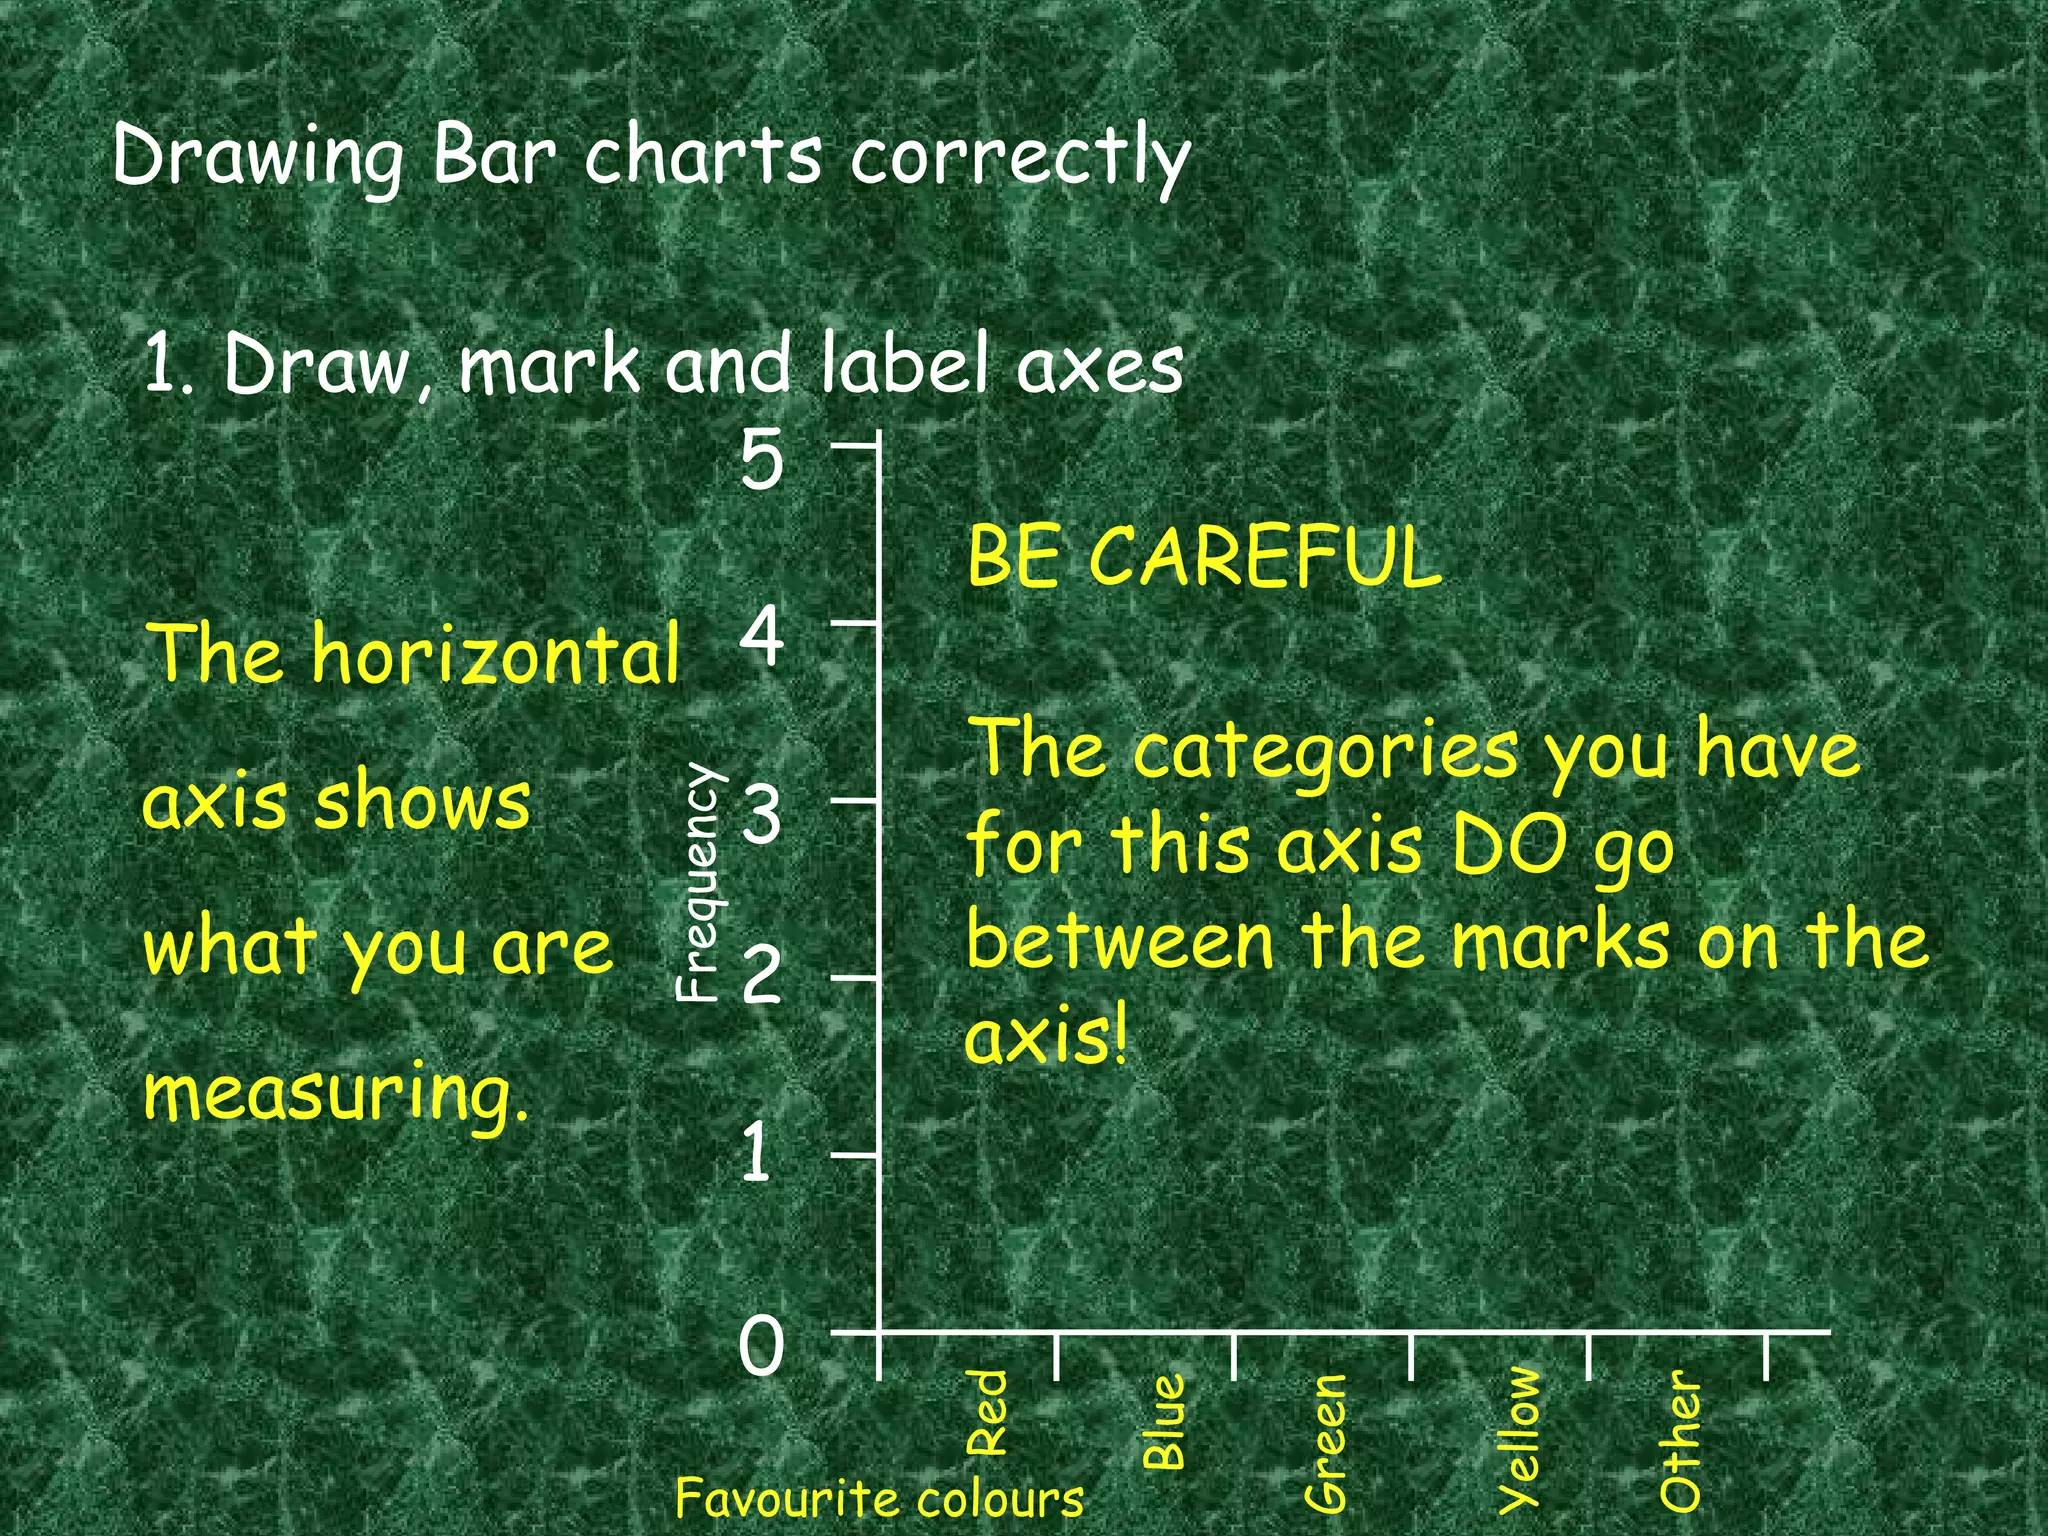
1. Draw and label the axes, making sure they are long enough and marked with equal spacing. Label the vertical axis with the measurement unit.
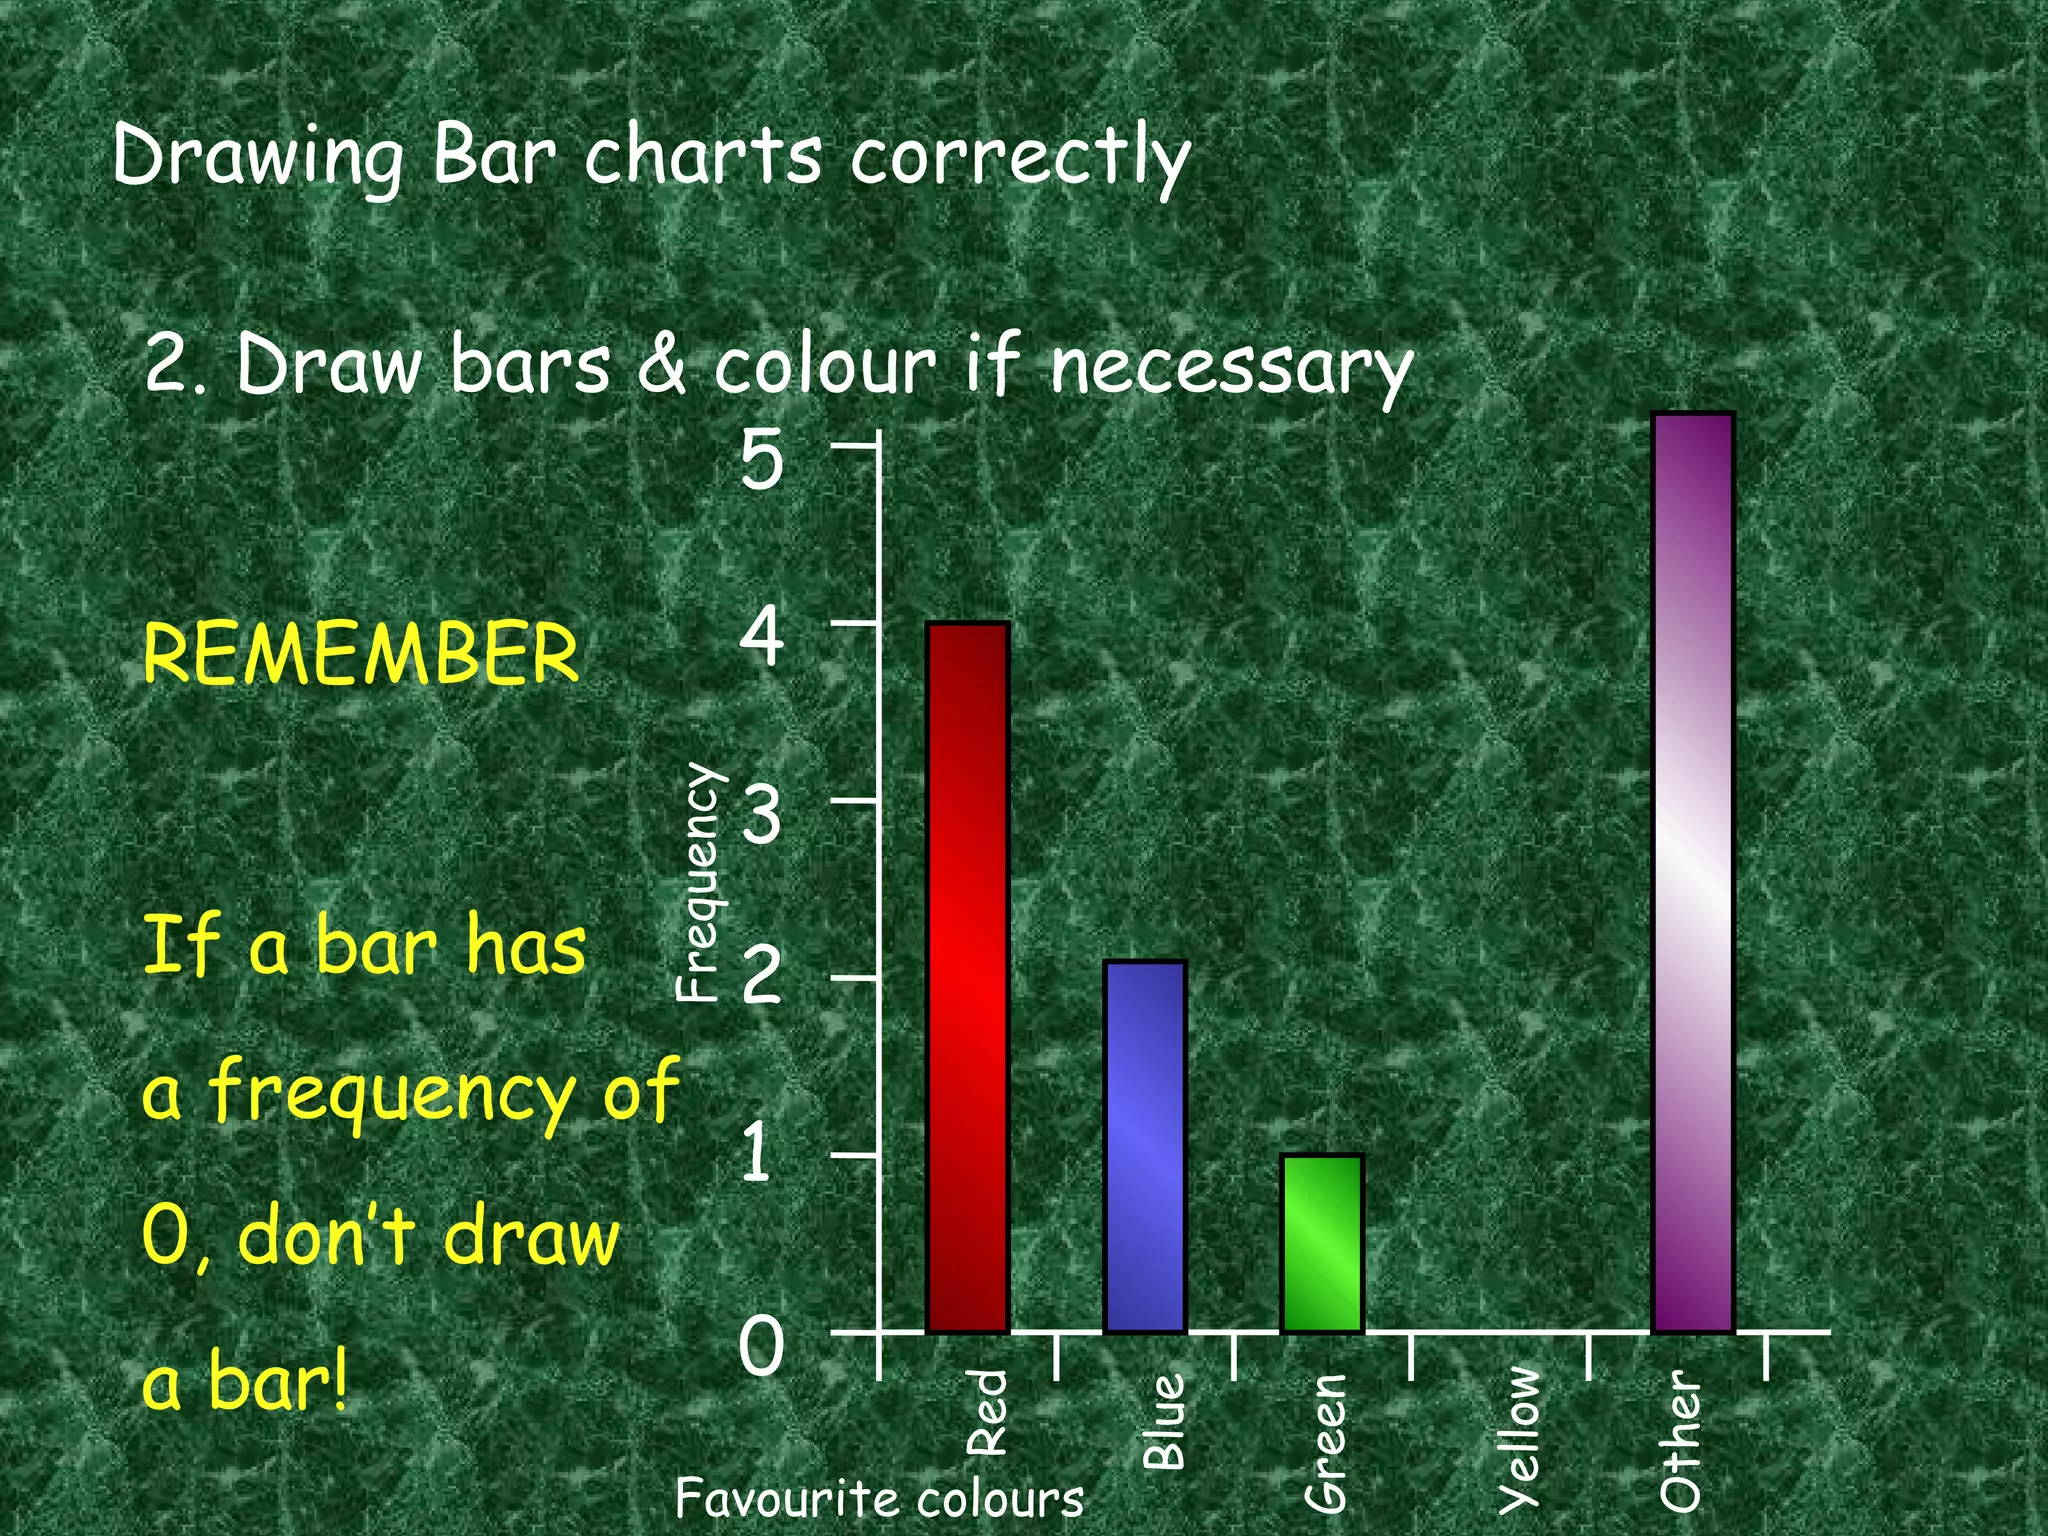
2. Draw the bars between the axis marks. Do not draw bars for any values of 0.
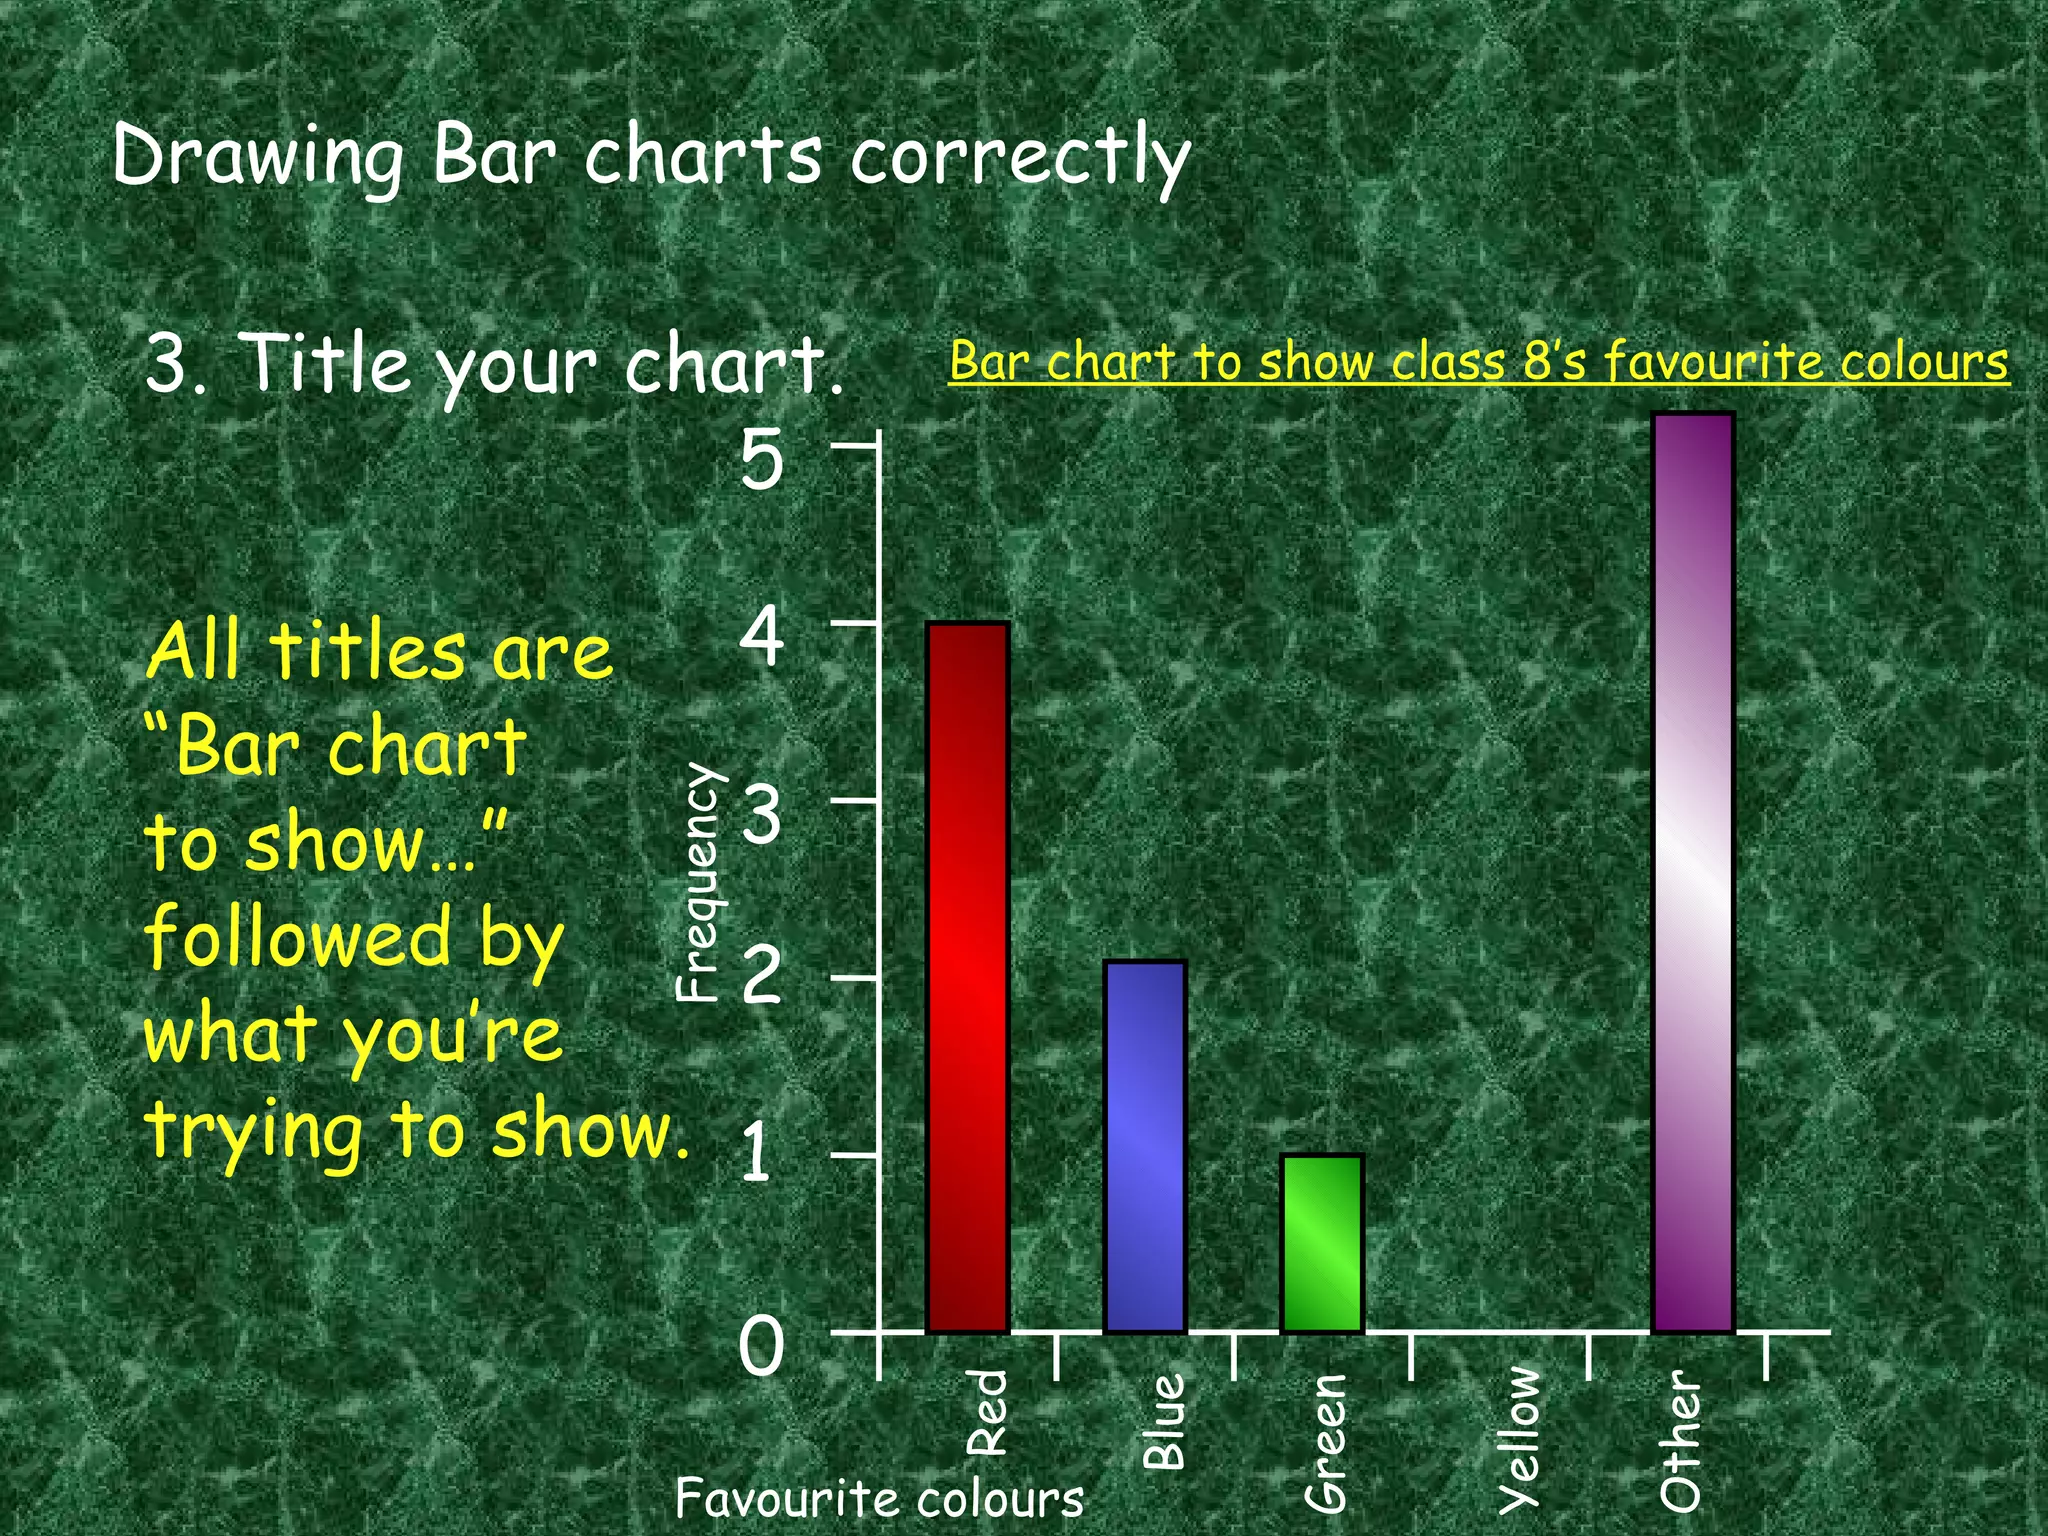
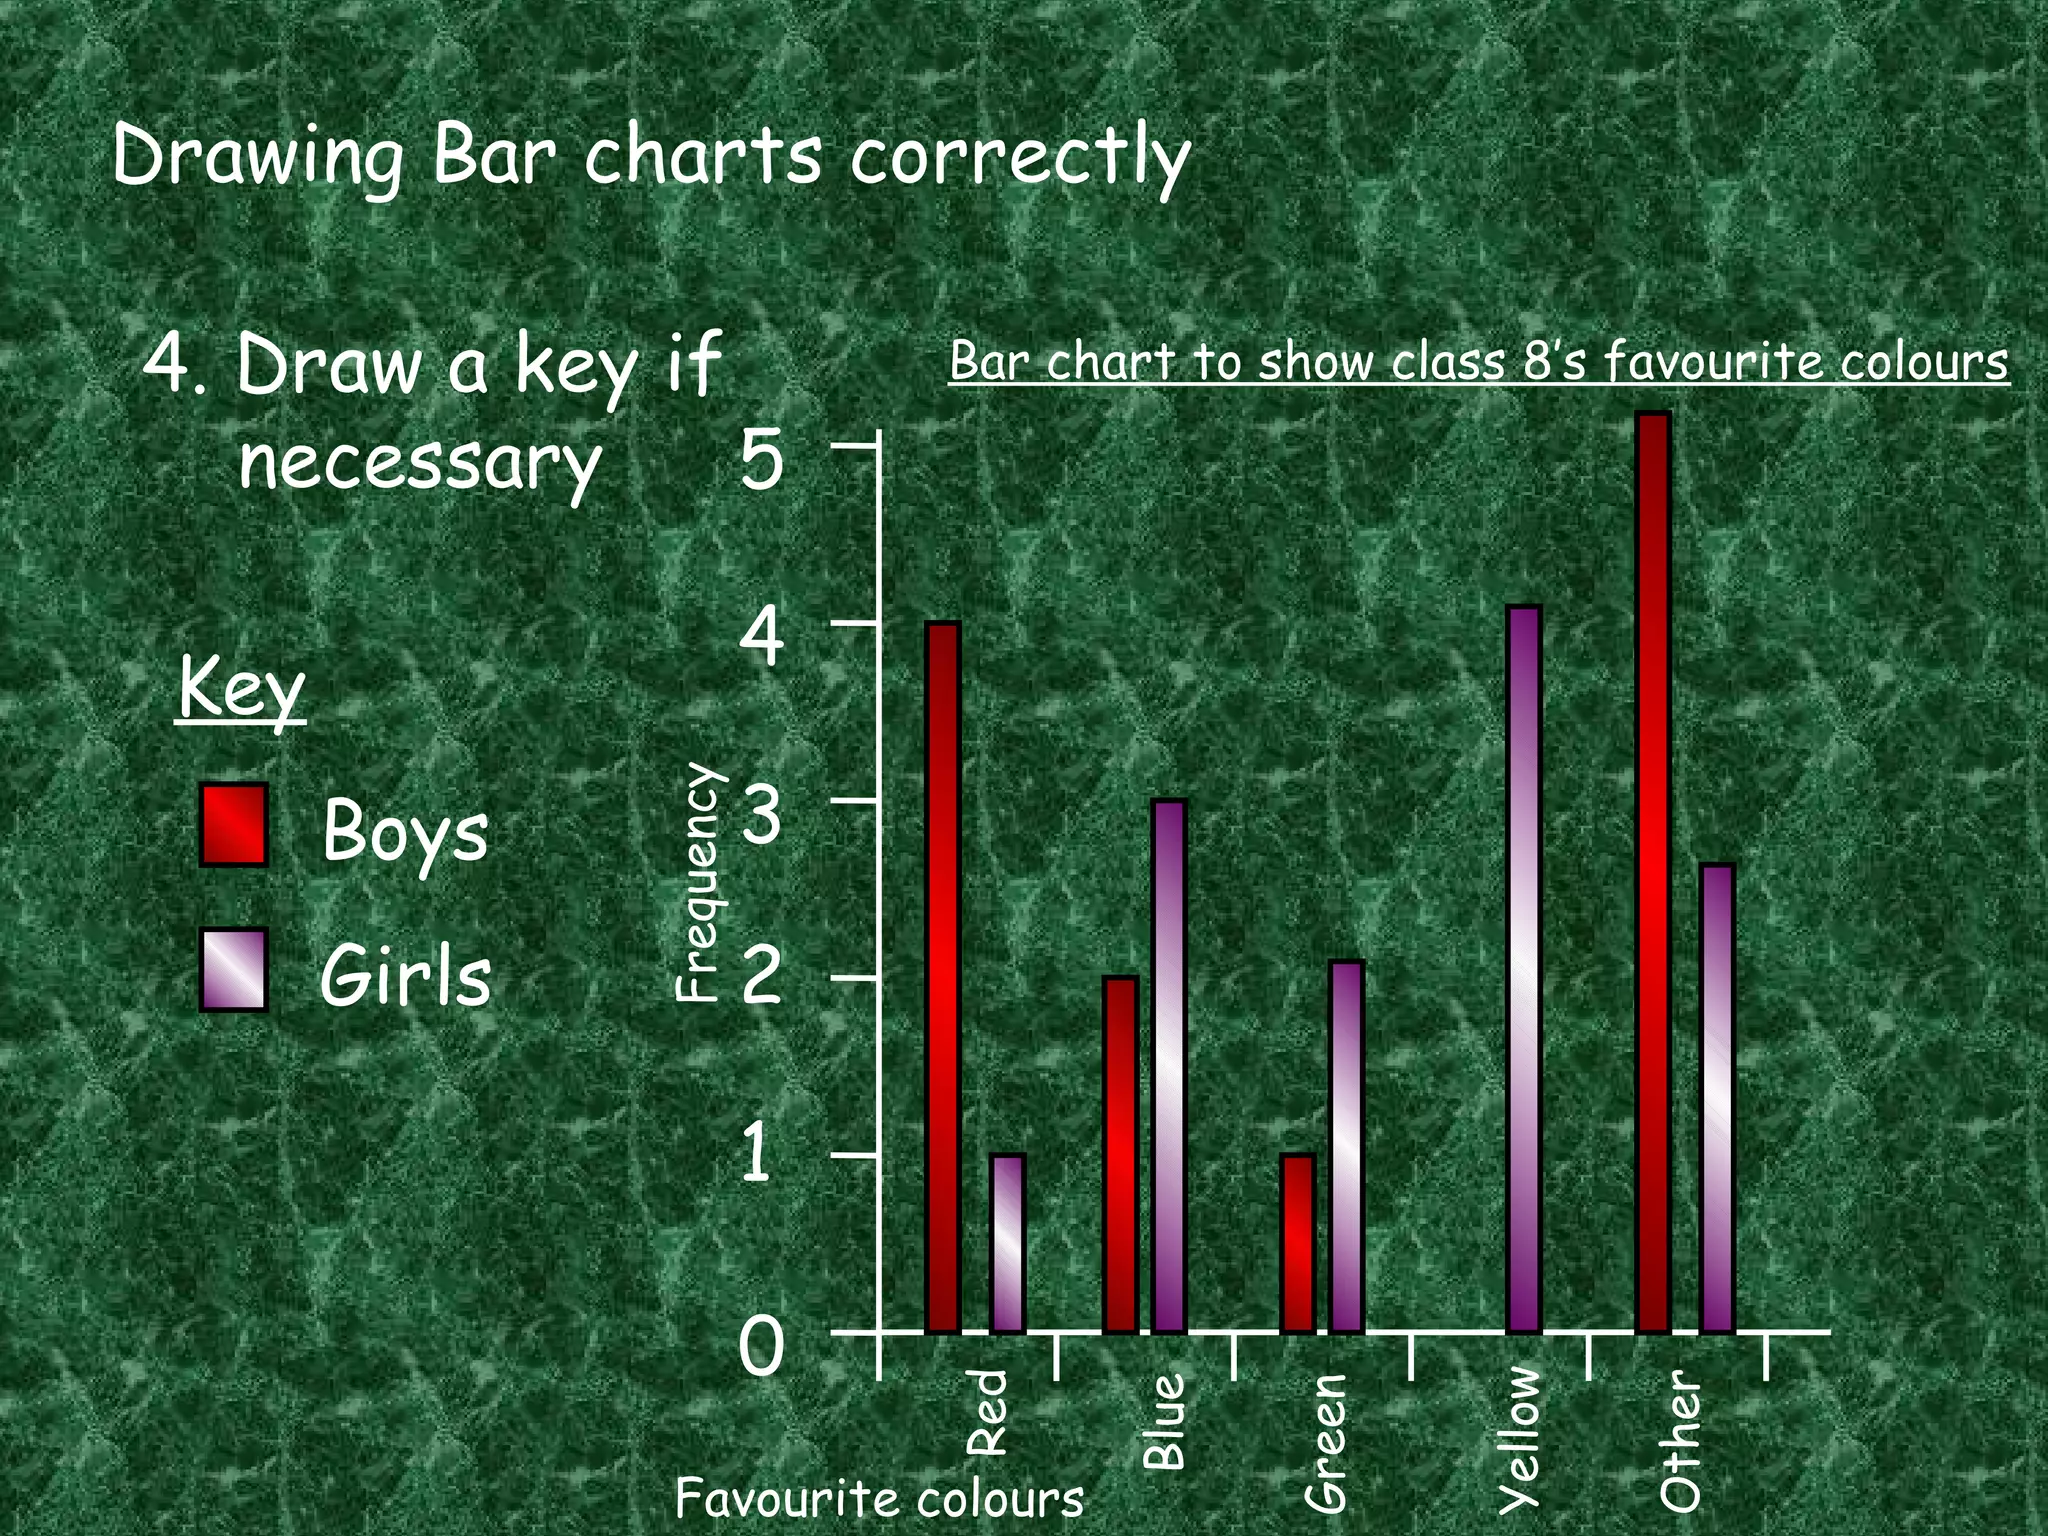
3. Title the chart to indicate what is being displayed, such as "Bar chart to show class 8's favourite colours".
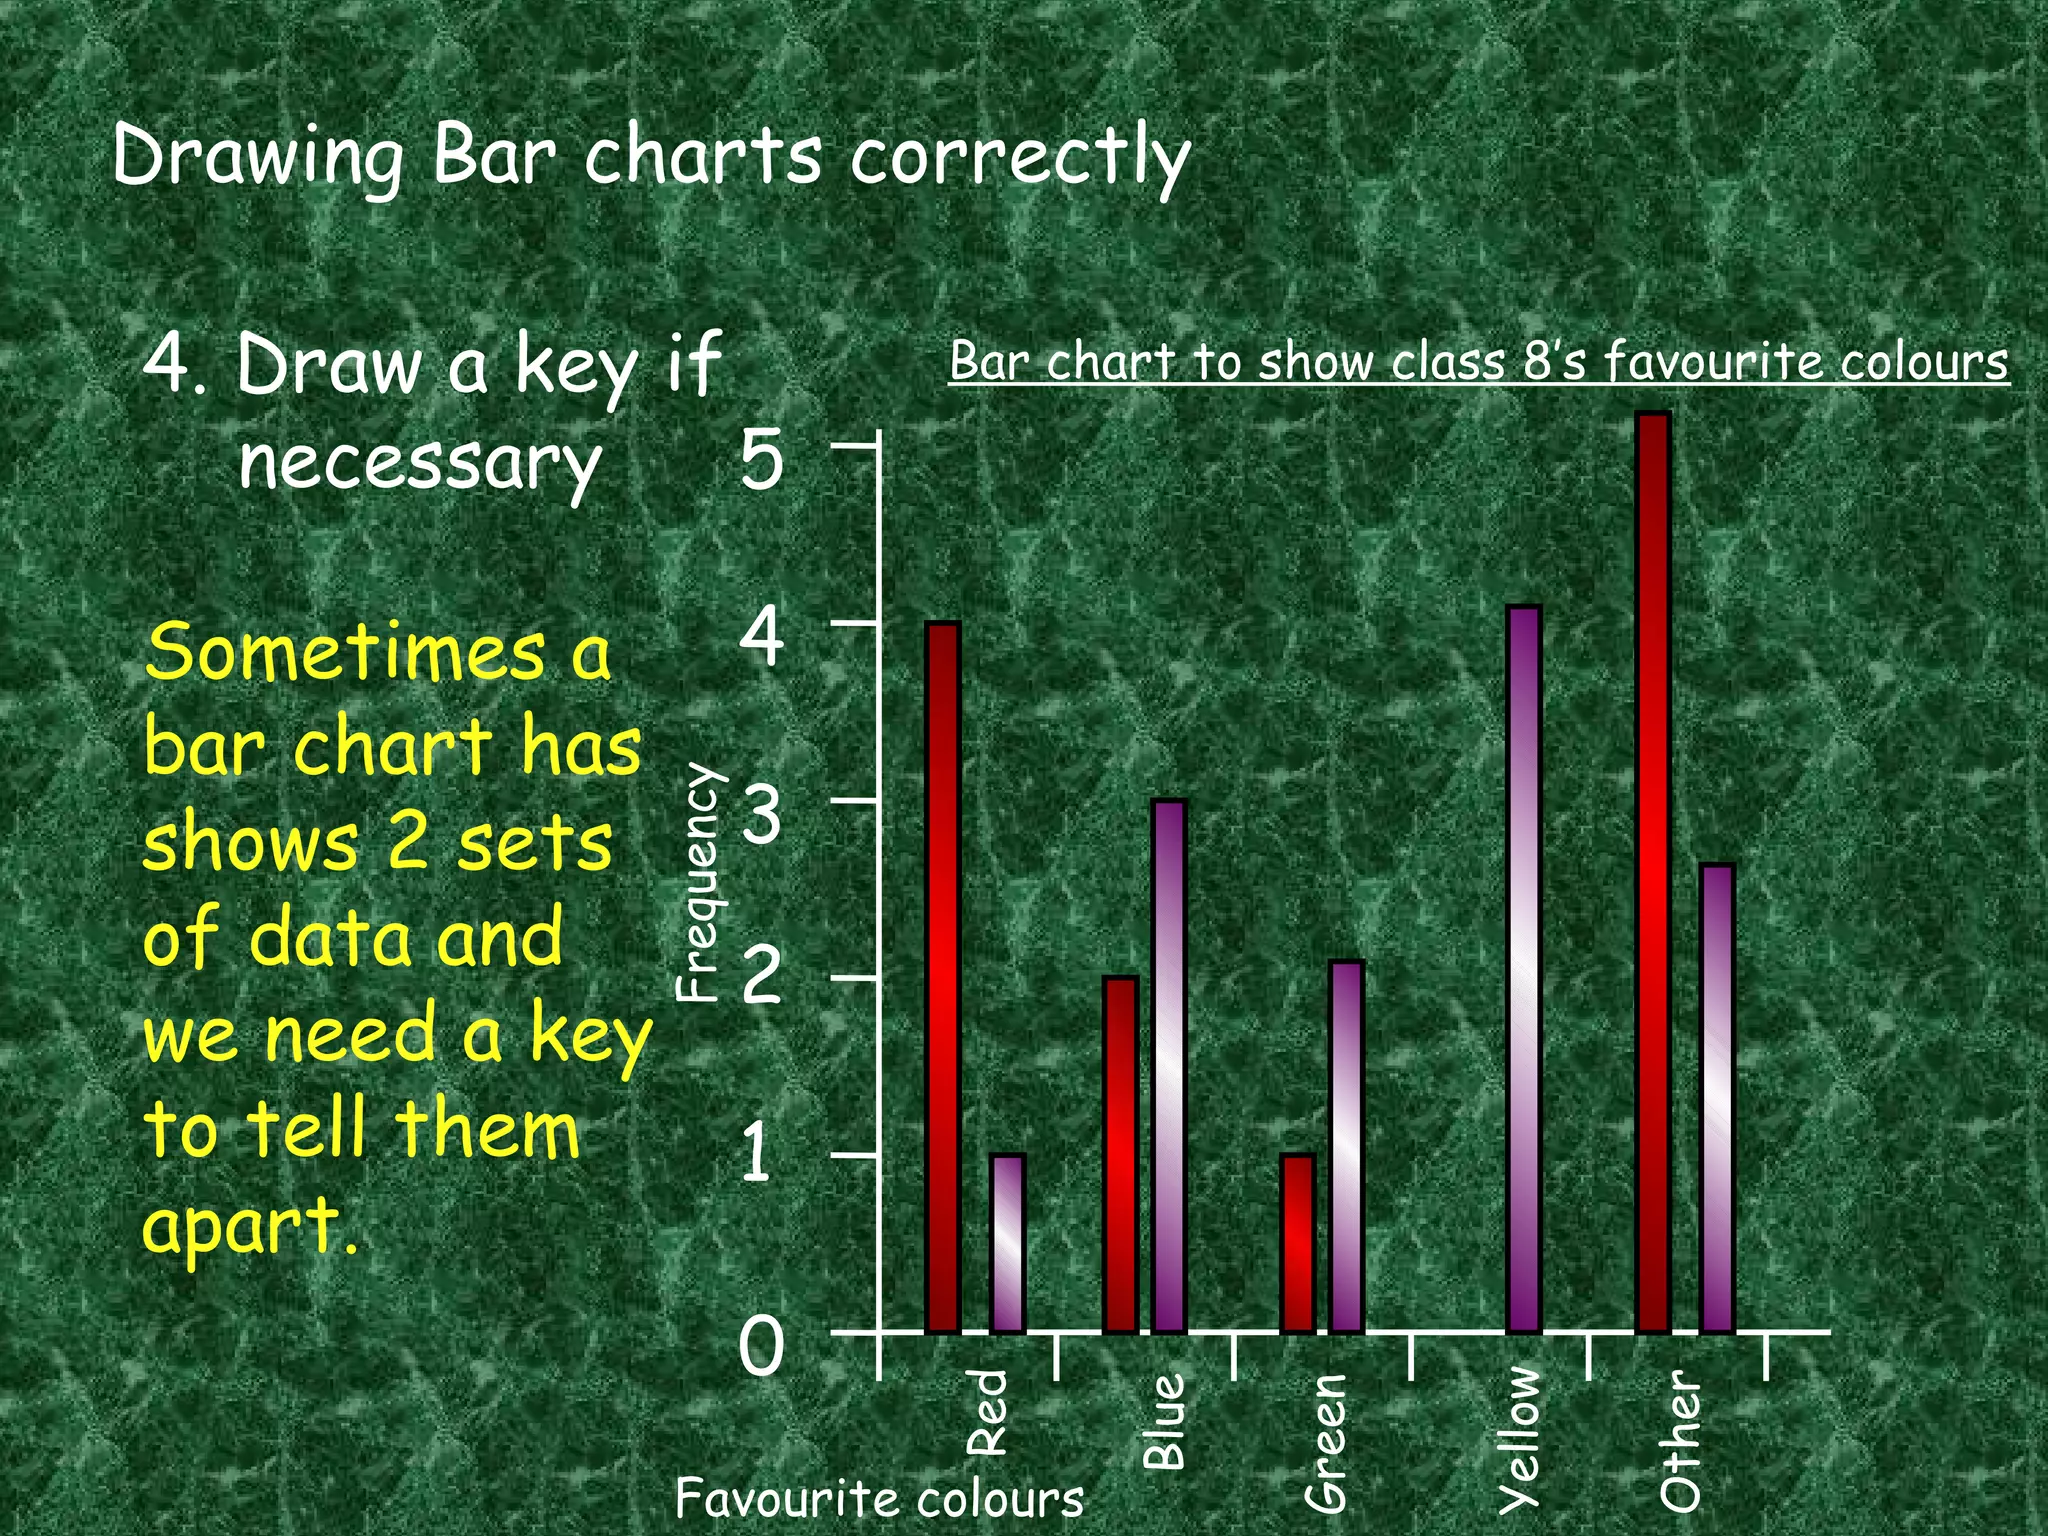
4. Optionally include a key to distinguish between different data sets if more than one is shown.