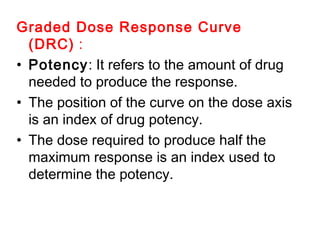
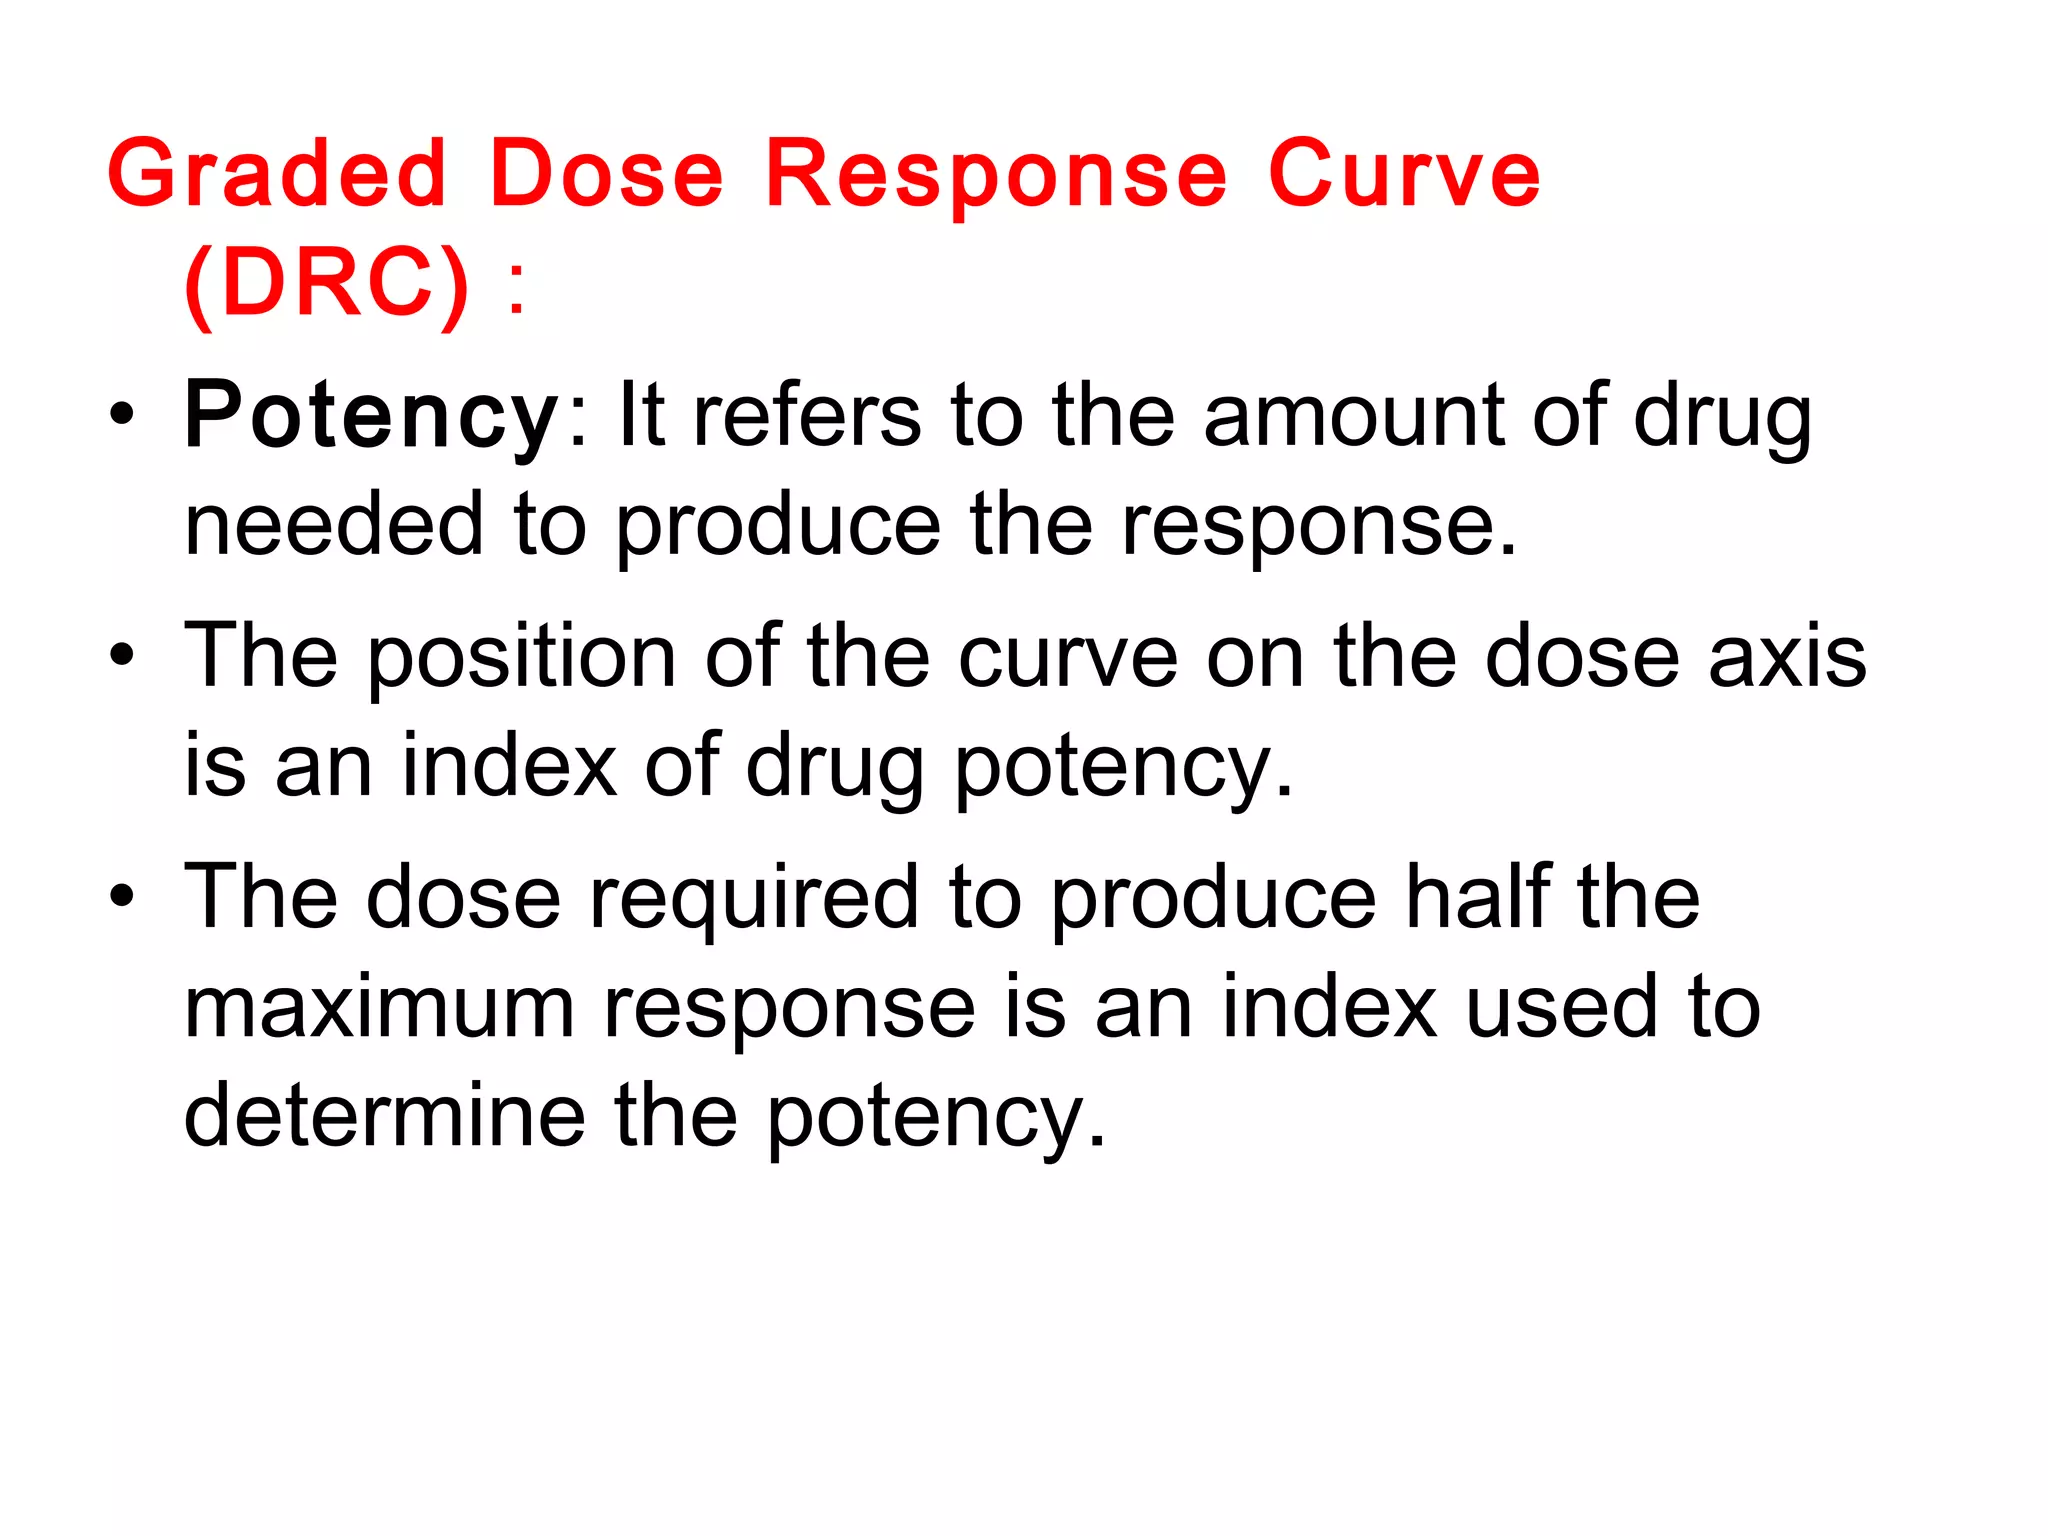
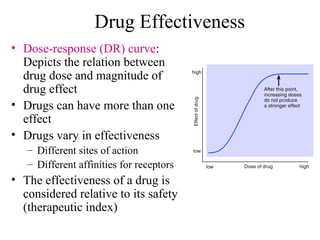
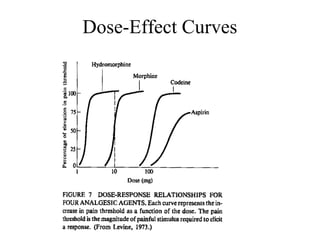
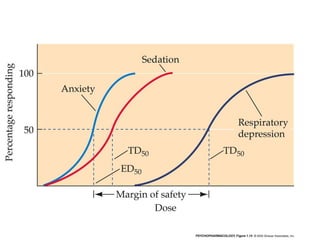
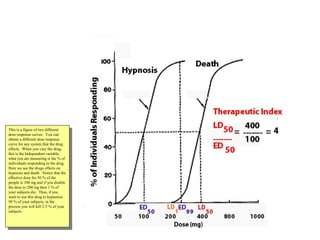
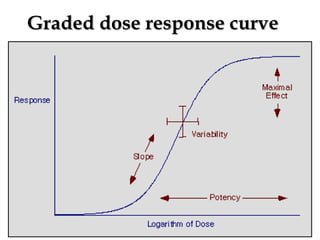
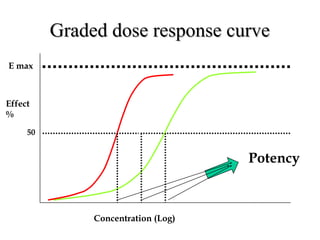
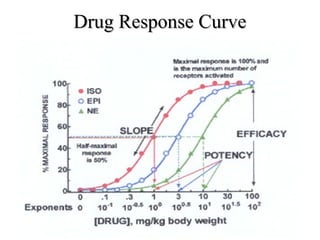
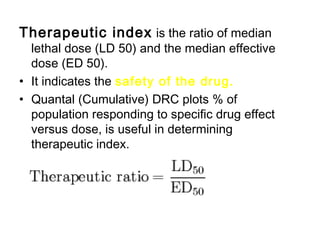
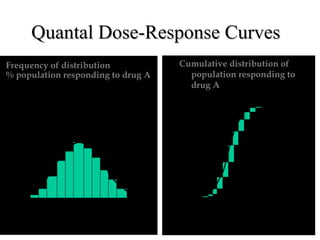
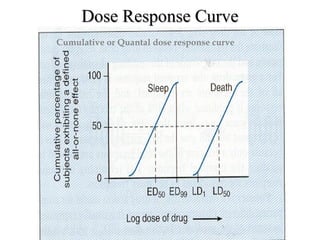
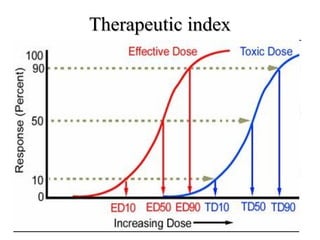
Graded Dose Response Curve
(DRC) :
• Potency: It refers to the amount of drug
needed to produce the response.
• The position of the curve on the dose axis
is an index of drug potency.
• The dose required to produce half the
maximum response is an index used to
determine the potency.
Drug Effectiveness
• Dose-response (DR) curve:
Depicts the relation between
drug dose and magnitude of
drug effect
• Drugs can have more than one
effect
• Drugs vary in effectiveness
– Different sites of action
– Different affinities for receptors
• The effectiveness of a drug is
considered relative to its safety
(therapeutic index)
Dose-Effect Curves
Therapeutic Index
This is a figure of two different
dose response curves. You can
obtain a different dose response
curve for any system that the drug
effects. When you vary the drug,
this is the Independent variable,
what you are measuring is the % of
individuals responding to the drug.
Here we see the drugs effects on
hypnosis and death. Notice that the
effective dose for 50 % of the
people is 100 mg and if you double
the dose to 200 mg then 1 % of
your subjects die. Thus, if you
want to use this drug to hypnotize
99 % of your subjects, in the
process you will kill 2-3 % of your
subjects.
Efficacy : It refers to the maximum
response of the drug.
•The upper limit of the drug response
curve is an index of efficacy of the drug.
•Steepness of the curve indicates the
dose range – steep slope indicates that a
small increase in the dose markedly
increase the response.
•Slope of the curve is related to the
mechanism of action of a drug.
Graded dose response curveGraded dose response curve
Effect
%
E max
Concentration (Log)
50
Potency
Drug Response CurveDrug Response Curve
Therapeutic index is the ratio of median
lethal dose (LD 50) and the median effective
dose (ED 50).
• It indicates the safety of the drug.
• Quantal (Cumulative) DRC plots % of
population responding to specific drug effect
versus dose, is useful in determining
therapeutic index.
Quantal Dose-Response CurvesQuantal Dose-Response Curves
Frequency of distribution
% population responding to drug A
1 10 20 30 40 50 60 70 80 90 100
Dose
(mg/kg)
%populationresponding
Frequency of distribution
% population responding to drug A
Dose (mg/kg) log scale
%populationresponding
ED10
ED50
ED90
1 10 100
Cumulative distribution of
population responding to
drug A
Dose Response CurveDose Response Curve
Cumulative or Quantal dose response curve
Therapeutic indexTherapeutic index

Dose response curvevpp

  • 1.
    Graded Dose ResponseCurve (DRC) : • Potency: It refers to the amount of drug needed to produce the response. • The position of the curve on the dose axis is an index of drug potency. • The dose required to produce half the maximum response is an index used to determine the potency.
  • 2.
    Drug Effectiveness • Dose-response(DR) curve: Depicts the relation between drug dose and magnitude of drug effect • Drugs can have more than one effect • Drugs vary in effectiveness – Different sites of action – Different affinities for receptors • The effectiveness of a drug is considered relative to its safety (therapeutic index)
  • 3.
  • 5.
    Therapeutic Index This isa figure of two different dose response curves. You can obtain a different dose response curve for any system that the drug effects. When you vary the drug, this is the Independent variable, what you are measuring is the % of individuals responding to the drug. Here we see the drugs effects on hypnosis and death. Notice that the effective dose for 50 % of the people is 100 mg and if you double the dose to 200 mg then 1 % of your subjects die. Thus, if you want to use this drug to hypnotize 99 % of your subjects, in the process you will kill 2-3 % of your subjects. This is a figure of two different dose response curves. You can obtain a different dose response curve for any system that the drug effects. When you vary the drug, this is the Independent variable, what you are measuring is the % of individuals responding to the drug. Here we see the drugs effects on hypnosis and death. Notice that the effective dose for 50 % of the people is 100 mg and if you double the dose to 200 mg then 1 % of your subjects die. Thus, if you want to use this drug to hypnotize 99 % of your subjects, in the process you will kill 2-3 % of your subjects.
  • 6.
    Efficacy : Itrefers to the maximum response of the drug. •The upper limit of the drug response curve is an index of efficacy of the drug. •Steepness of the curve indicates the dose range – steep slope indicates that a small increase in the dose markedly increase the response. •Slope of the curve is related to the mechanism of action of a drug.
  • 7.
    Graded dose responsecurveGraded dose response curve
  • 8.
    Graded dose responsecurveGraded dose response curve Effect % E max Concentration (Log) 50 Potency
  • 9.
  • 10.
    Therapeutic index isthe ratio of median lethal dose (LD 50) and the median effective dose (ED 50). • It indicates the safety of the drug. • Quantal (Cumulative) DRC plots % of population responding to specific drug effect versus dose, is useful in determining therapeutic index.
  • 11.
    Quantal Dose-Response CurvesQuantalDose-Response Curves Frequency of distribution % population responding to drug A 1 10 20 30 40 50 60 70 80 90 100 Dose (mg/kg) %populationresponding Frequency of distribution % population responding to drug A Dose (mg/kg) log scale %populationresponding ED10 ED50 ED90 1 10 100 Cumulative distribution of population responding to drug A
  • 12.
    Dose Response CurveDoseResponse Curve Cumulative or Quantal dose response curve
  • 13.