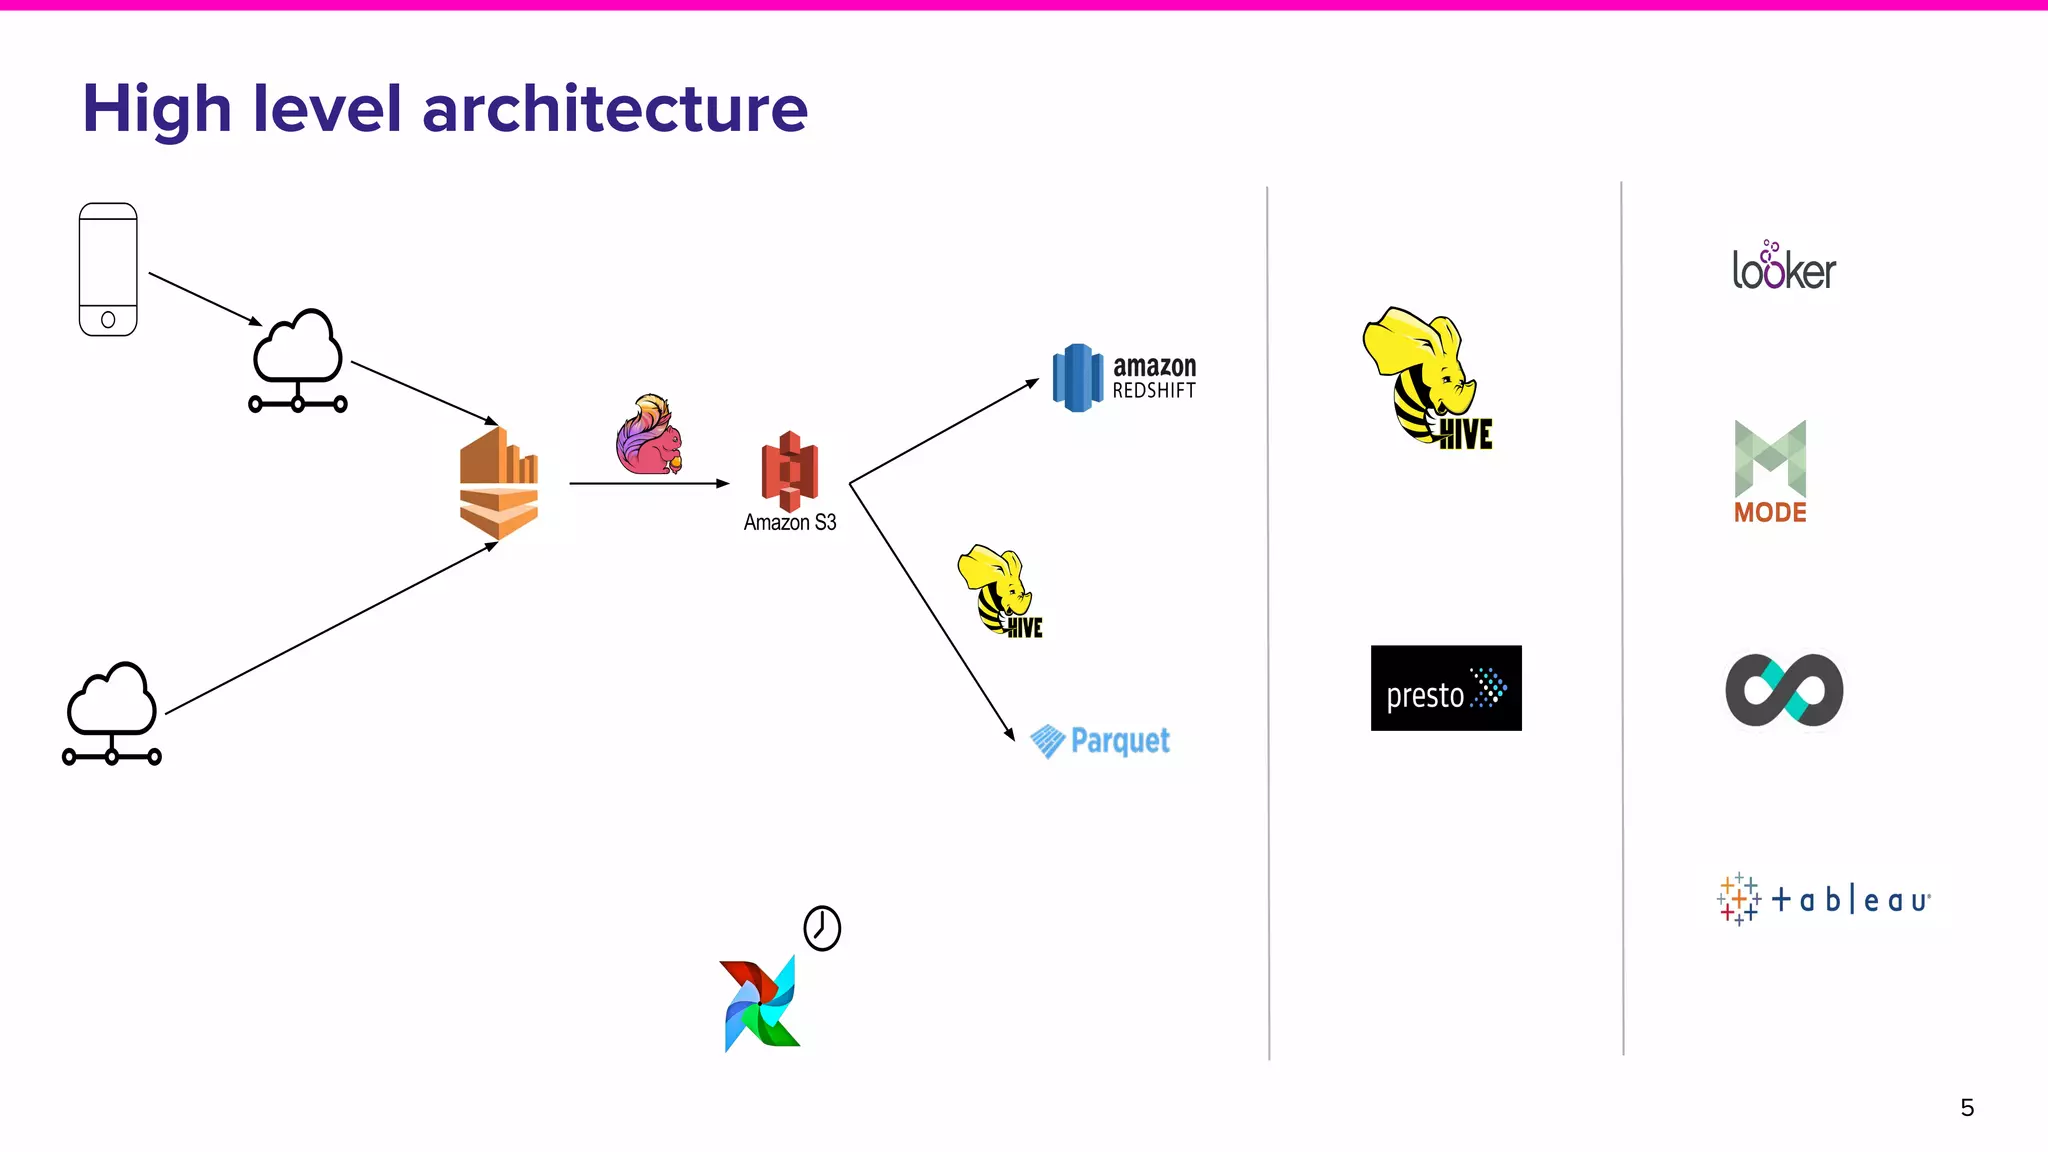
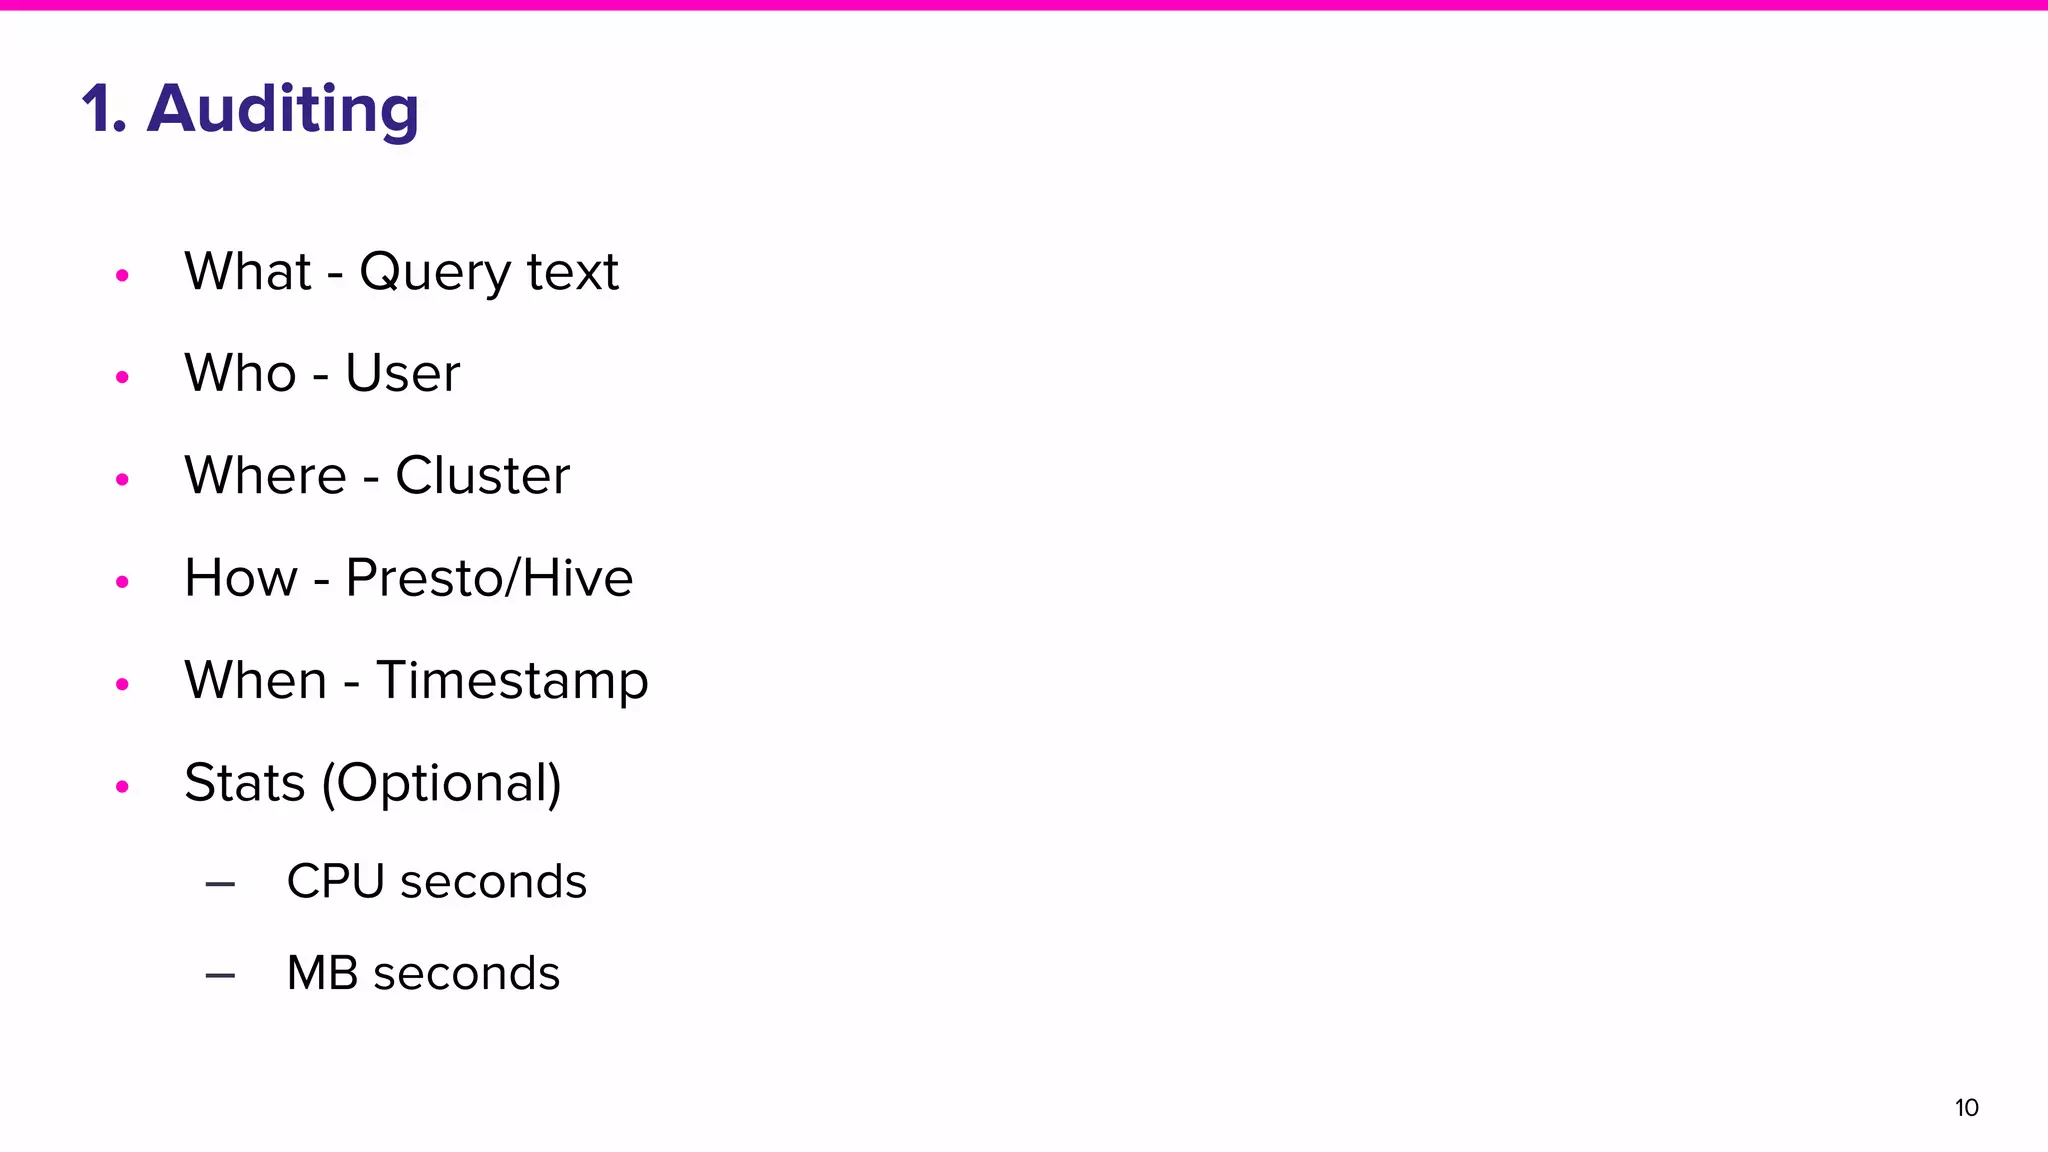
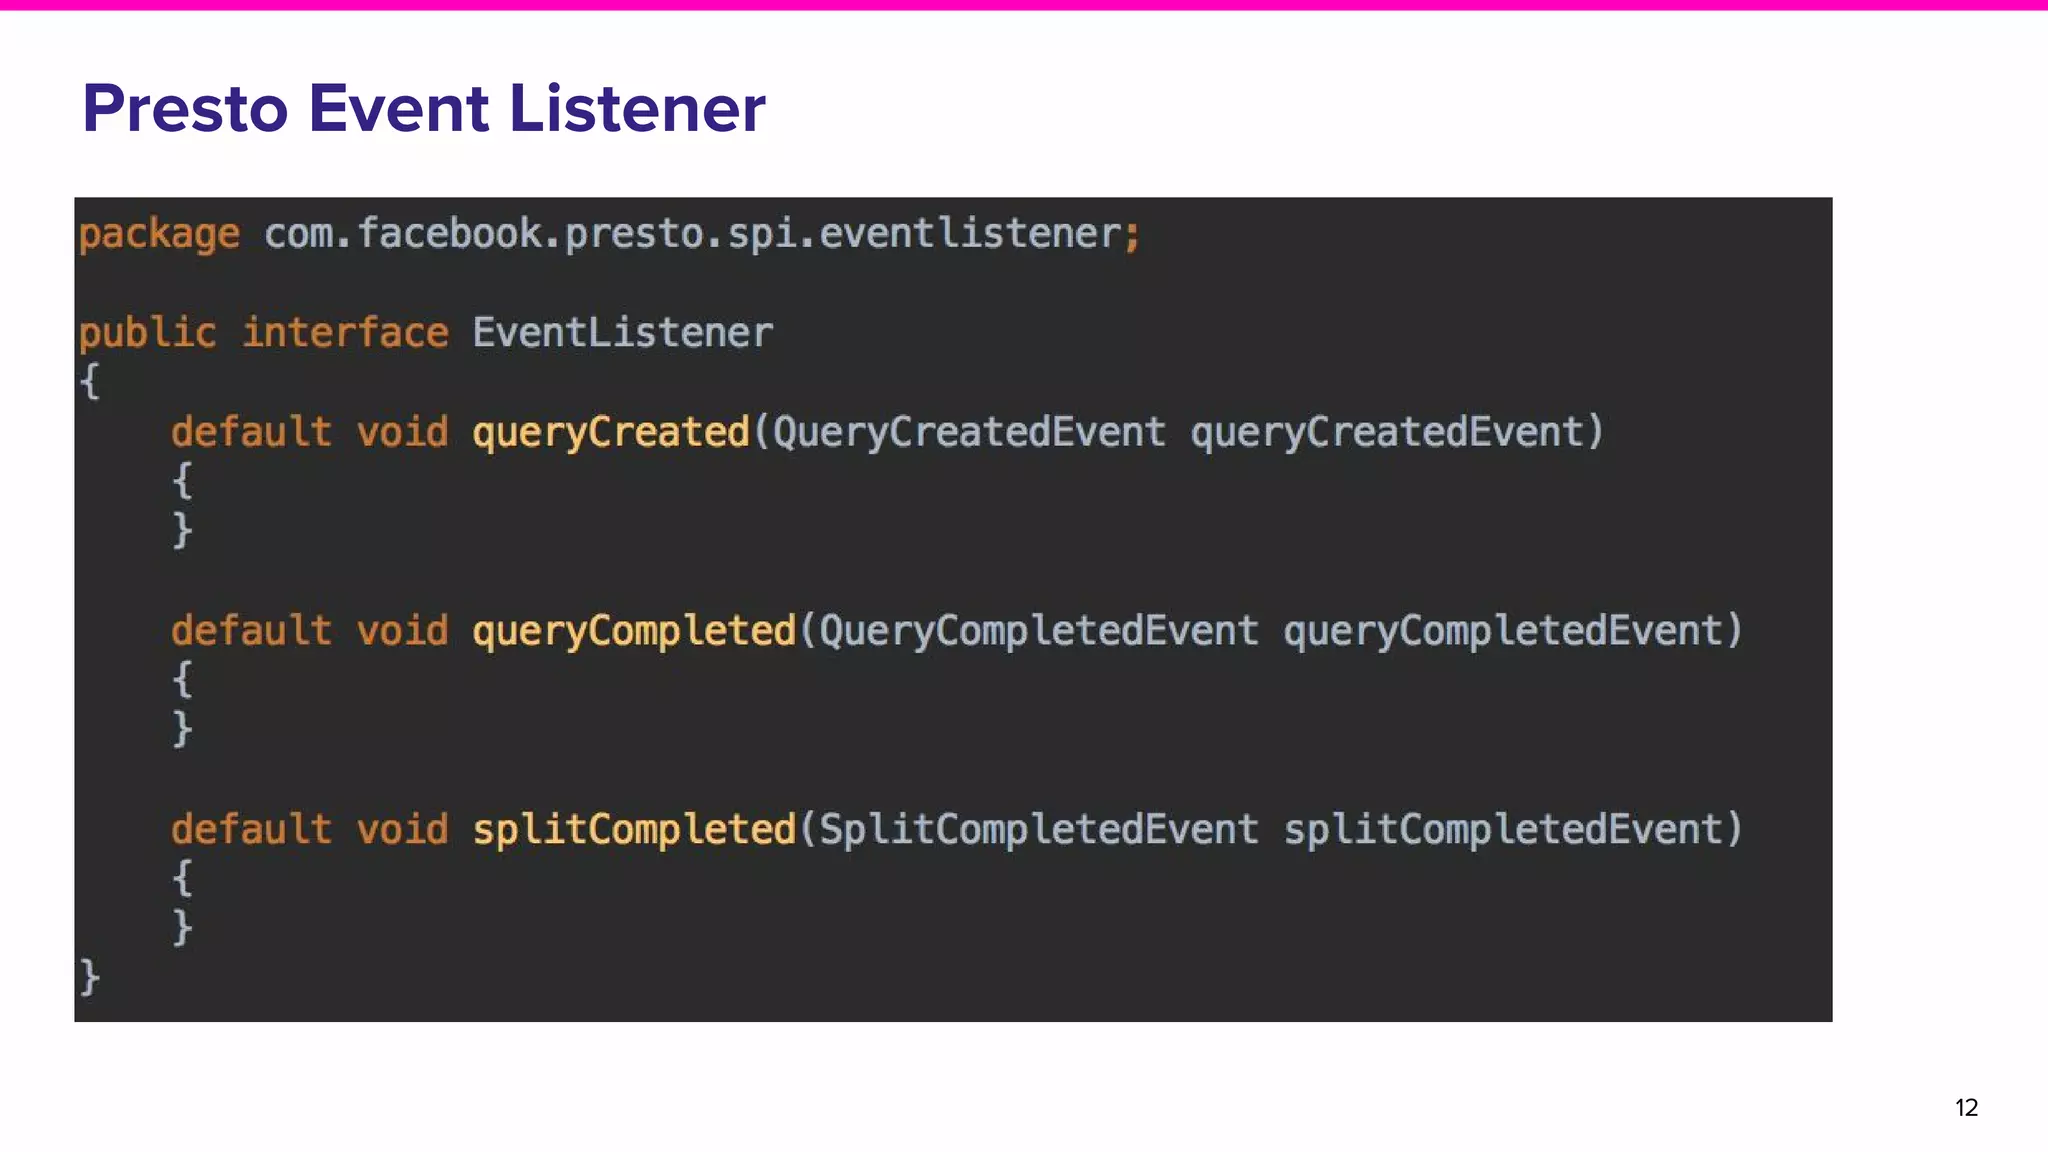
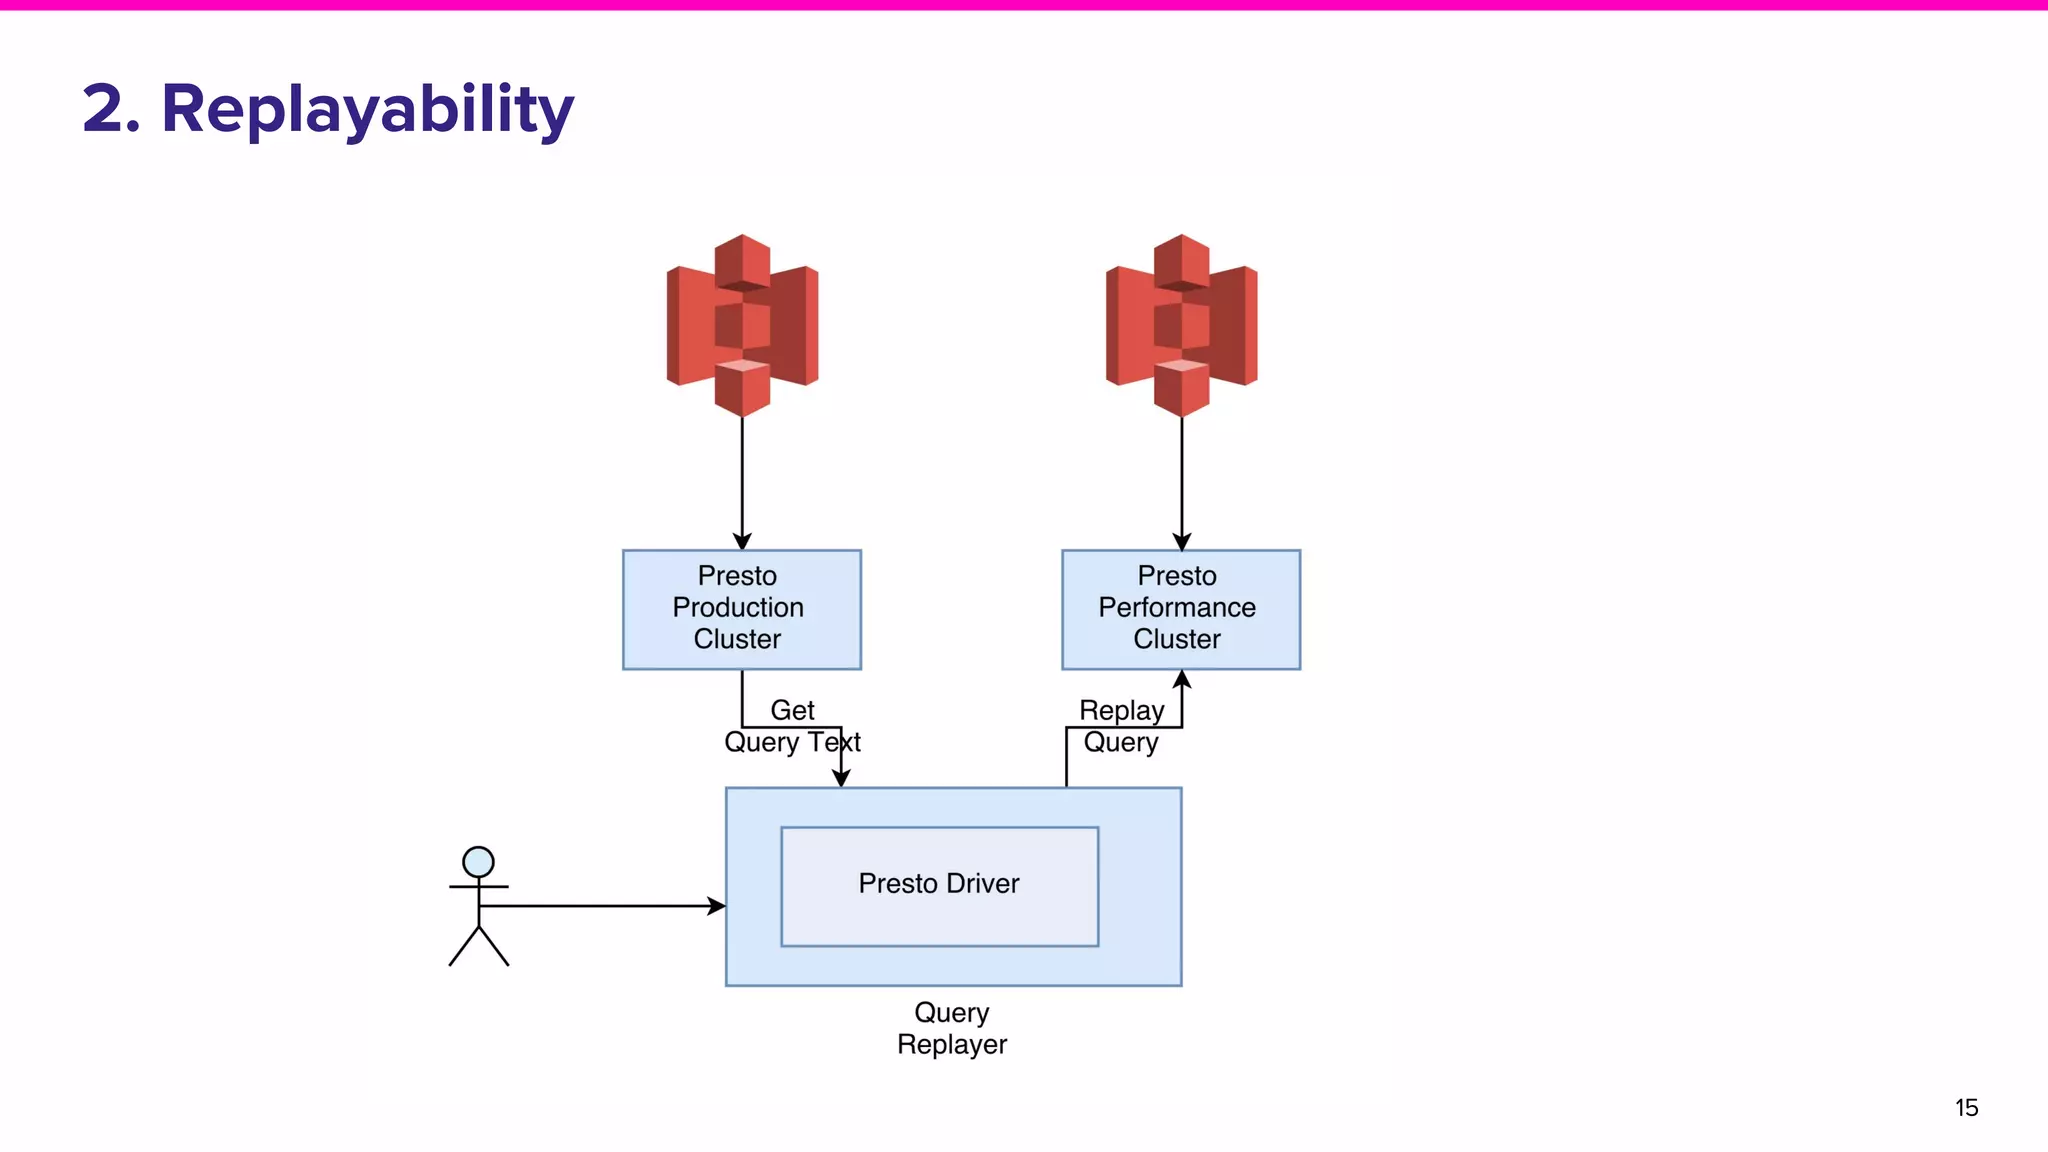
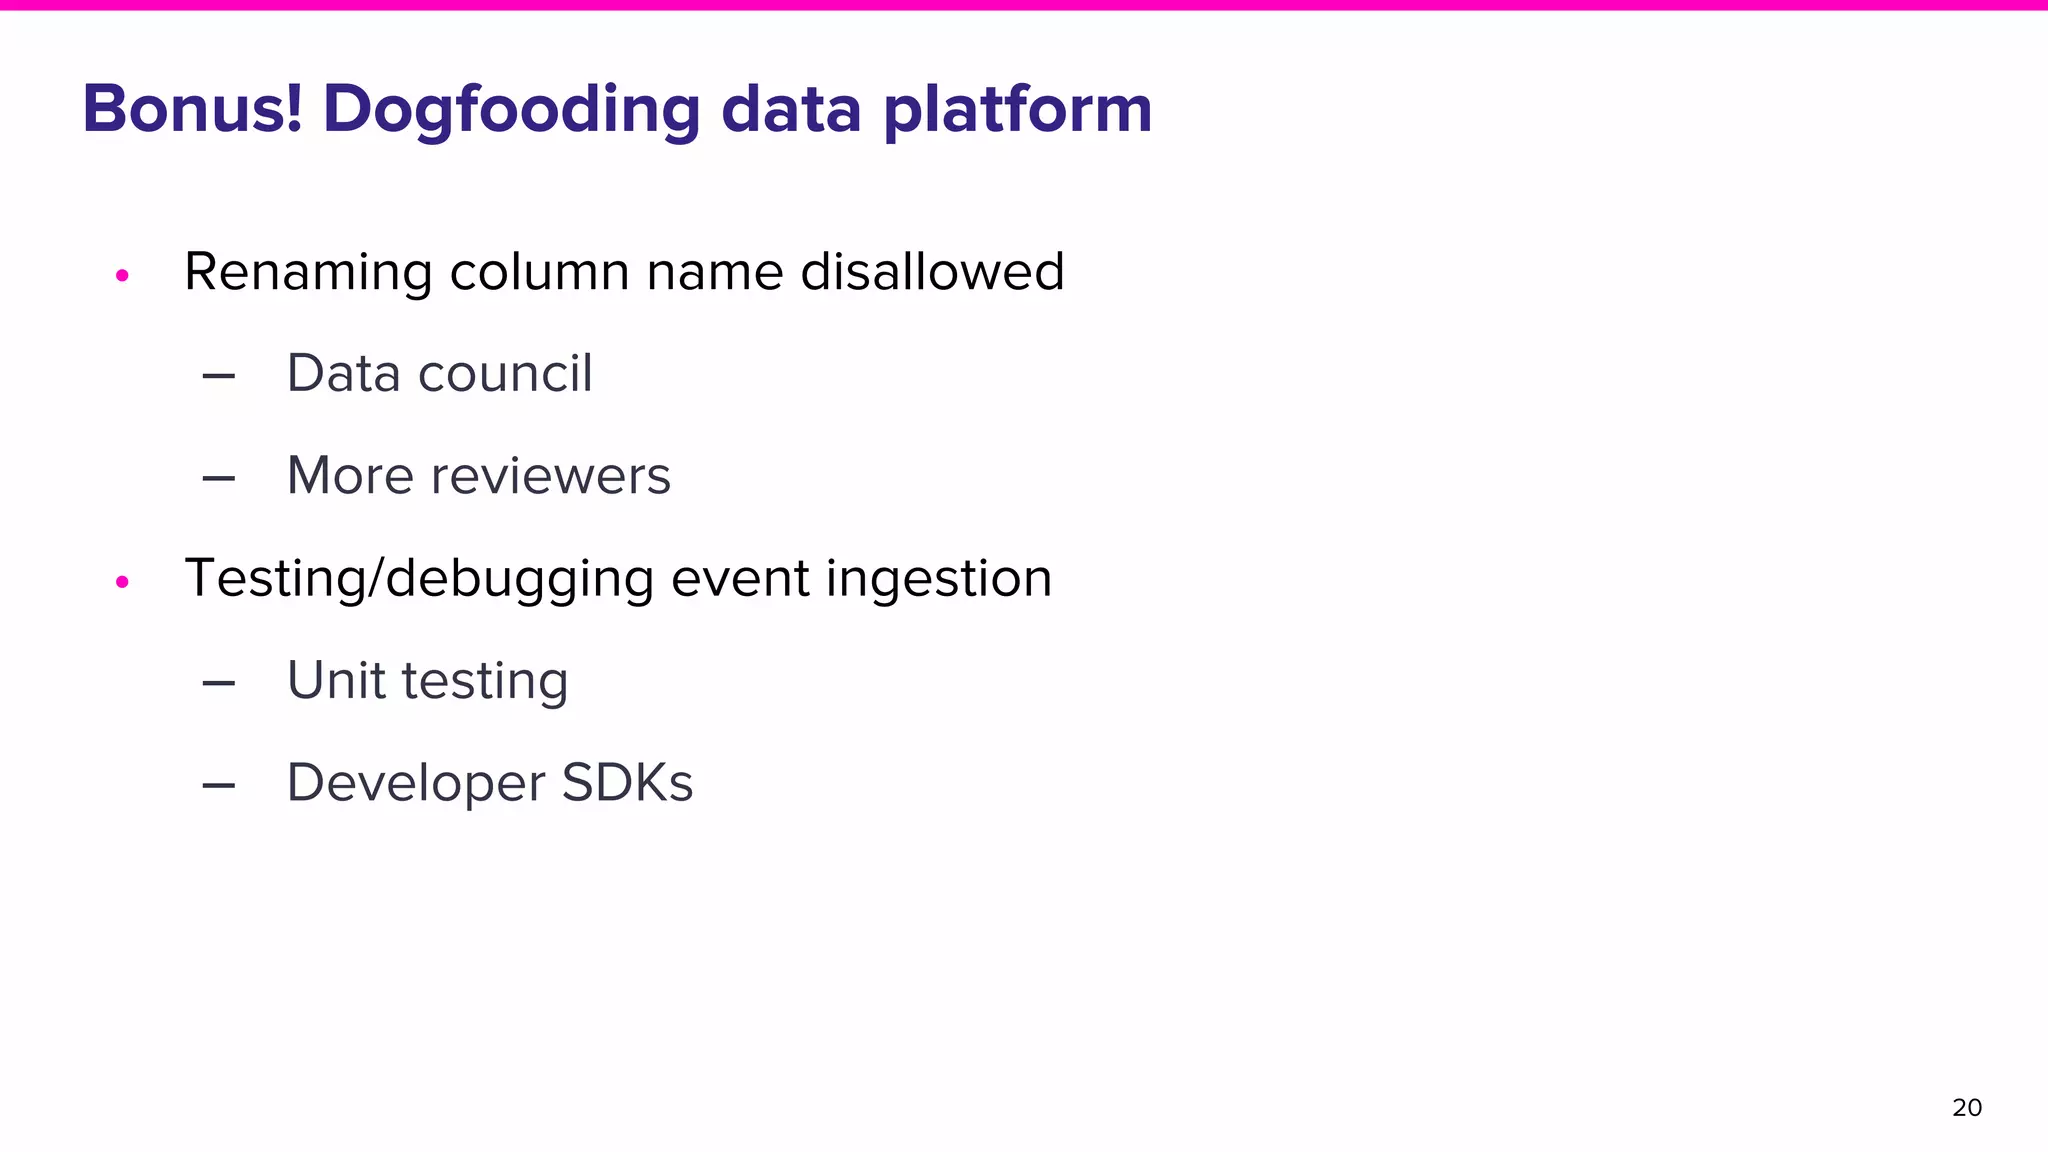
Mark Grover | @mark_grover
Arup Malakar | @amalakar
1
Agenda
• Goals of the Lyft data platform
• High level architecture
• Story about dogfooding
2
Goals of Lyft’s data platform
3
Data Modelers Data Analysts Data Scientists General Managers
Data Platform
Engineers
Quick demo
4
5
High level architecture
There were still some problems
6
Are our users
happy?
Are there common
patterns we can analyze?
How can we best
plan and evaluate?
7
What if we started dogfooding our
own platform to analyze its use?
Requirements
8
Auditing Replayability Error analysisExperimentation Performance
monitoring
How?
9
1. Auditing
• What - Query text
• Who - User
• Where - Cluster
• How - Presto/Hive
• When - Timestamp
• Stats (Optional)
‒ CPU seconds
‒ MB seconds
10
Hive Hook
11
Presto Event Listener
12
Event Schema
13
14
Events ingestion
2. Replayability
15
Replayer Benefits
• Reproduce errors
• Debug
• Fix
• Validate
16
3. Error analysis
17
4. Performance monitoring
•
18
5. Experimentation
• Enrich benchto benchmark
• Golden set of queries
• Benchmark
‒ New version
‒ Config change
• Run queries to evaluate new systems
19
Bonus! Dogfooding data platform
• Renaming column name disallowed
‒ Data council
‒ More reviewers
• Testing/debugging event ingestion
‒ Unit testing
‒ Developer SDKs
20
Quick demo
21
Summary
• Users - GMs, data modelers, analysts, engineers & data scientists
• Architecture
• Dogfooding
• Learning
22
Thank you!
23
Mark Grover
Arup Malakar
Icons under Creative Commons License from
https://thenounproject.com/

Dogfooding data at Lyft