This document summarizes LinkedIn's efforts to implement real-time monitoring of their big data workflows. Key points include:
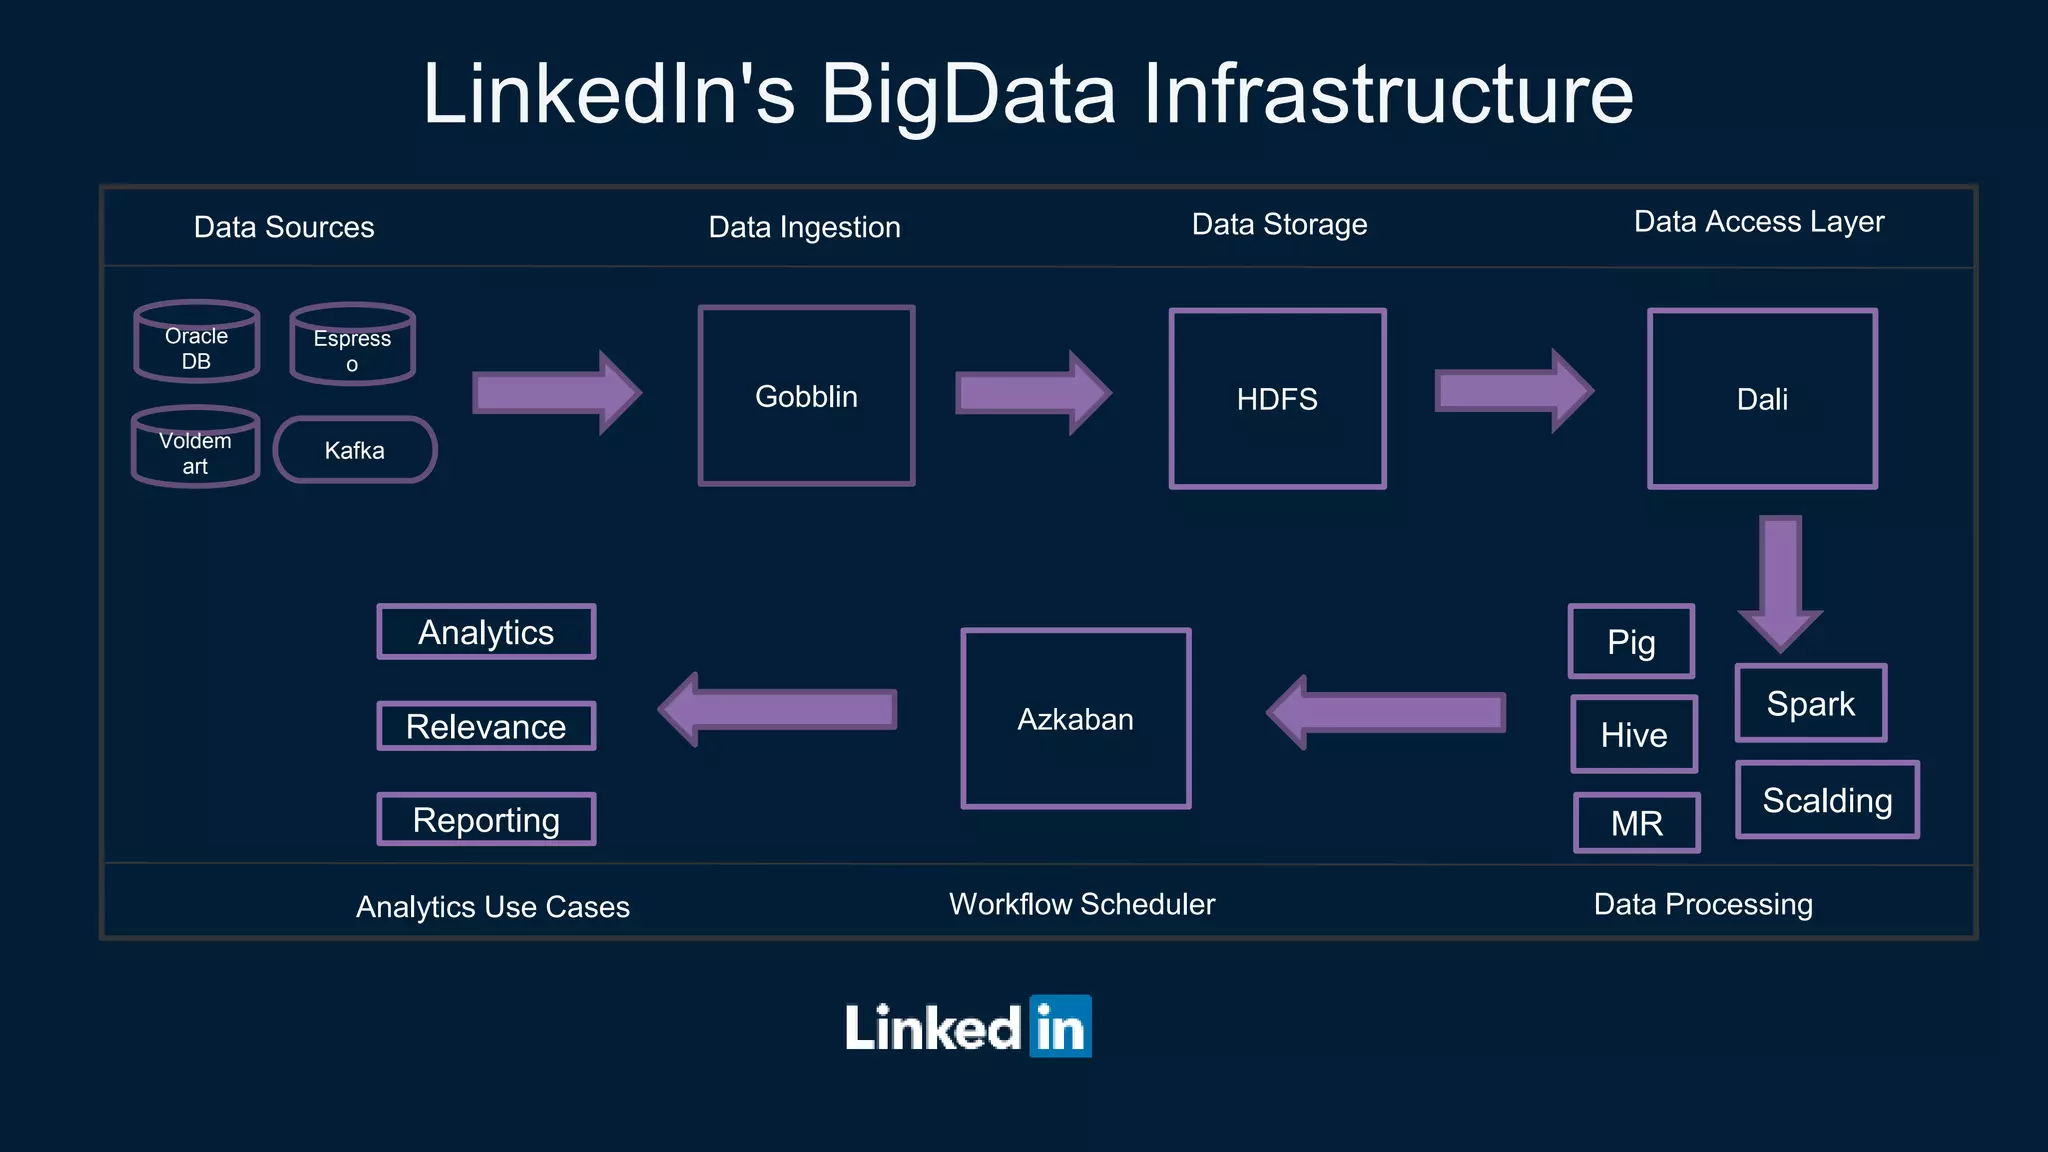
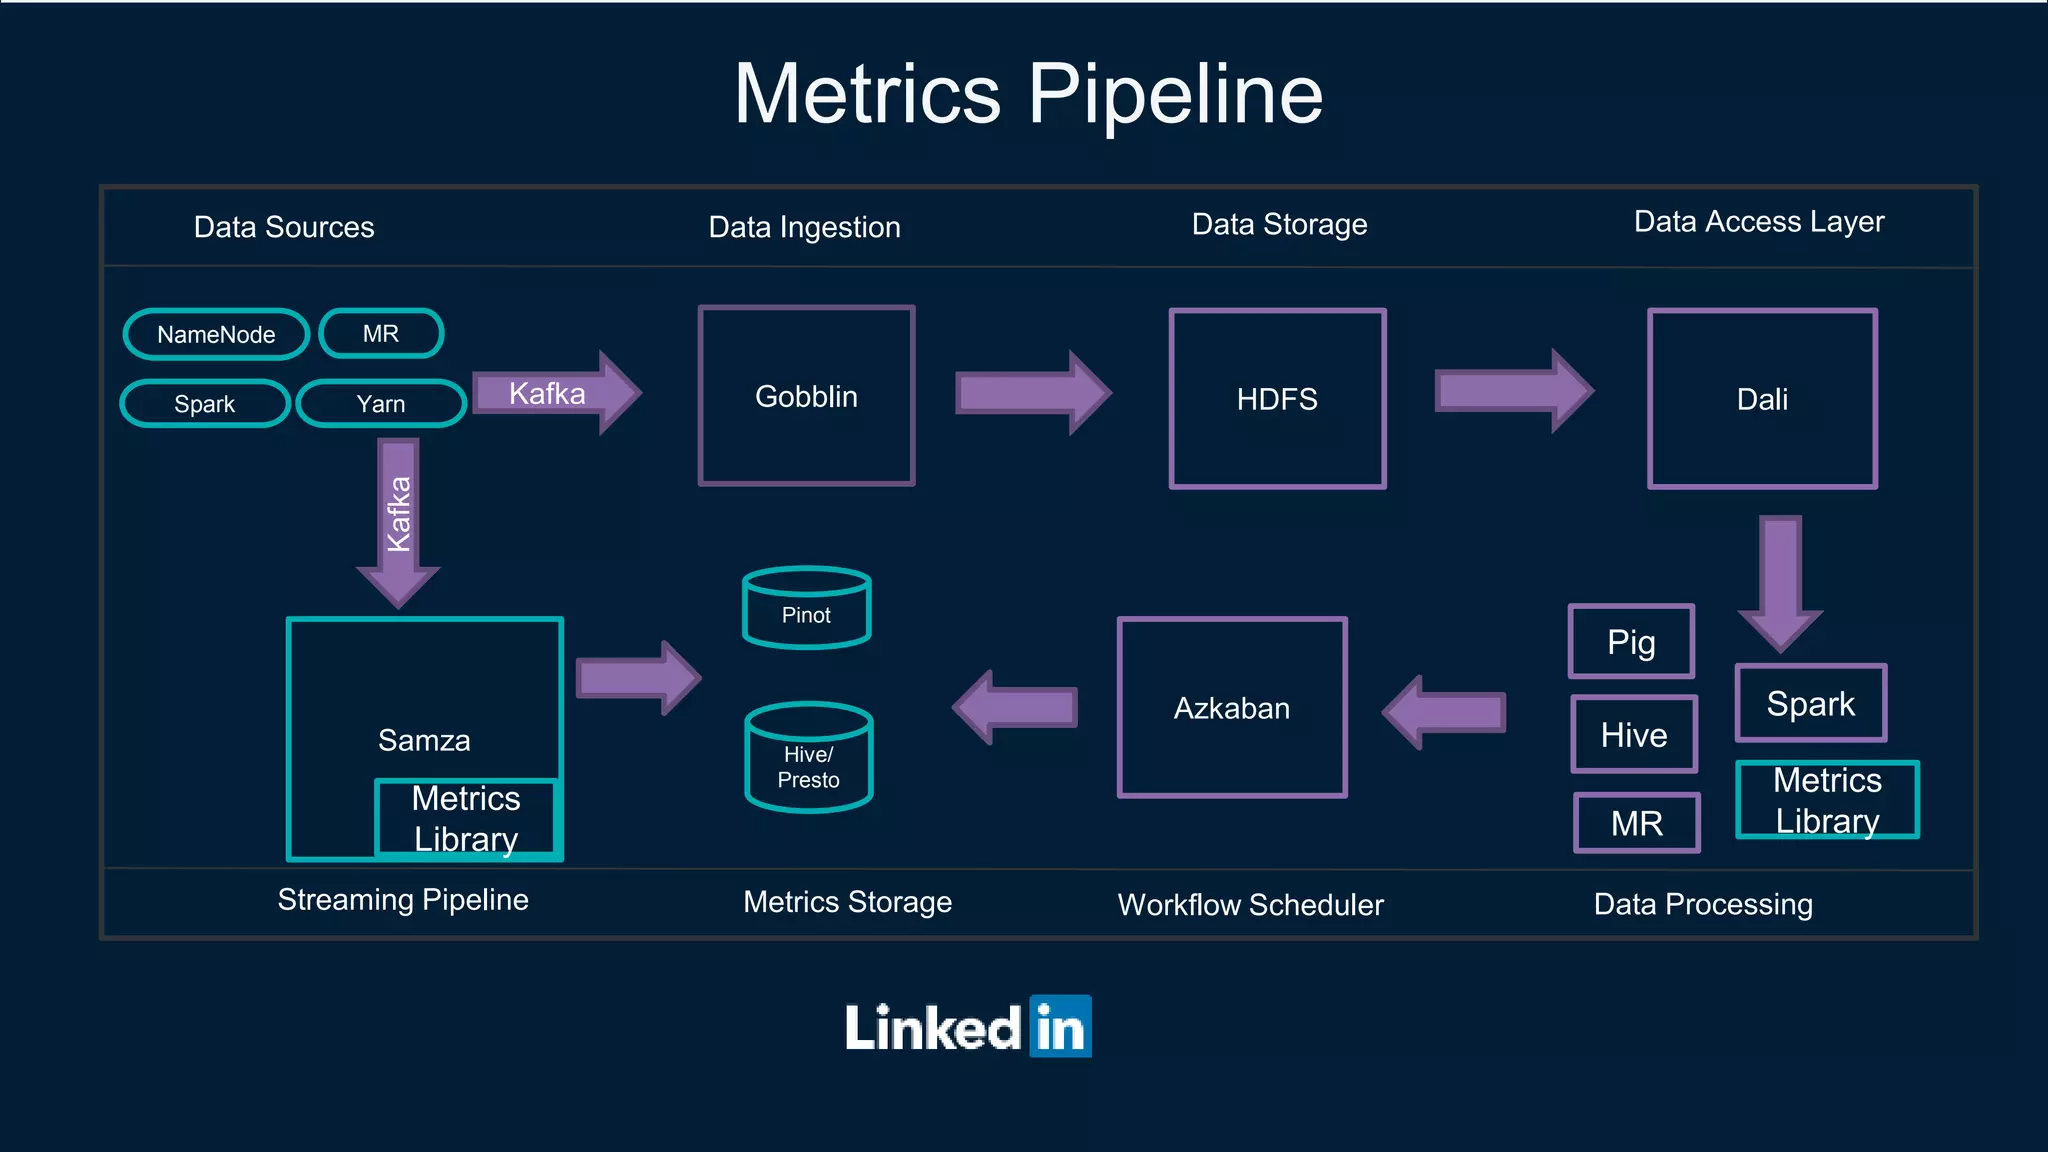
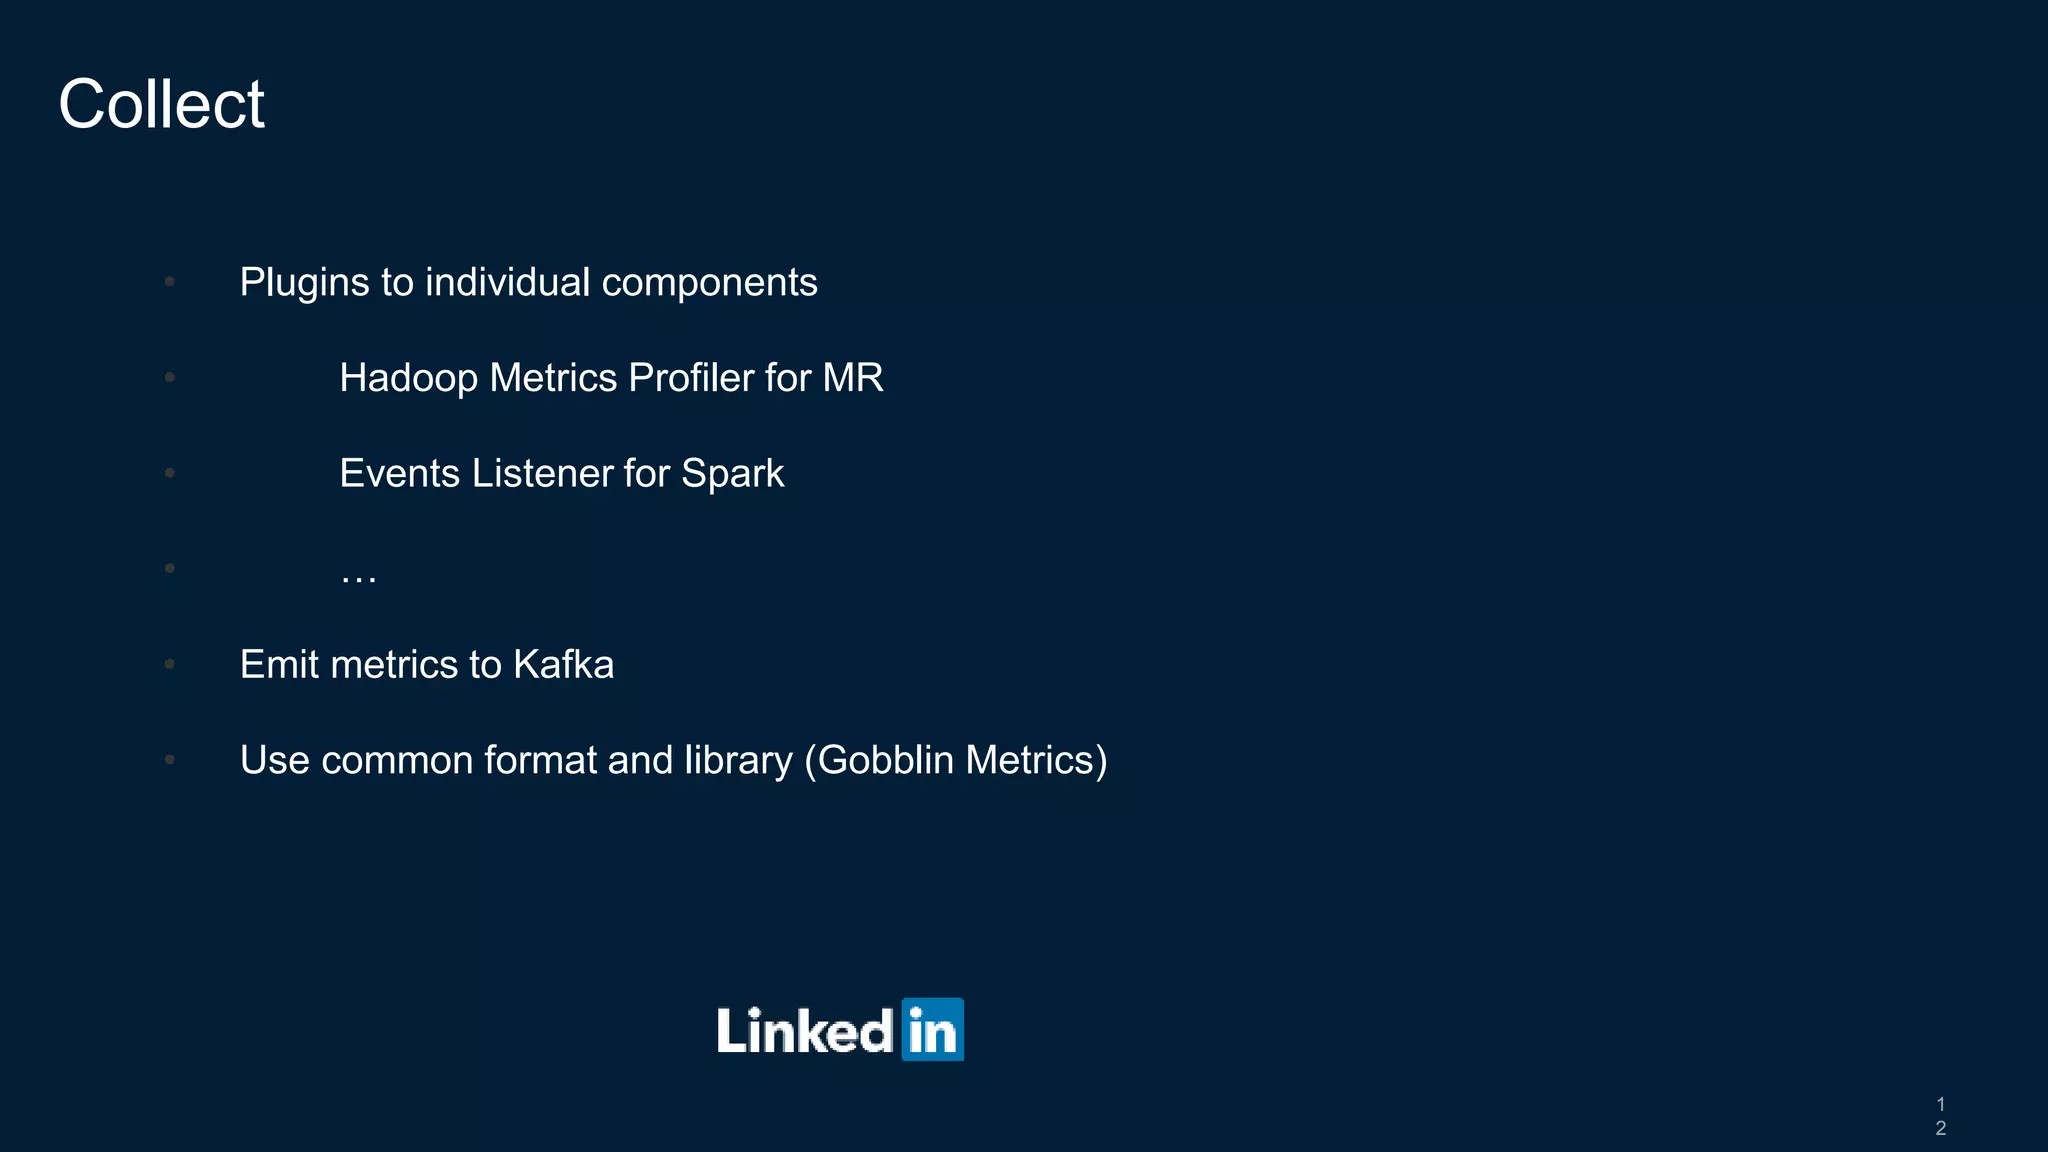
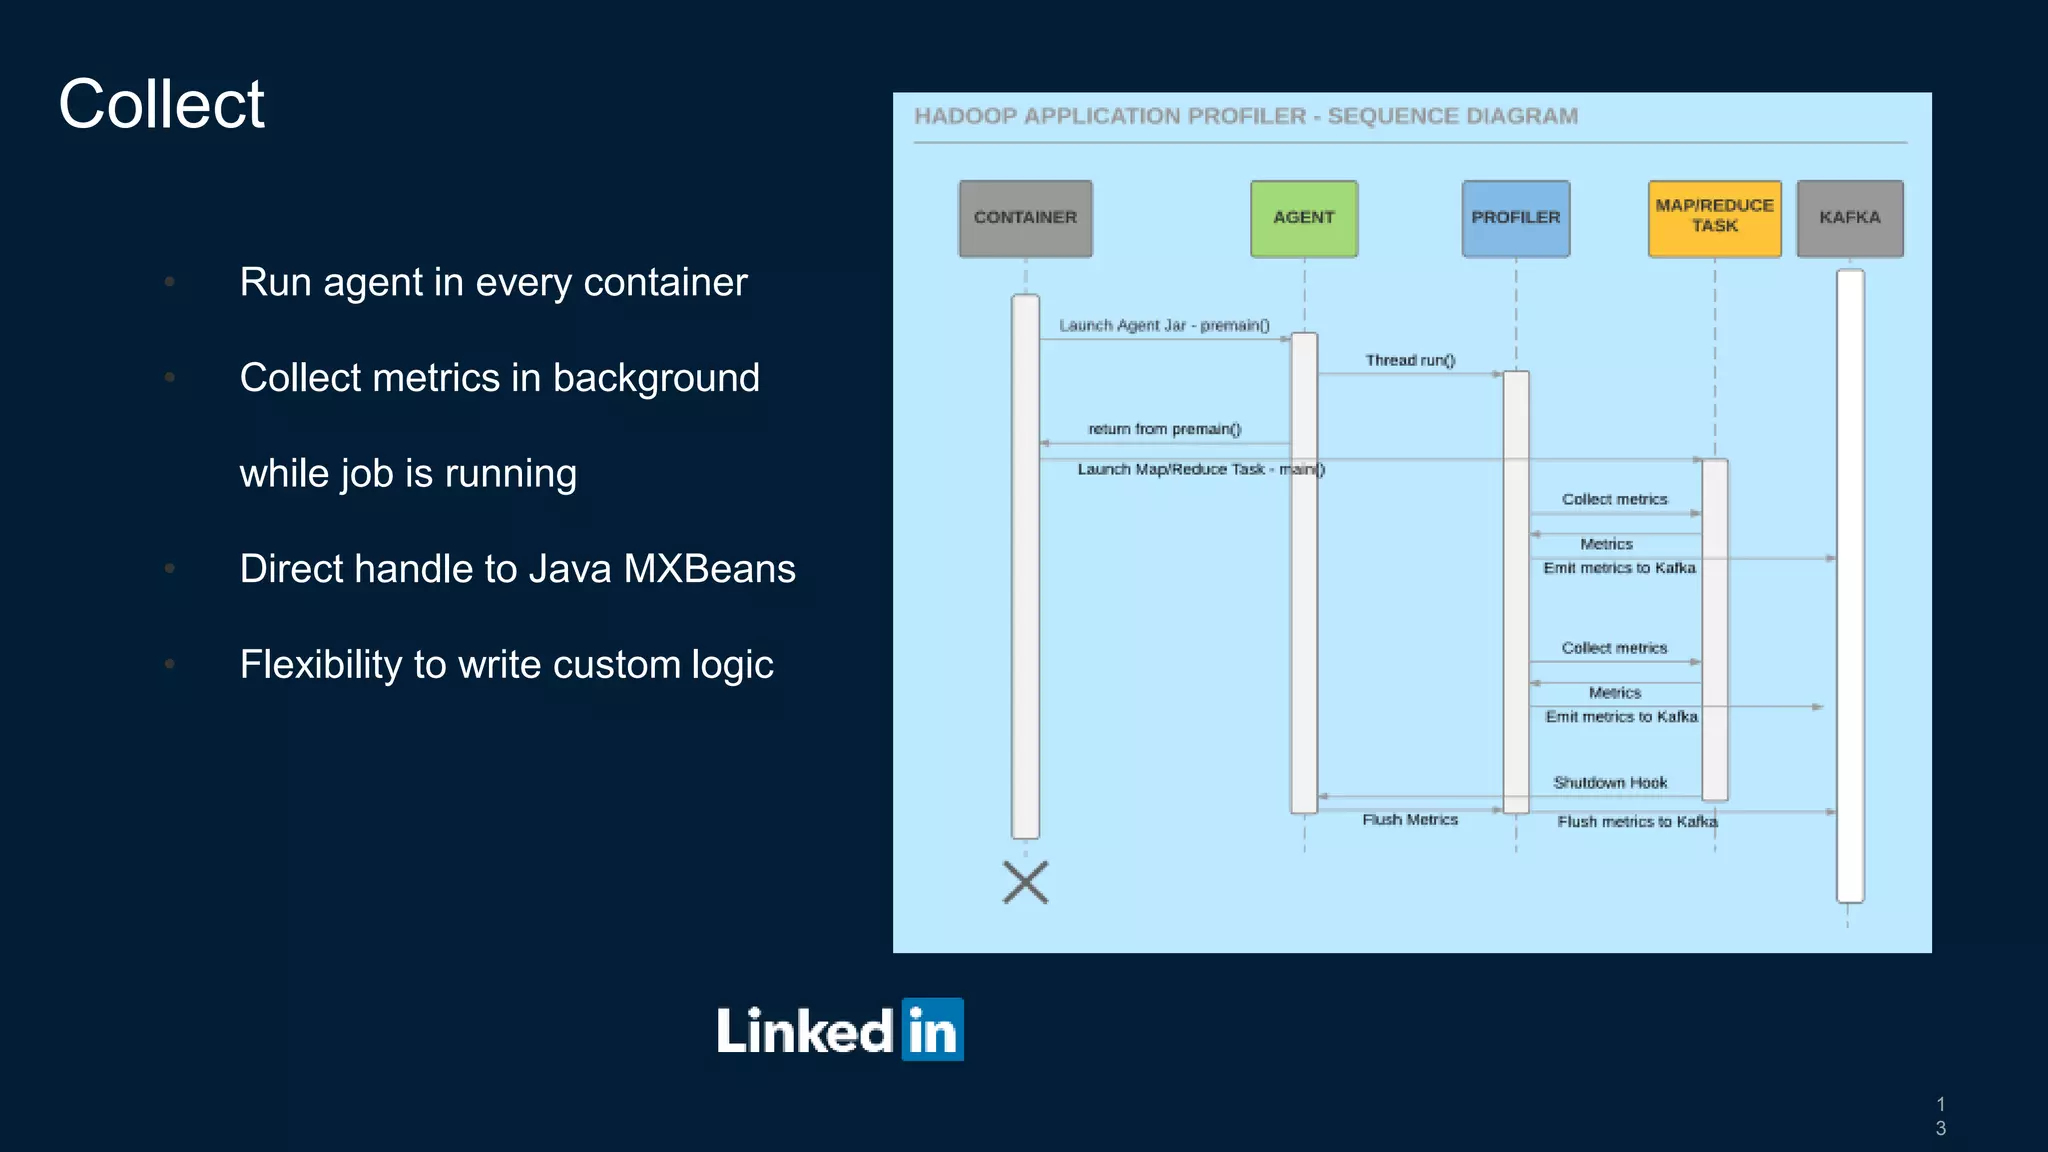
- They collect metrics from Hadoop and Spark components using plugins and ship them to Kafka for storage and processing.
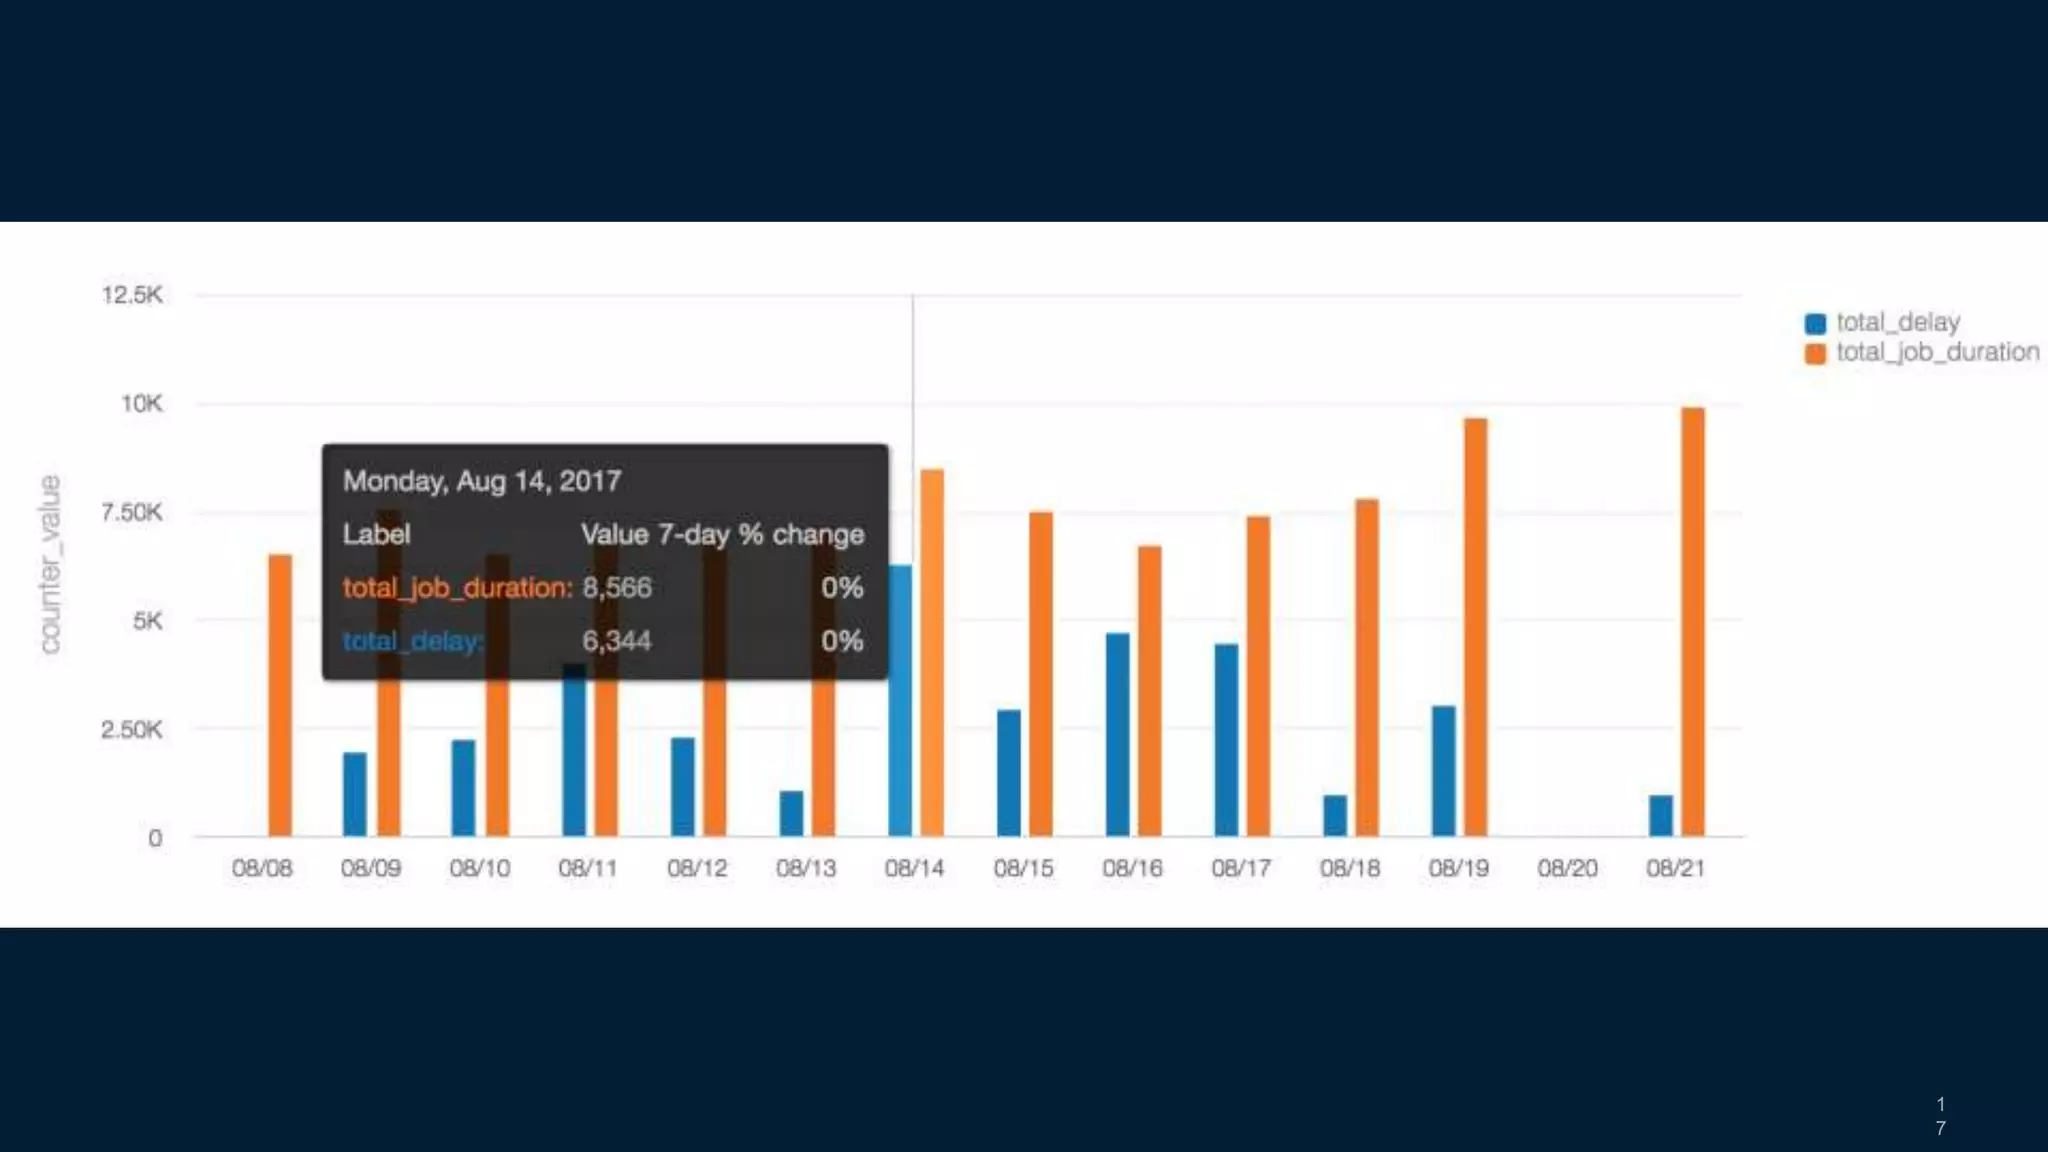
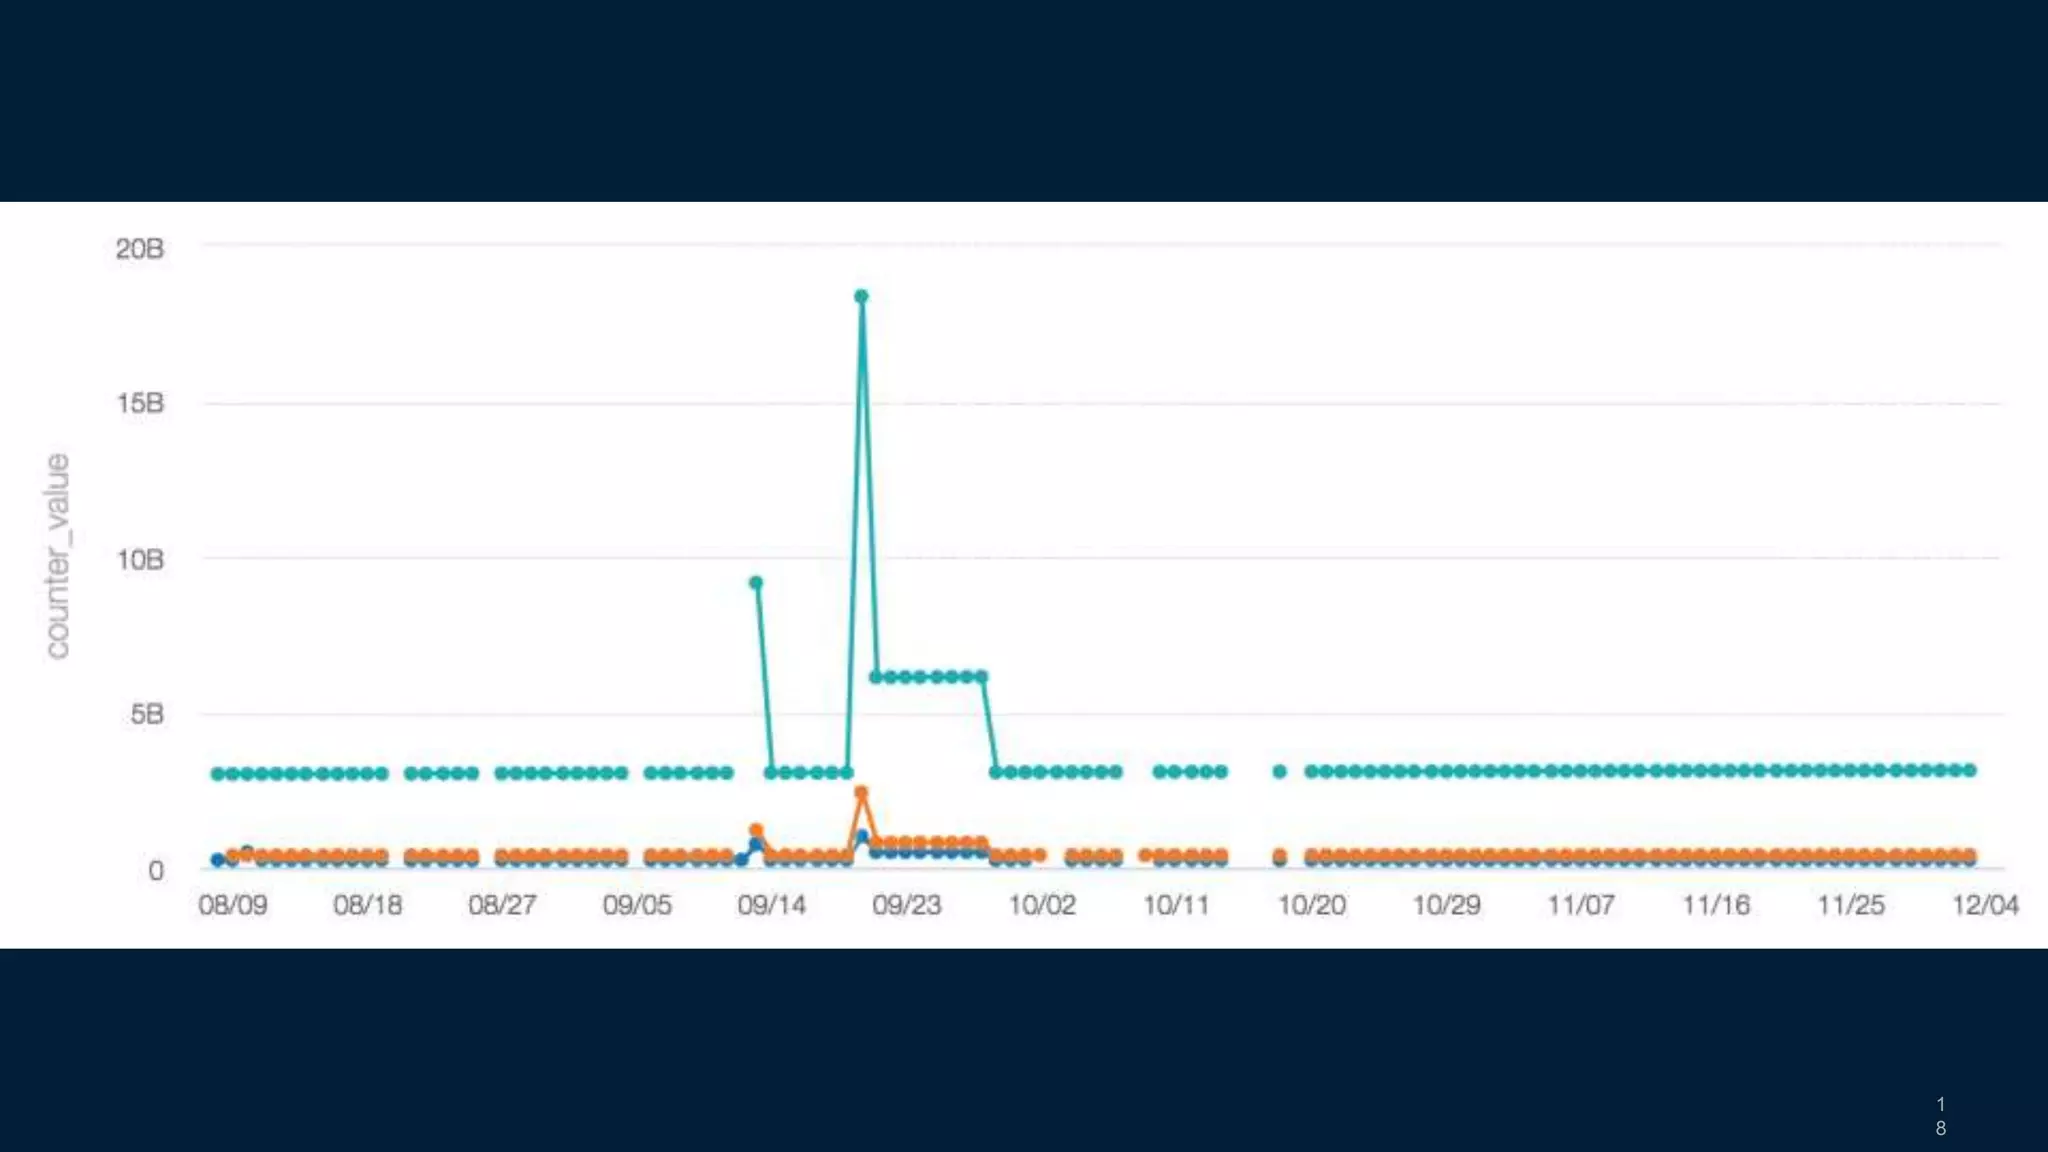
- A metrics pipeline calculates higher-level business metrics and stores them in Pinot for fast retrieval and Hive/Presto for long-term storage.
- Visualization, alerting, and analysis tools like Raptor and Third-Eye are used to analyze the metrics.
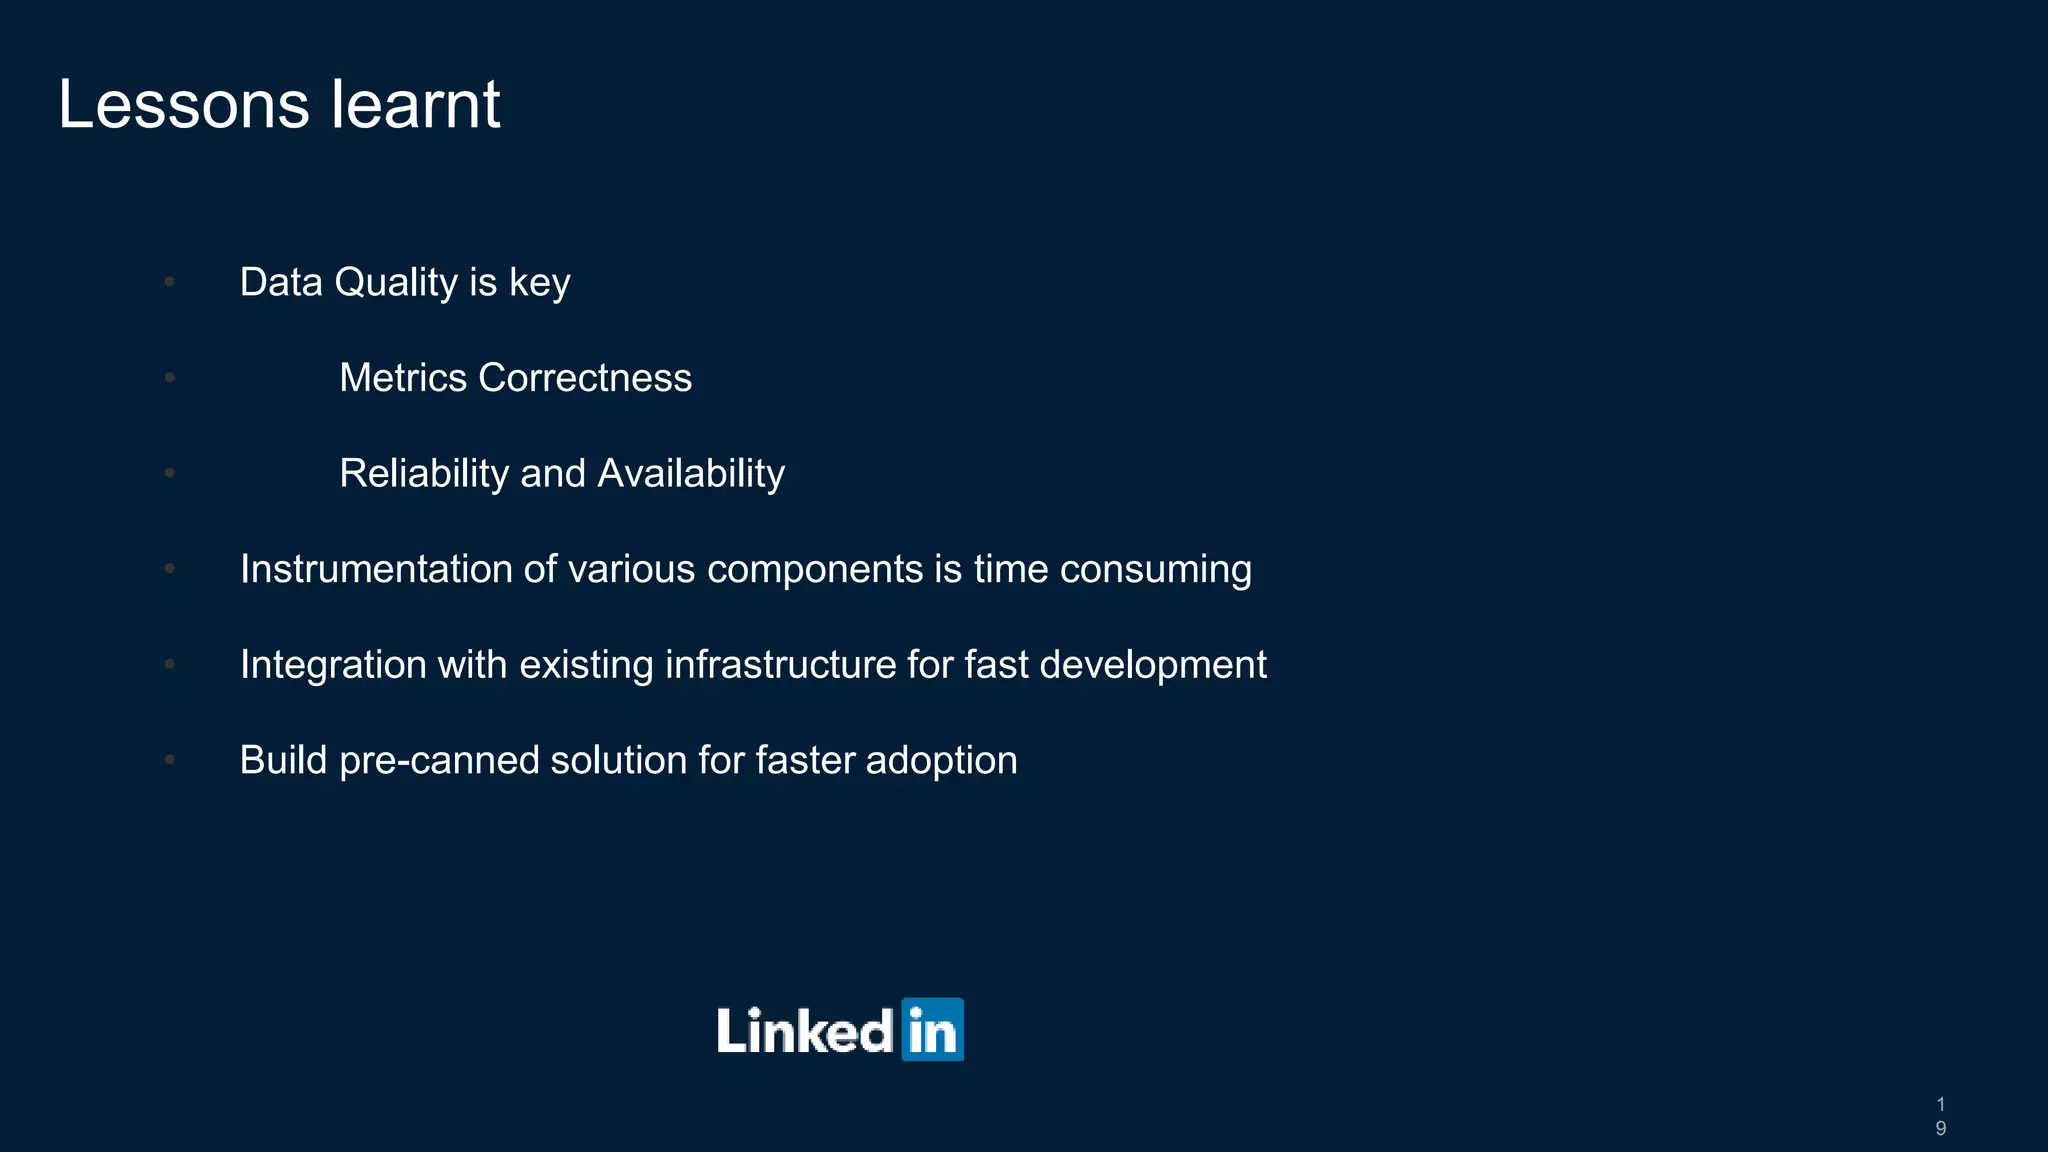
- Lessons learned include the importance of data quality, instrumentation, and integration with existing infrastructure.