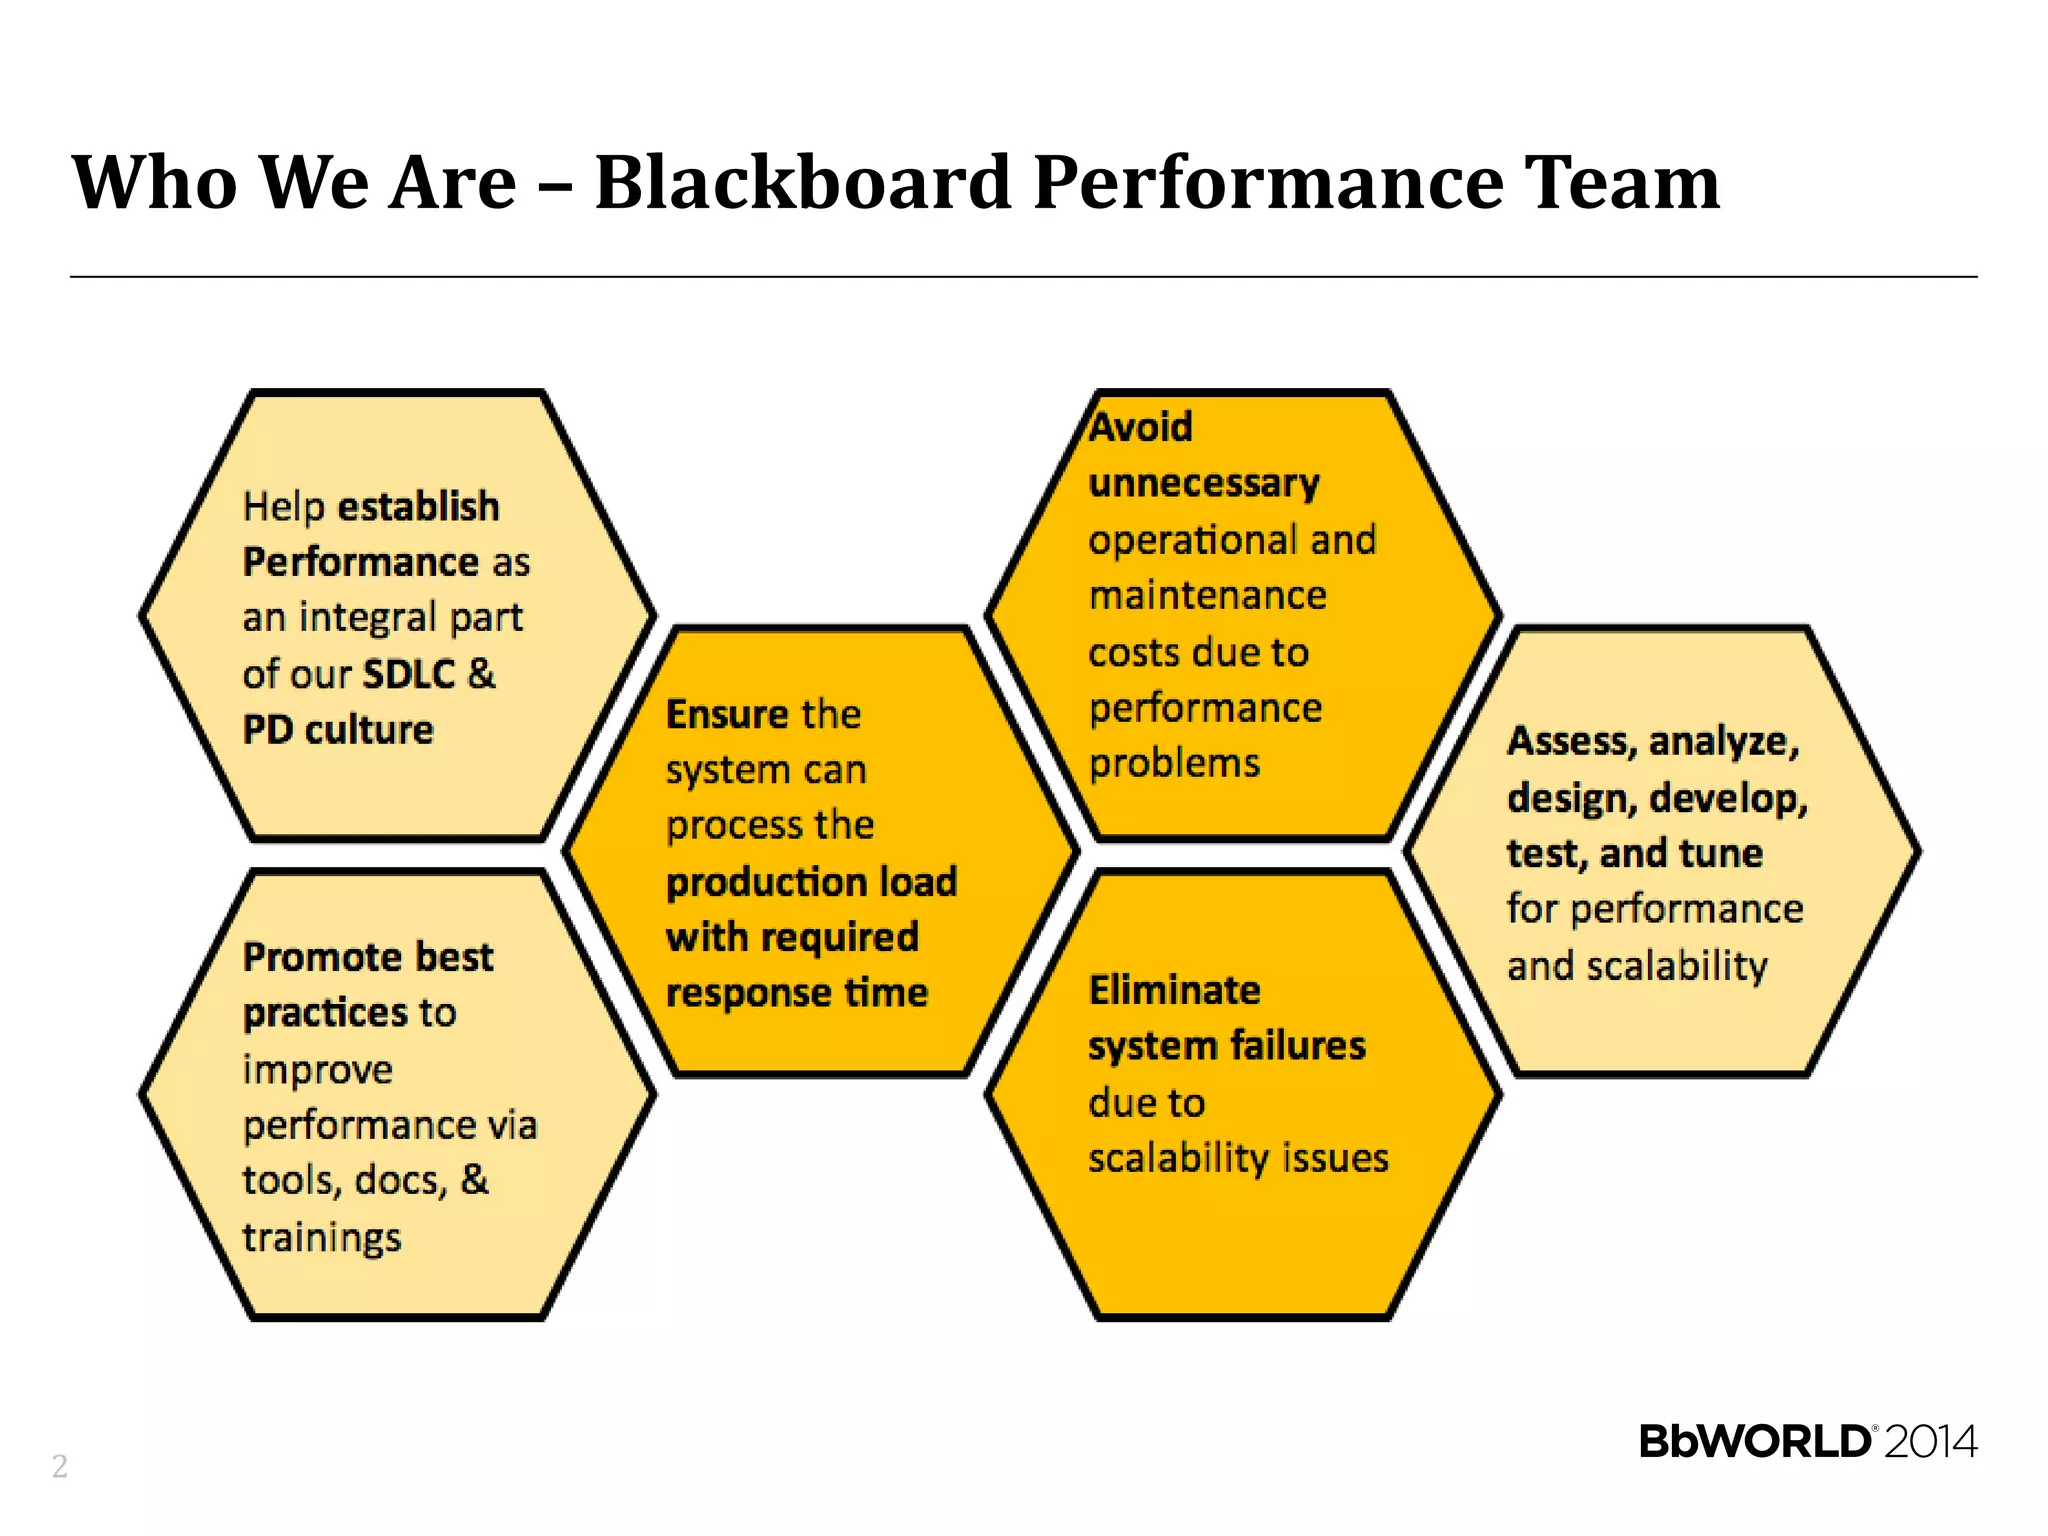
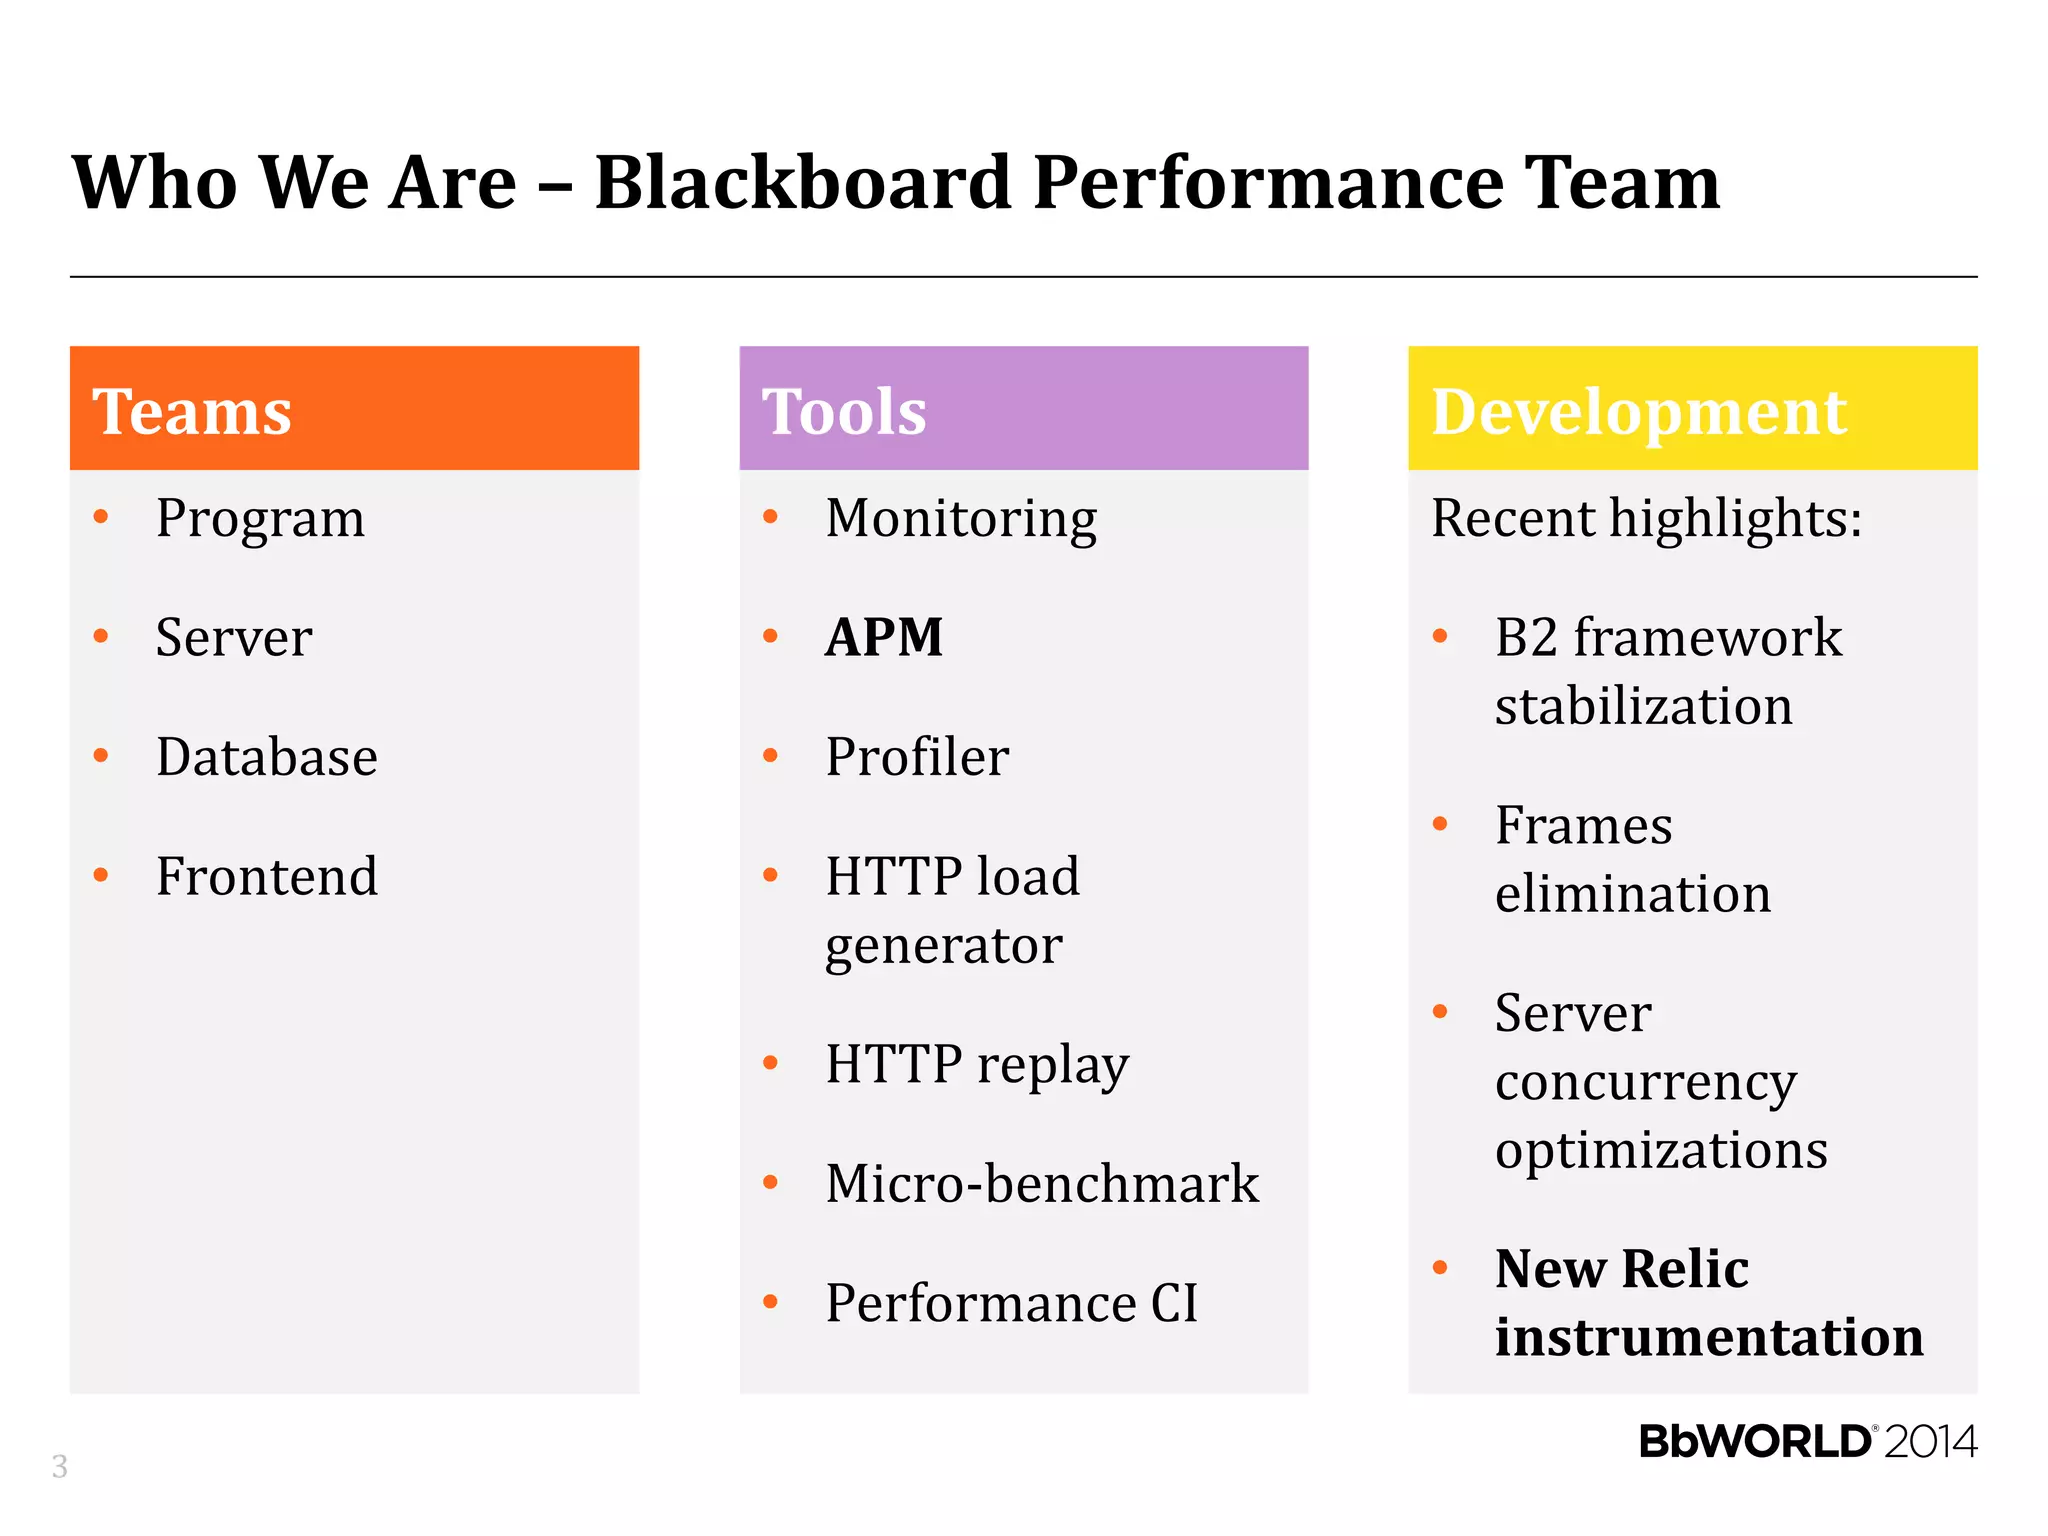
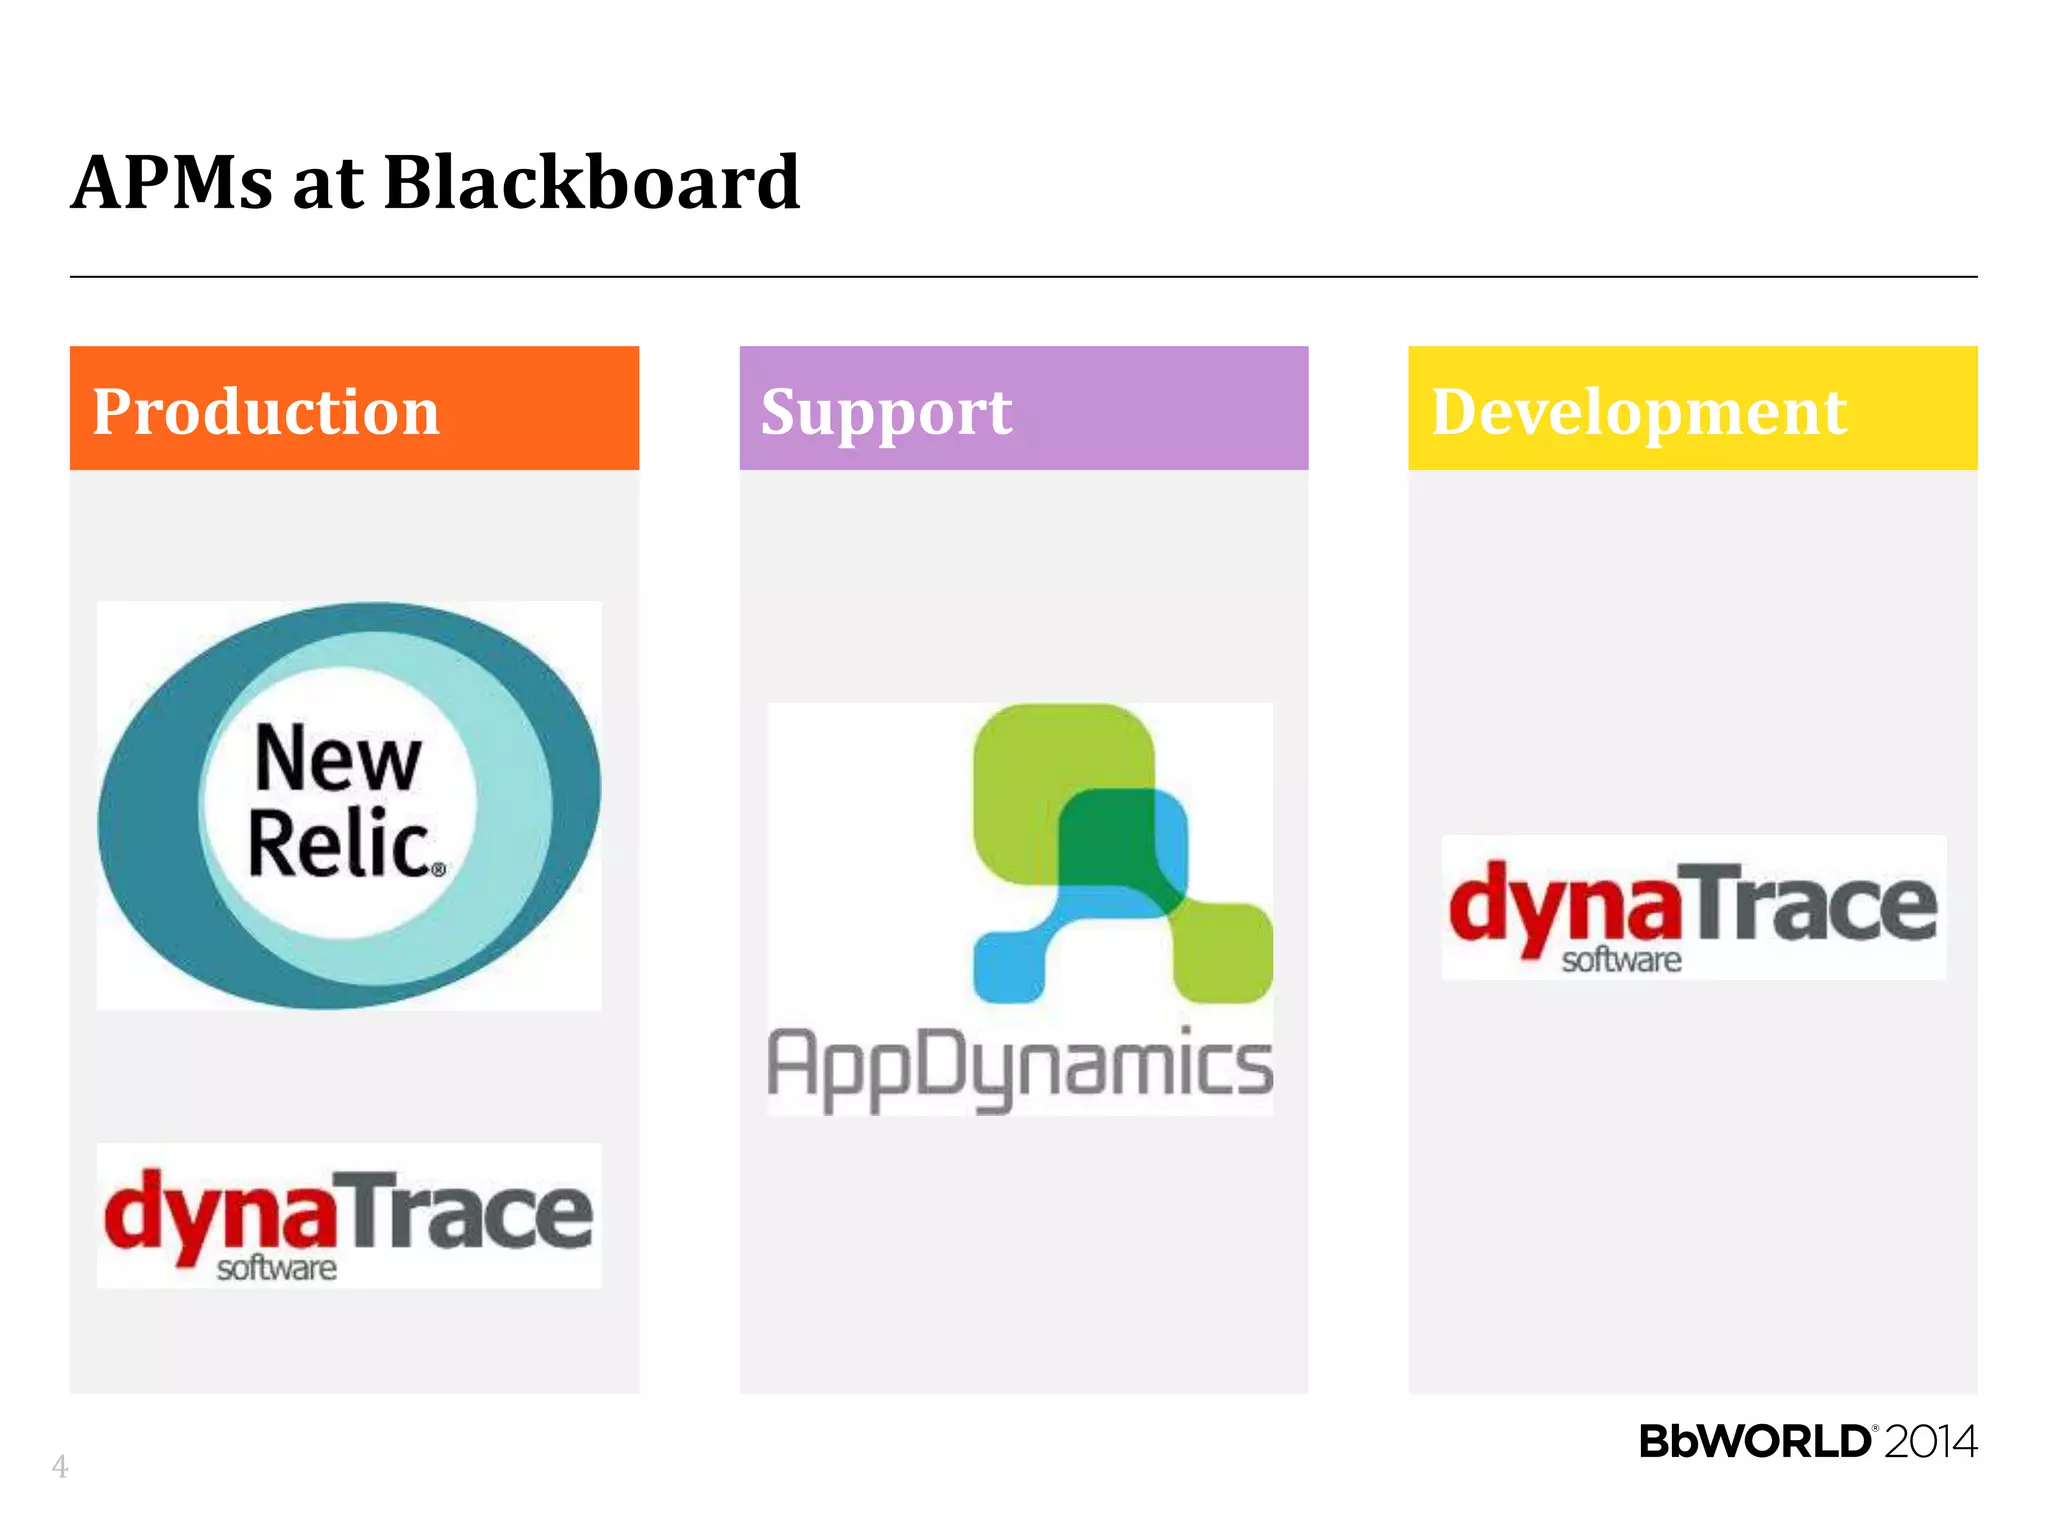
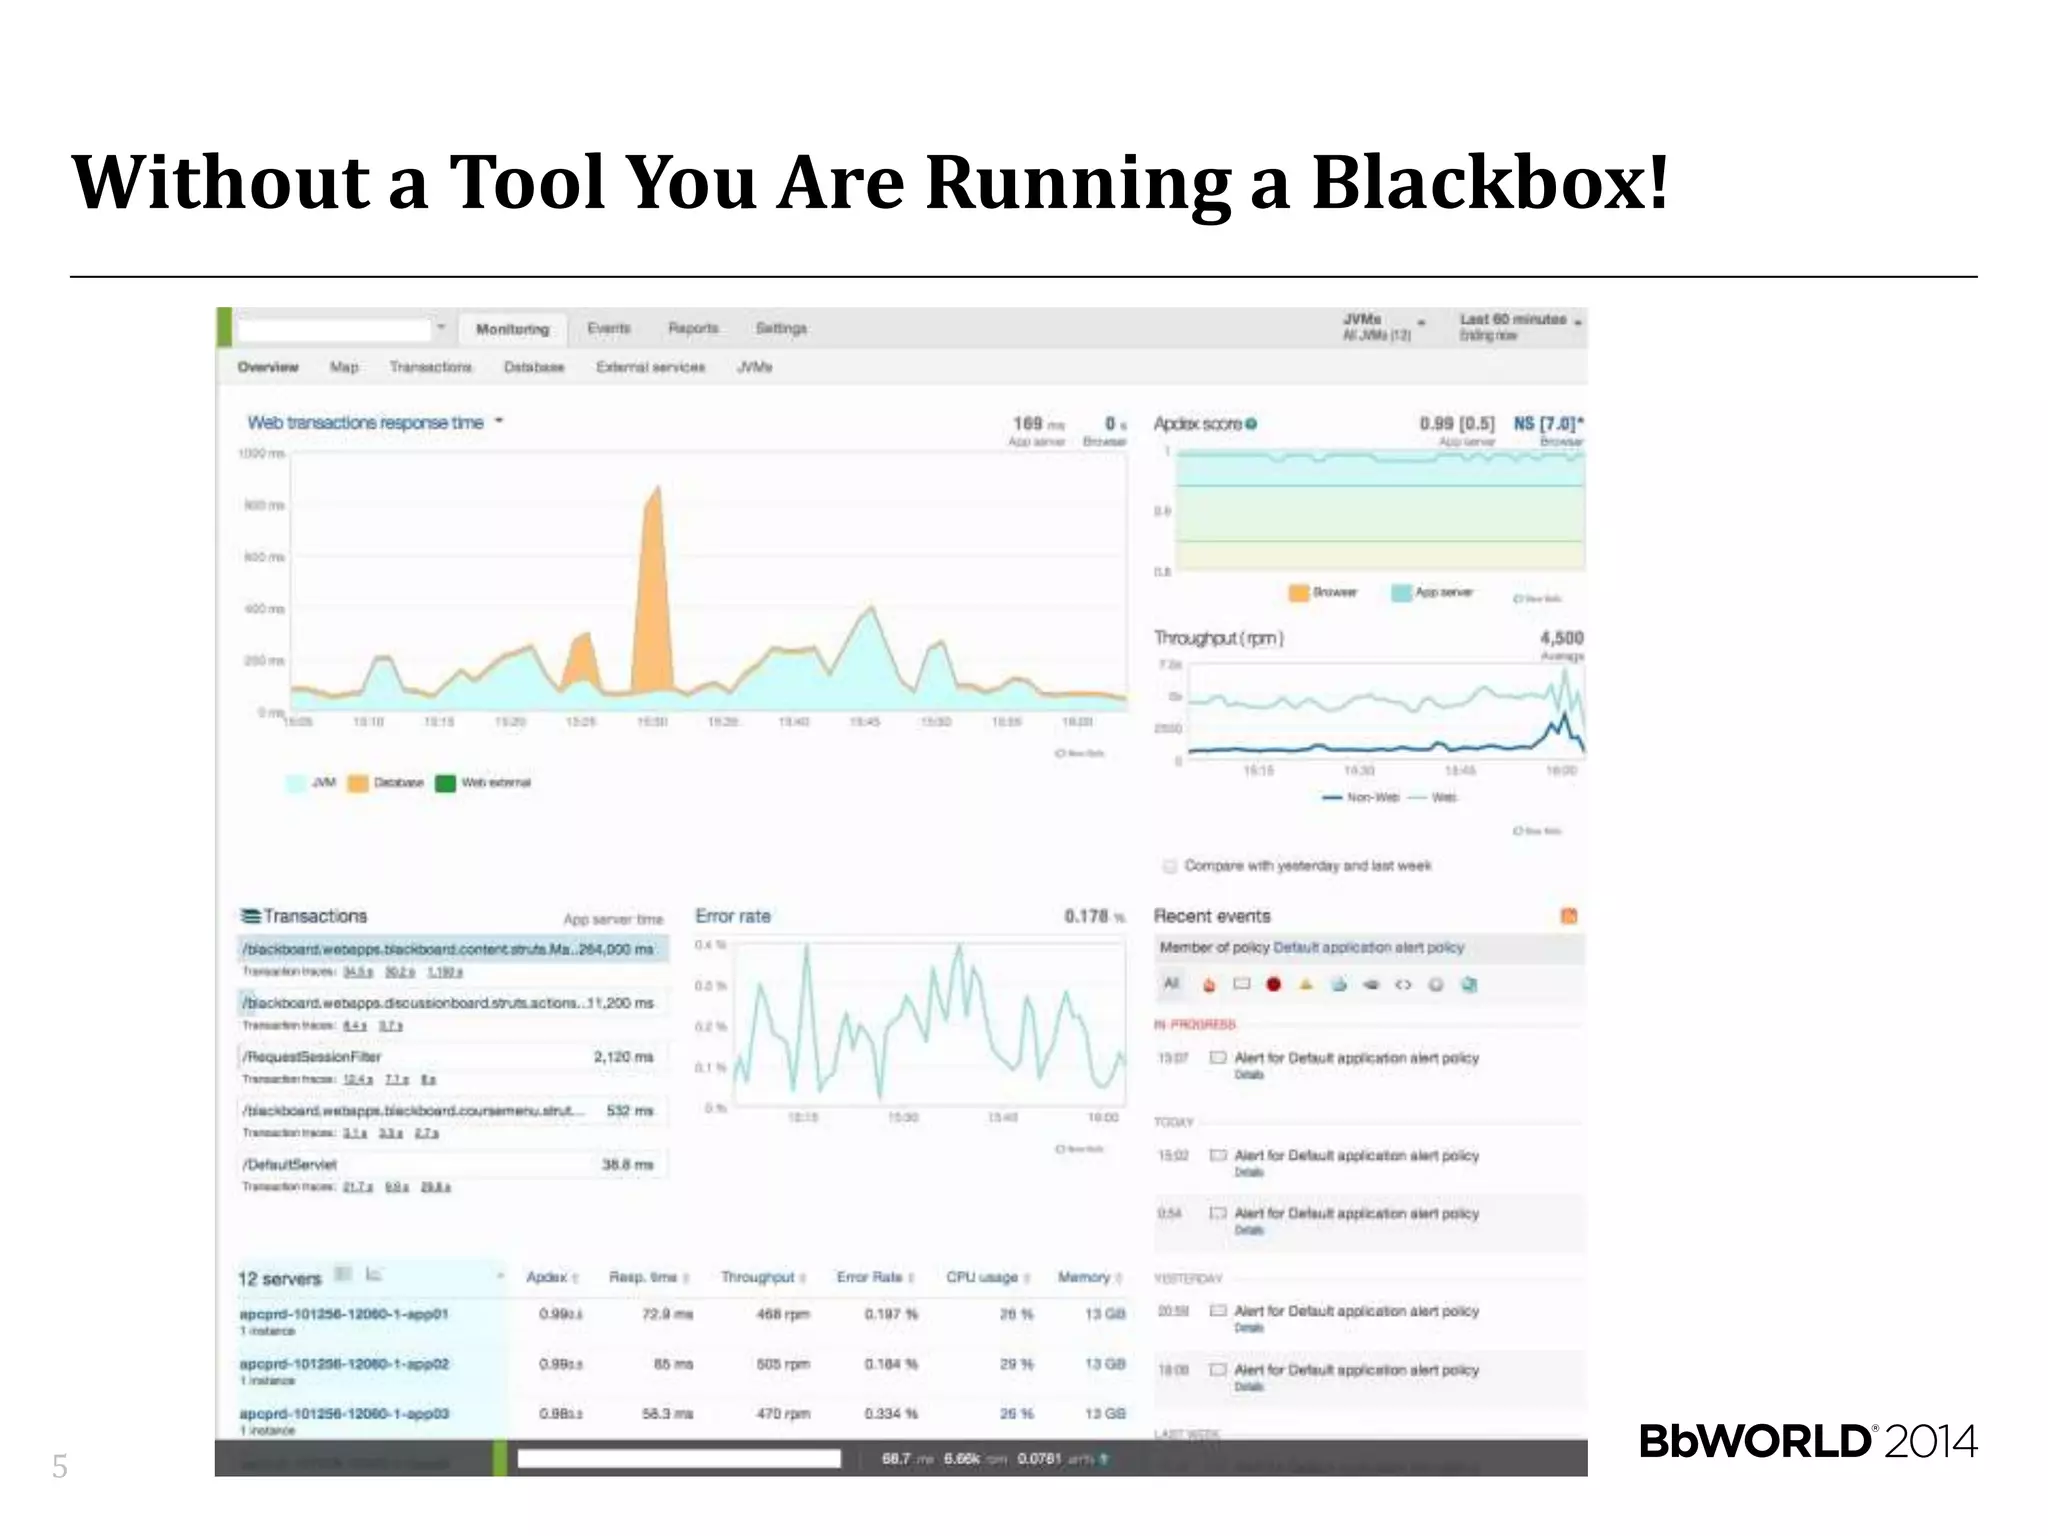
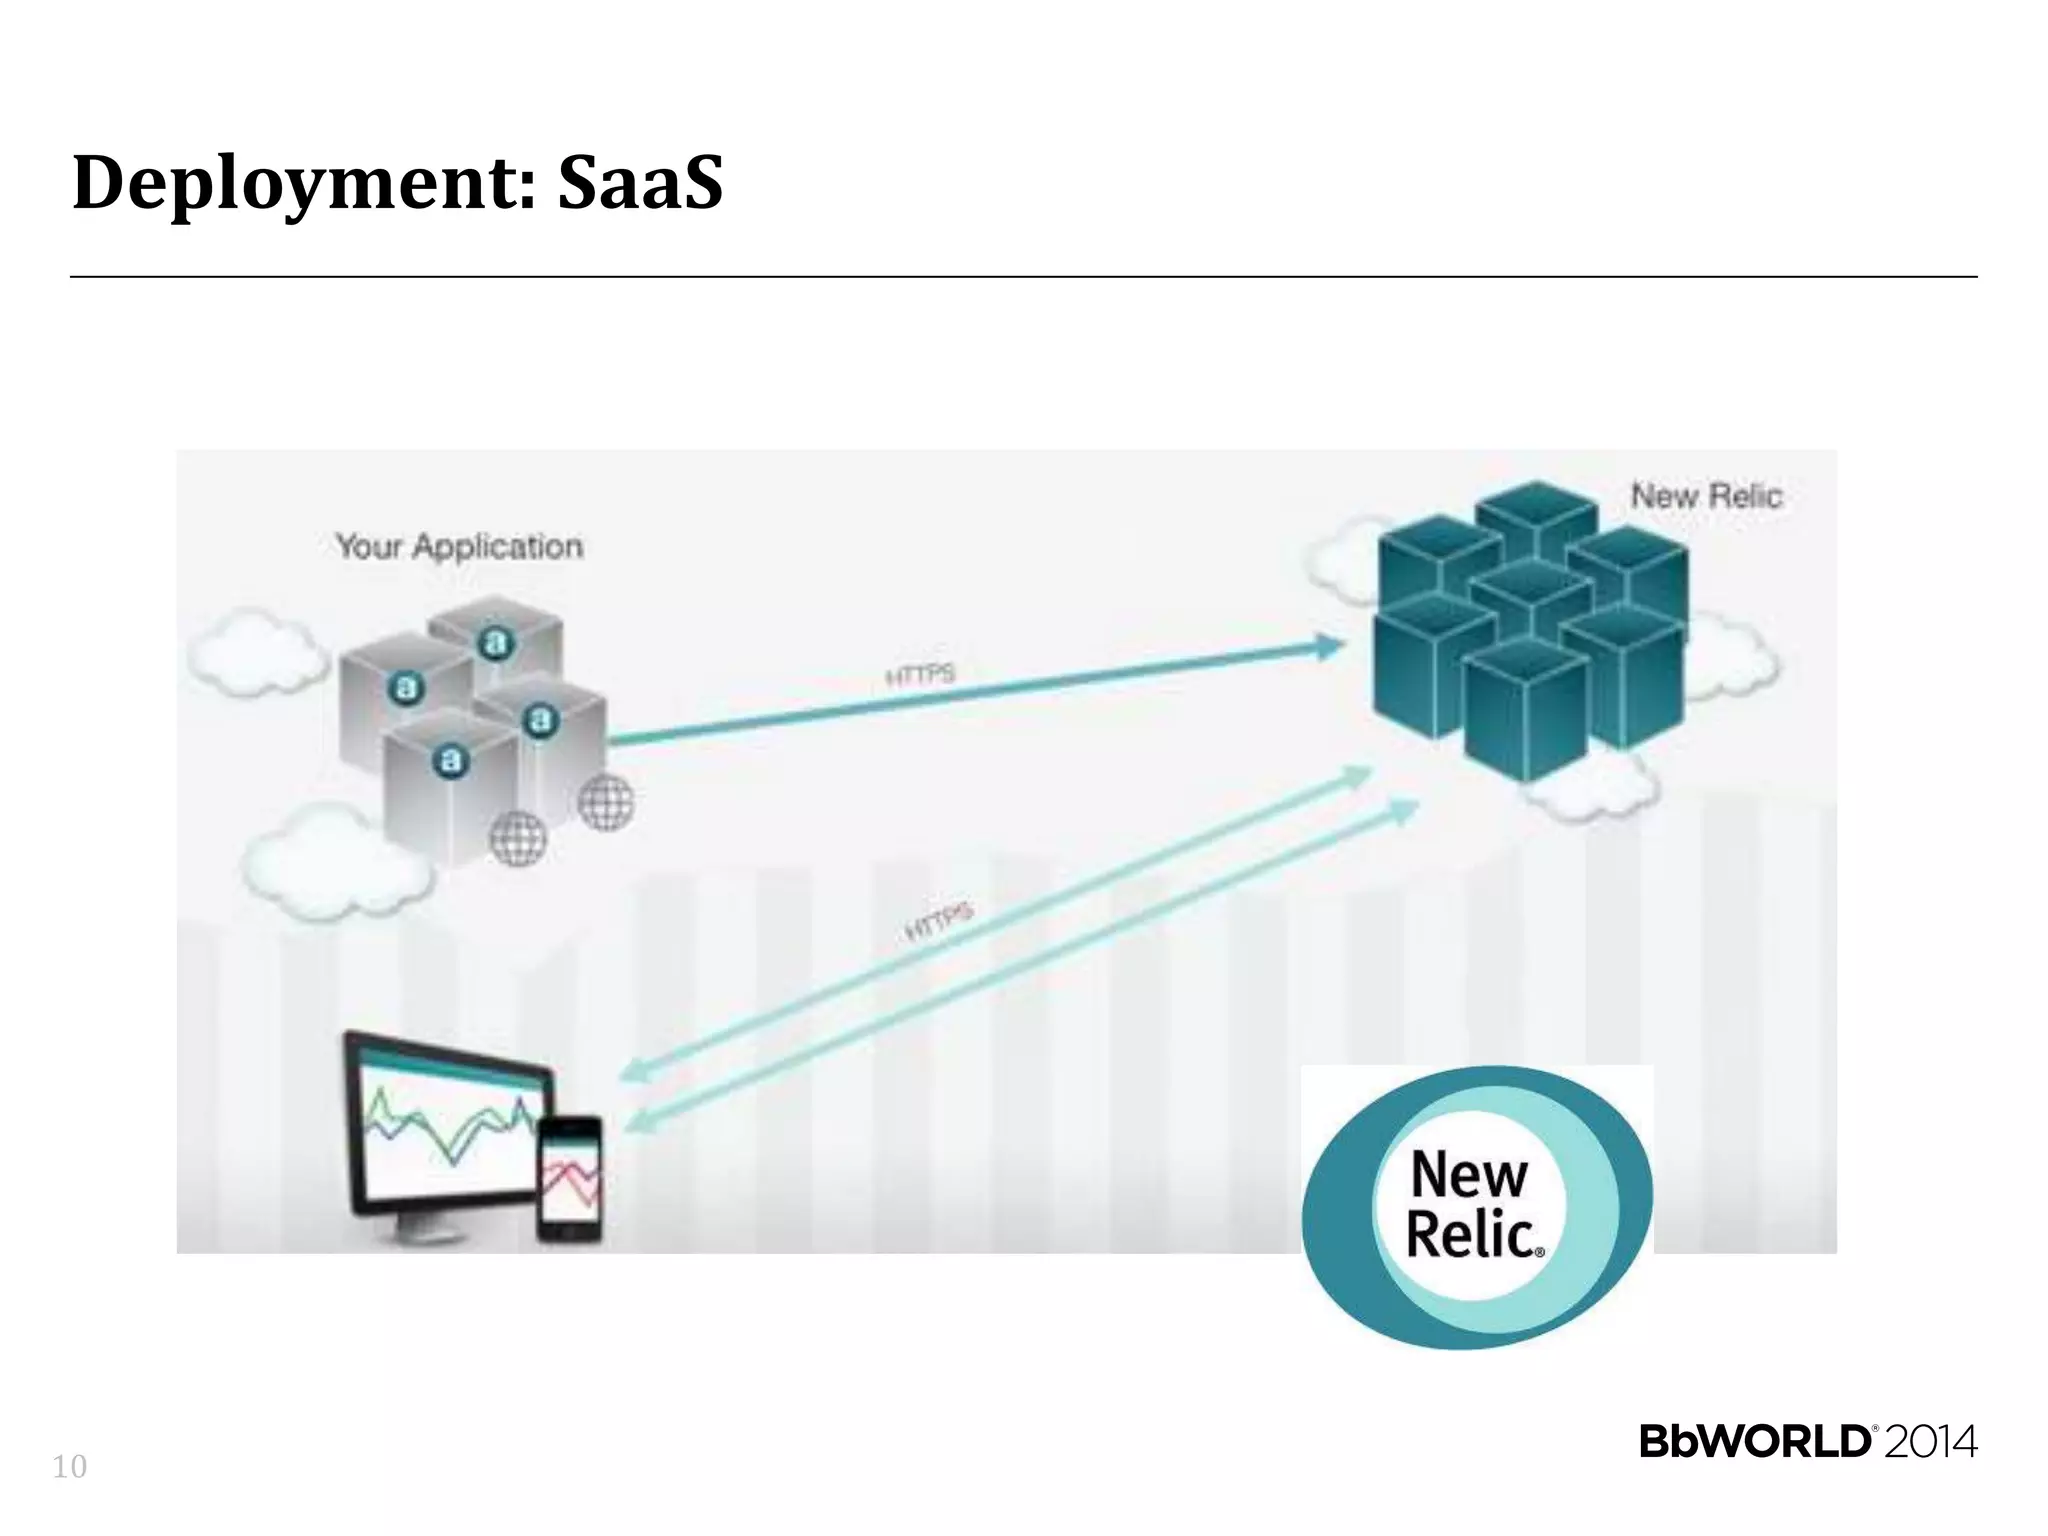
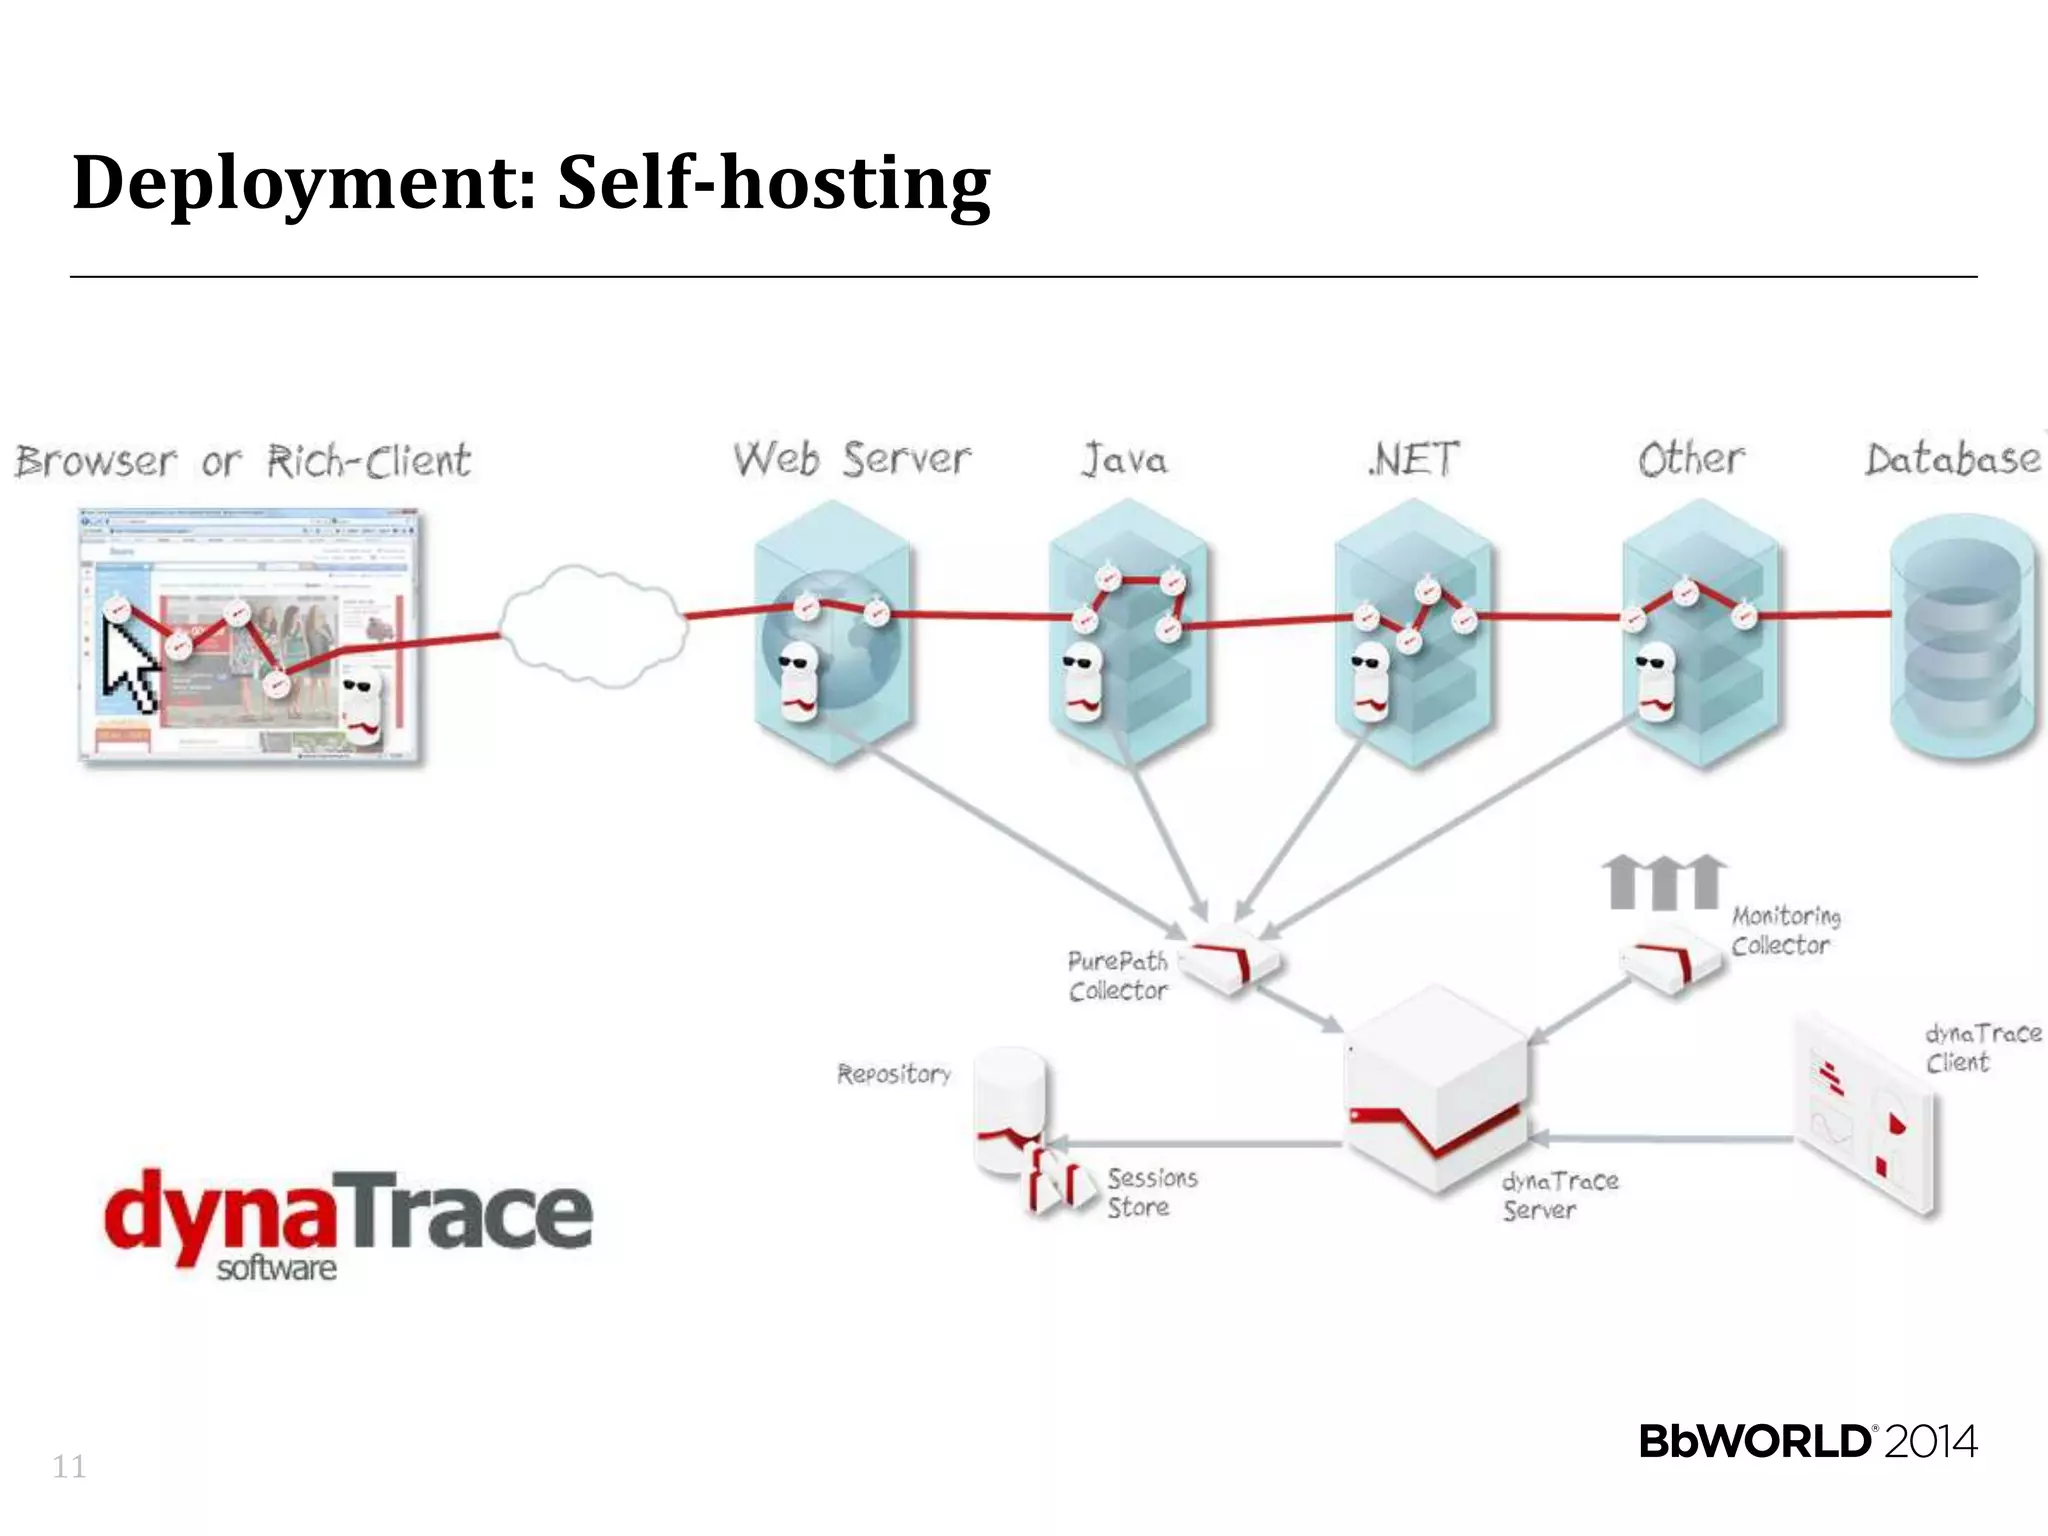
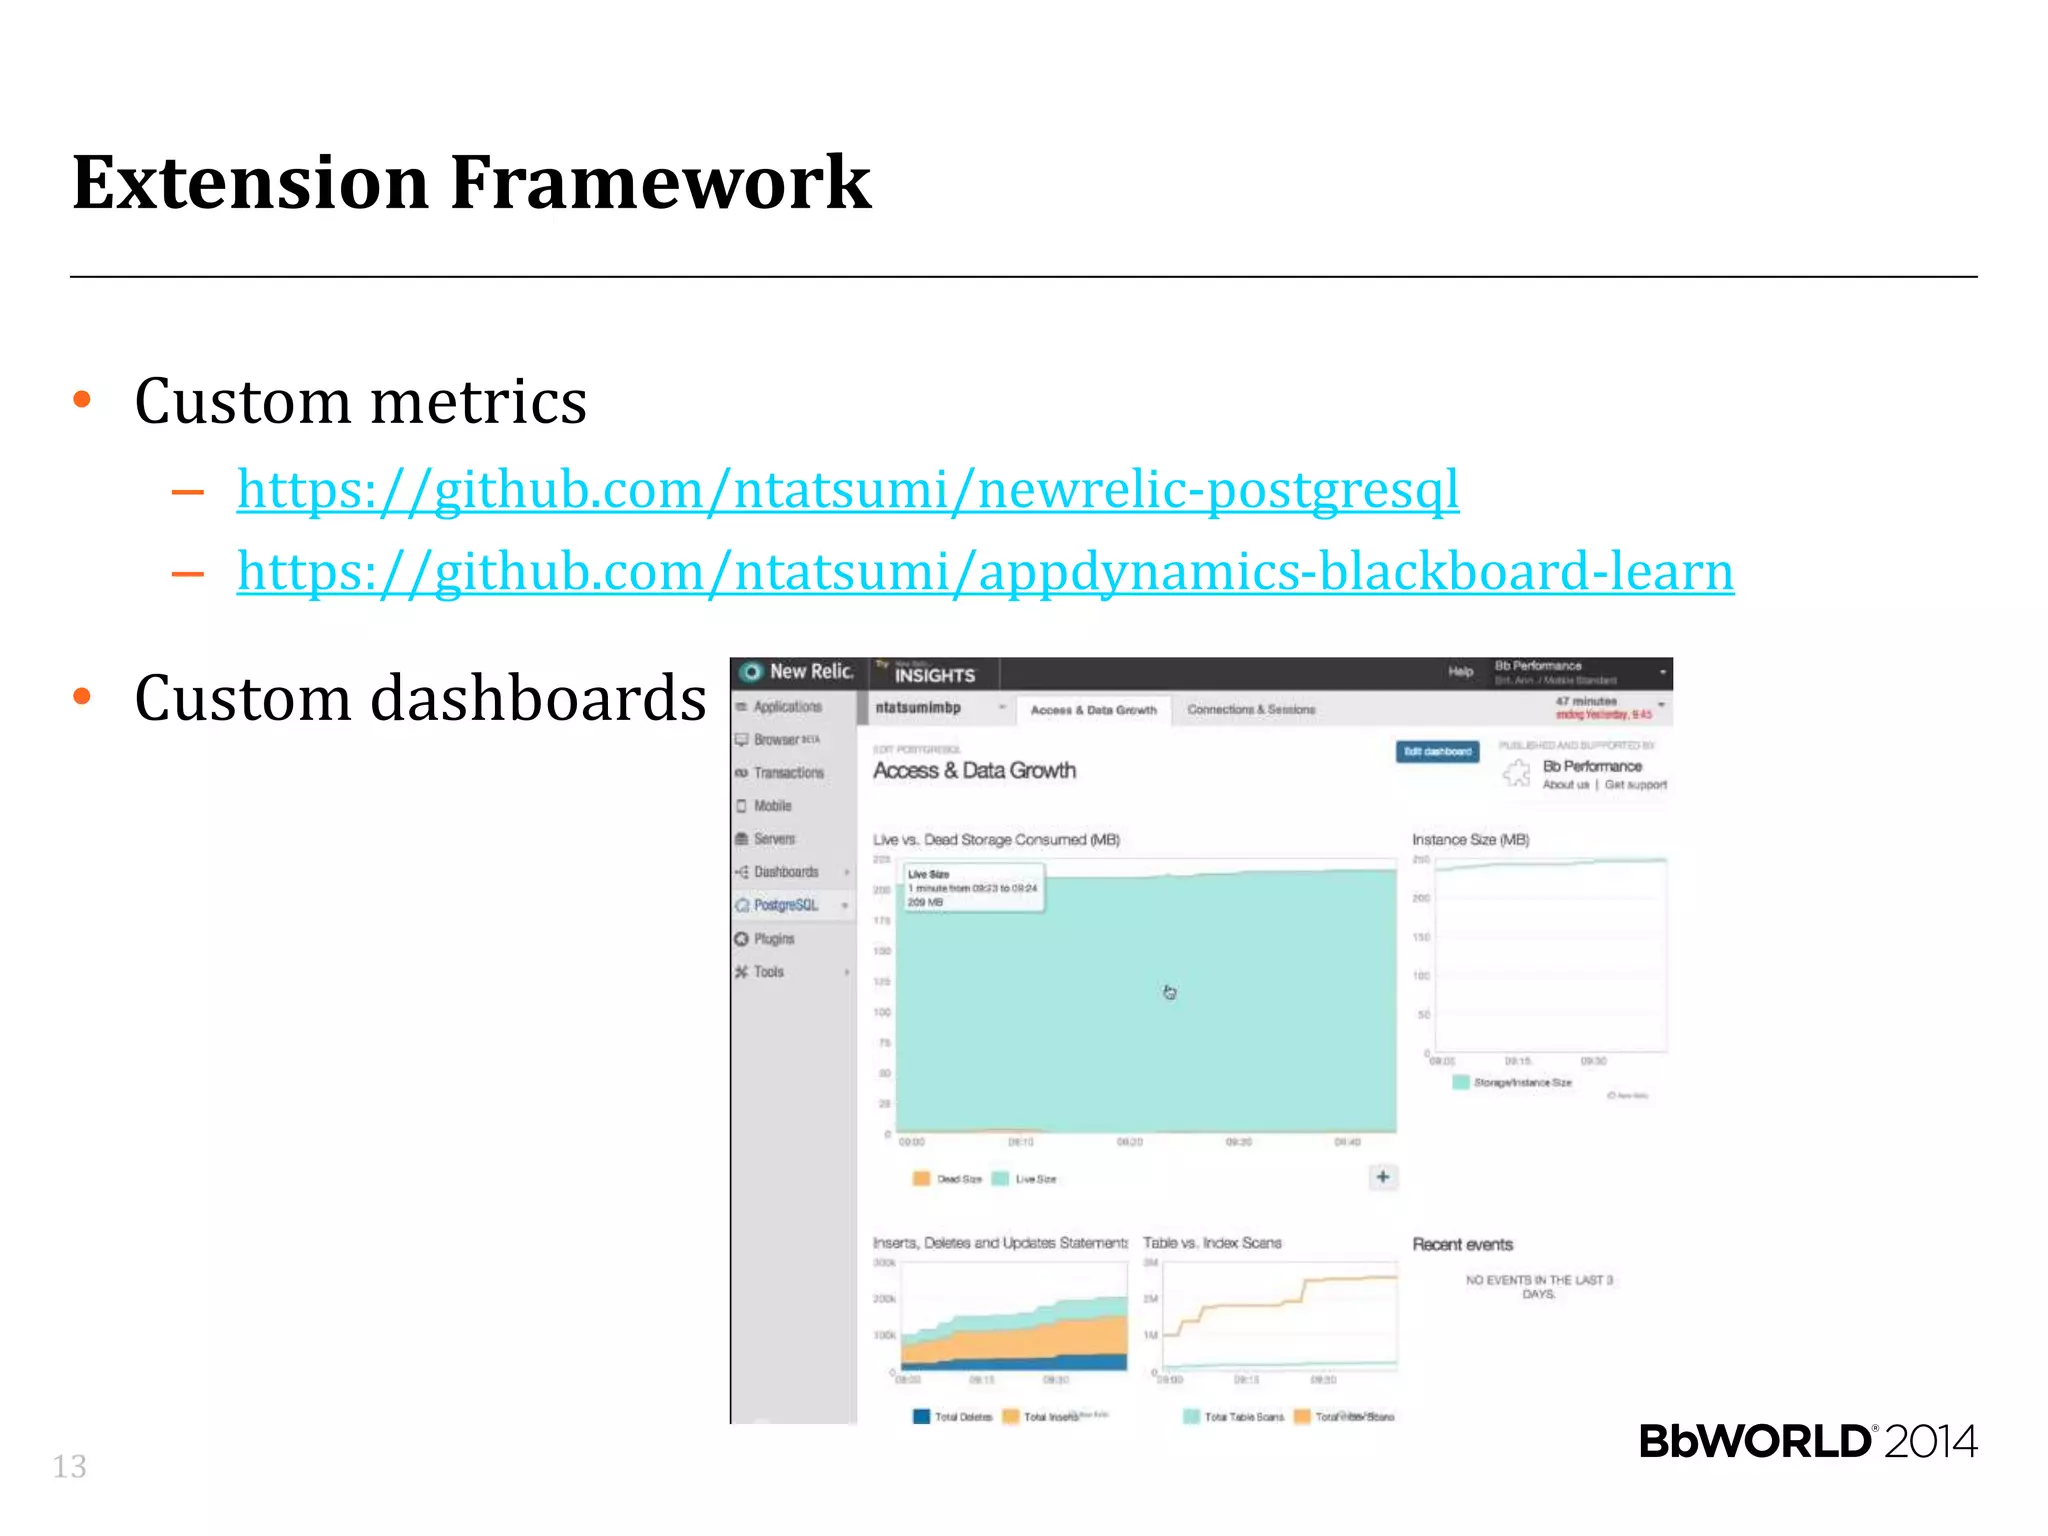
Application Performance
Management for Blackboard Learn
Danny Thomas
Noriaki Tatsumi
7/15/2014
Who We Are – Blackboard Performance Team
2
Who We Are – Blackboard Performance Team
Teams
• Program
• Server
• Database
• Frontend
Tools
• Monitoring
• APM
• Profiler
• HTTP load
generator
• HTTP replay
• Micro-benchmark
• Performance CI
Development
Recent highlights:
• B2 framework
stabilization
• Frames
elimination
• Server
concurrency
optimizations
• New Relic
instrumentation
3
APMs at Blackboard
Production Support Development
4
Without a Tool You Are Running a Blackbox!
5
APM Objectives
6
• Monitoring for visibility
– Centralize
– Improve Dev and Ops communication
• Identify what constitutes performance issues
– Abnormal behaviors
– Anti-patterns
• Detect and diagnose root cause quickly
• Translate into end user experience
Keys to Success
7
• Choosing the right tool
• Deployment automation
• Alert policies
• Instrumentation
Keys to Success:
Choosing the Right Tool
8
Features
9
• Real user monitoring (RUM)
• Application and database monitoring and profiling
• Servers, network, and filer monitoring
• Application runtime architecture discovery
• Transaction tracing
• Alert policies
• Reports - SLA, error tracking, custom
• Extension and customization framework
Deployment: SaaS
10
Deployment: Self-hosting
11
Data Retention
• Objectives
– Load/hardware forecast
– Business insights via data exploration
• Data types
– Time-series metric
– Transaction traces
– Slow SQL samples
– Errors
• Data format
– Raw/sampled data
– Aggregated data
• Flexibility: Self-hosted vs. SaaS
12
Extension Framework
• Custom metrics
– https://github.com/ntatsumi/newrelic-postgresql
– https://github.com/ntatsumi/appdynamics-blackboard-learn
• Custom dashboards
13
Keys to Success:
Deployment Automation
14
Deployment Automation
15
Keys to Success:
Constructing Alert Policies
16
Alert Policies – Design Considerations
• Minimize noise and false positives
• Use thresholds (e.g. >90% for 3 minutes)
• Use multiple data points (e.g. CPU + response times)
• Use event types based on severity (e.g. warning, critical)
• Send notifications that require action only
• Test your alerts and notifications
• Continuously tweak
17
Alert Policies - Rule Conditions
• Application: Downtime, errors, application resource metrics,
Apdex score
• Server: Downtime, CPU usage, disk space, disk IO, memory
usage
• Key transactions: Errors, Apdex score
18
Alert Policies - Apdex
• Industry standard way to measure users' perceptions of satisfactory
application responsiveness.
• Converts many measurements into one number on a uniform scale of
0-to-1 (0 = no users satisfied, 1 = all users satisfied)
• Apdex Score = (Satisfied Count + Tolerating Count / 2) / Total
Samples
• Example: 100 samples with a target time of 3 seconds, where 60 are
below 3 seconds, 30 are between 3 and 12 seconds, and the
remaining 10 are above 12 seconds
(60 + 30 / 2 )/ 100 = 0.75
http://en.wikipedia.org/wiki/Apdex
19
Keys to Success:
Instrumentation
20
Instrumentation Entry Points
Web
• HTTP requests
• Request URI,
parameters
Non-Web
• Scheduled tasks
• Background
threads
Event / Counter
• Message Queuing
• JMX
• Application
21
• APM tools generally require an entry point to treat other
activity as ‘interesting’:
Common Instrumentation
• Once an entry point is reached, default instrumentations
typically include:
– Servlets (Filters, Requests)
– Web frameworks (Spring, Struts, etc)
– Database calls (JDBC)
– Errors via logging frameworks and uncaught exceptions
– External HTTP services
22
Custom Instrumentation
• Depending on the APM, will vary from custom entry points, to a
more flexible, but complex sensor approach
• New Relic supports native API and XML based configurations
– The April release of Learn ships with New Relic capabilities
– Including instrumentation for:
• Errors
• Real-user monitoring
• Scheduled (bb-task) and queued tasks
• ‘Default’ servlet requests for static files
– Additional XML based configuration, for features such as message
queue handlers available from:
https://github.com/blackboard/newrelic-blackboard-learn
23
Real User Monitoring (RUM)
• Real-user monitoring inserts JavaScript snippets into pages
• Allows the APM tool to measure end to end:
– Web application contribution, as transactions are uniquely identified
– Network time
– DOM processing and page rendering time
– JavaScript Errors
– AJAX Requests
• By browser
• By location
24
System Monitoring
• Some tools may have no support for system level statistics, as
they’re application focused
• If not available, application contribution in term of CPU usage,
heap and native memory utilisation accounted for by JVM
statistics
• Provided by a separate daemon process
25
Demonstration – New Relic
26
Best Practices
27
Deployment
• Start slowly:
– APM can introduce performance side effects (typically ~5%, could be
much higher if misconfigured)
– Allow enough time to establish a baseline to compare changes against
• Deploy end-to-end, avoid the temptation to instrument only
some hosts
• Follow APM vendor best practices
28
Sizing/Scaling
• Oversizing application resources can be as harmful as
undersizing
• Most of interest
– Tomcat executor threads
– Connection pool sizing (available via JMX in April release, can be
implied from executor usage)
– Heap utilisation, Garbage Collection time
29
Troubleshooting Issues
• Compare with your baseline
• Trust the data
• Use APM as a starting point; dig deeper into suspected
components
• Provide as much data as possible when reporting an issue (e.g.
screenshots)
30
Q&A
31

Application Performance Management

  • 1.
    Application Performance Management forBlackboard Learn Danny Thomas Noriaki Tatsumi 7/15/2014
  • 2.
    Who We Are– Blackboard Performance Team 2
  • 3.
    Who We Are– Blackboard Performance Team Teams • Program • Server • Database • Frontend Tools • Monitoring • APM • Profiler • HTTP load generator • HTTP replay • Micro-benchmark • Performance CI Development Recent highlights: • B2 framework stabilization • Frames elimination • Server concurrency optimizations • New Relic instrumentation 3
  • 4.
    APMs at Blackboard ProductionSupport Development 4
  • 5.
    Without a ToolYou Are Running a Blackbox! 5
  • 6.
    APM Objectives 6 • Monitoringfor visibility – Centralize – Improve Dev and Ops communication • Identify what constitutes performance issues – Abnormal behaviors – Anti-patterns • Detect and diagnose root cause quickly • Translate into end user experience
  • 7.
    Keys to Success 7 •Choosing the right tool • Deployment automation • Alert policies • Instrumentation
  • 8.
    Keys to Success: Choosingthe Right Tool 8
  • 9.
    Features 9 • Real usermonitoring (RUM) • Application and database monitoring and profiling • Servers, network, and filer monitoring • Application runtime architecture discovery • Transaction tracing • Alert policies • Reports - SLA, error tracking, custom • Extension and customization framework
  • 10.
  • 11.
  • 12.
    Data Retention • Objectives –Load/hardware forecast – Business insights via data exploration • Data types – Time-series metric – Transaction traces – Slow SQL samples – Errors • Data format – Raw/sampled data – Aggregated data • Flexibility: Self-hosted vs. SaaS 12
  • 13.
    Extension Framework • Custommetrics – https://github.com/ntatsumi/newrelic-postgresql – https://github.com/ntatsumi/appdynamics-blackboard-learn • Custom dashboards 13
  • 14.
  • 15.
  • 16.
  • 17.
    Alert Policies –Design Considerations • Minimize noise and false positives • Use thresholds (e.g. >90% for 3 minutes) • Use multiple data points (e.g. CPU + response times) • Use event types based on severity (e.g. warning, critical) • Send notifications that require action only • Test your alerts and notifications • Continuously tweak 17
  • 18.
    Alert Policies -Rule Conditions • Application: Downtime, errors, application resource metrics, Apdex score • Server: Downtime, CPU usage, disk space, disk IO, memory usage • Key transactions: Errors, Apdex score 18
  • 19.
    Alert Policies -Apdex • Industry standard way to measure users' perceptions of satisfactory application responsiveness. • Converts many measurements into one number on a uniform scale of 0-to-1 (0 = no users satisfied, 1 = all users satisfied) • Apdex Score = (Satisfied Count + Tolerating Count / 2) / Total Samples • Example: 100 samples with a target time of 3 seconds, where 60 are below 3 seconds, 30 are between 3 and 12 seconds, and the remaining 10 are above 12 seconds (60 + 30 / 2 )/ 100 = 0.75 http://en.wikipedia.org/wiki/Apdex 19
  • 20.
  • 21.
    Instrumentation Entry Points Web •HTTP requests • Request URI, parameters Non-Web • Scheduled tasks • Background threads Event / Counter • Message Queuing • JMX • Application 21 • APM tools generally require an entry point to treat other activity as ‘interesting’:
  • 22.
    Common Instrumentation • Oncean entry point is reached, default instrumentations typically include: – Servlets (Filters, Requests) – Web frameworks (Spring, Struts, etc) – Database calls (JDBC) – Errors via logging frameworks and uncaught exceptions – External HTTP services 22
  • 23.
    Custom Instrumentation • Dependingon the APM, will vary from custom entry points, to a more flexible, but complex sensor approach • New Relic supports native API and XML based configurations – The April release of Learn ships with New Relic capabilities – Including instrumentation for: • Errors • Real-user monitoring • Scheduled (bb-task) and queued tasks • ‘Default’ servlet requests for static files – Additional XML based configuration, for features such as message queue handlers available from: https://github.com/blackboard/newrelic-blackboard-learn 23
  • 24.
    Real User Monitoring(RUM) • Real-user monitoring inserts JavaScript snippets into pages • Allows the APM tool to measure end to end: – Web application contribution, as transactions are uniquely identified – Network time – DOM processing and page rendering time – JavaScript Errors – AJAX Requests • By browser • By location 24
  • 25.
    System Monitoring • Sometools may have no support for system level statistics, as they’re application focused • If not available, application contribution in term of CPU usage, heap and native memory utilisation accounted for by JVM statistics • Provided by a separate daemon process 25
  • 26.
  • 27.
  • 28.
    Deployment • Start slowly: –APM can introduce performance side effects (typically ~5%, could be much higher if misconfigured) – Allow enough time to establish a baseline to compare changes against • Deploy end-to-end, avoid the temptation to instrument only some hosts • Follow APM vendor best practices 28
  • 29.
    Sizing/Scaling • Oversizing applicationresources can be as harmful as undersizing • Most of interest – Tomcat executor threads – Connection pool sizing (available via JMX in April release, can be implied from executor usage) – Heap utilisation, Garbage Collection time 29
  • 30.
    Troubleshooting Issues • Comparewith your baseline • Trust the data • Use APM as a starting point; dig deeper into suspected components • Provide as much data as possible when reporting an issue (e.g. screenshots) 30
  • 31.