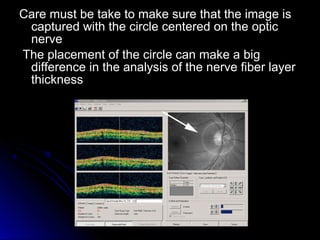
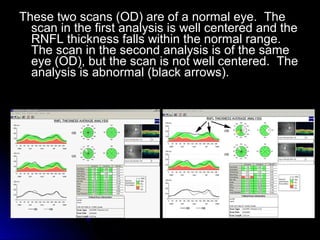
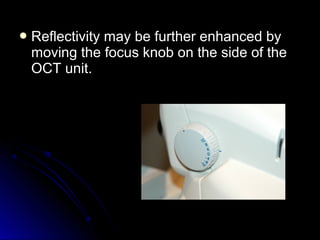
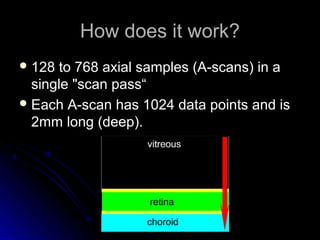
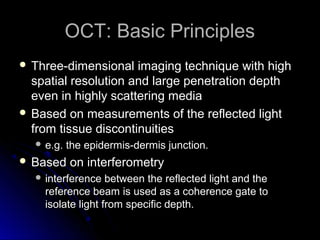
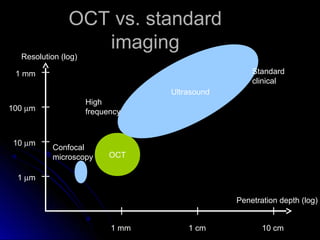
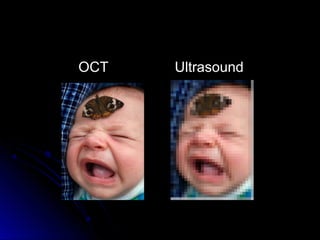
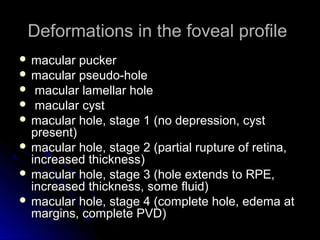
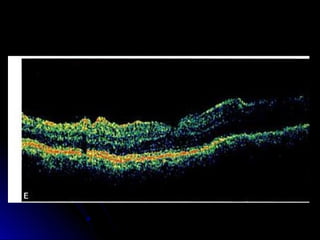
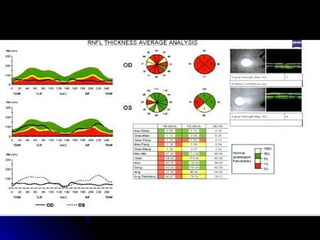
Optical Coherence
Tomography (OCT)


    By
    DIPAK KUMAR SAH.
    B.Optom 3rd year student.
    BPKLCOS,Maharajgunj Medical campus.
What is OCT?
Diagnostic imaging technique that examines
  living tissue non-invasively. It is based on
  a complex analysis of the reflection of low
  coherence radiation from the tissue under
  examination.
Real time cross sectional analysis
OCT allows both qualitative and quantitative
           analysis of the retina

Qualitative analysis includes description by
 location, a description of form and
 structure, identification of anomalous
 structures, and observation of the
 reflective qualities of the retina
Quantitative analysis involves
 measurements of the retina, specifically
 retinal thickness and volume, and nerve
 fiber layer thickness. This is possible
 because the OCT software is able to
 identify and "trace" two key layers of the
 retina, the NFL and RPE
How does it work?
 128  to 768 axial samples (A-scans) in a
  single "scan pass“
 Each A-scan has 1024 data points and is
  2mm long (deep).
OCT: Basic Principles
 Three-dimensional   imaging technique with high
  spatial resolution and large penetration depth
  even in highly scattering media
 Based on measurements of the reflected light
  from tissue discontinuities
   e.g.   the epidermis-dermis junction.
 Based    on interferometry
   interference   between the reflected light and the
    reference beam is used as a coherence gate to
    isolate light from specific depth.
OCT vs. standard
                  imaging
  Resolution (log)

 1 mm                                              Standard
                                                   clinical
                                  Ultrasound
                     High
100 µm               frequency


 10 µm
          Confocal
          microscopy       OCT

  1 µm

                                               Penetration depth (log)


                           1 mm       1 cm            10 cm
Resolution
 When  all of the A-scans are combined into
  one image, the image has a resolving
  power of about 10 microns vertically and
  20 microns horizontally
 Compare that to the resolution of a good
  ophthalmic ultrasound at 100 microns
OCT   Ultrasound
Scan Protocol Types


 Line
 Circle
 Radial   Lines
The "line" scan simply scans in a single,
 straight line. The length of the line can
 be changed as well as the scan angle.
The "circle" scans in a circle instead of a
 line.
The "radial lines" scans 6 consecutive line
 scans in a star pattern
The Cross Hair Scan
Cross Hair Scan performs a high resolution
 horizontal line scan and then automatically
 flips to a vertical line scan without having
 to exit the protocol
This is a common technique used in B-scan
 ultrasonography
Not All OCT Scans Are Created
             Equally
 The  "fast" scan protocols of the OCT 3 reduce
  the time needed for multiple scans
 The scan time reduction is intended to minimize
  the error created by patient movement
 Fast scans grab fewer A-scans in the 6 mm
  length of the scan. The normal 6 mm scan
  contains 512 A-scans, whereas the fast 6 mm
  scan contains only 128 A-scans, resulting in a
  lower resolution image
Fast OCT 3 scan


The same eye scanned with maximum resolution
Retinal Anatomy Compared to OCT
 The  vitreous is the black space on the top
  of the image
 We can identify the fovea by the normal
  depression
 The nerve fiber layer (NFL) and the retinal
  pigment epithelium (RPE) are easily
  identifiable layers as they are more highly
  reflective than the other layers of the
  retina
 This higher reflectivity is represented by
  the "hotter" colors (red, yellow, orange,
  white) in the false color representation of
  the OCT 3.
 The middle layers of the retina, between
  the NFL and RPE, are much less easily
  identifiable in the scan.
Optical Coherence Tomography


   This is what we wanted…
Optical Coherence Tomography


   …this is what we got…
internal limiting membrane


nerve fiber layer


ganglion cell layer


inner plexiform layer


inner nuclear layer


outer plexiform layer


outer nuclear layer

outer limiting membrane
photoreceptor inner segments
photoreceptor outer segments
retinal pigment epithelium
choriocapillaris
Interpretation of OCT images
Layers of the retina


                                                                                       Nerve
                                                                                       fiber
                                                                                       layer


                                                                                       Ganglion
                                                                                       cell layer


                                                                                       Inner
                                                                                       plexiform
                                                                                       layer

                                                                                       Inner
                                                                                       nuclear
                                                                                       layer

 RPE and choriocapillaris      Outer and inner External limiting Outer     Outer
                               photoreceptor   membrane          nuclear   plexiform
                               segments                          layer     layer
Interpretation of OCT images
     Layers of the retina
                                                              Nerve fiber layer

                                                              Ganglion cell layer

                                                              Inner plexiform layer

                                                              Inner Nuclear layer

                                                              Outer plexiform layer

                                                              Outer nuclear layer

                                                              External limiting membrane

                                                              Inner/outer segment junction

                                                              RPE

                                                              Larger choroidal vessels
300 !m____

High resolution spectral OCT
Image of good quality


Out of focus


Vignetted image


Fixation error
The pre-retinal profile
A  normal pre-retinal profile is black space
 Normal vitreous space is translucent
 The small, faint, bluish dots in the pre-
  retinal space is "noise"
 This is an electronic aberration created by
  increasing the sensitivity of the instrument
  to better visualize low reflective structures.
Anomalous structures
 pre-retinal membrane
 epi-retinal membrane
 vitreo-retinal strands
 vitreo-retinal traction
 pre-retinal neovascular membrane
 pre-papillary neovascular membrane
A pre-retinal membrane with traction on the fovea
a pigment epithelial detachment is causing the convexity
Aside from the retinal detachment,
 notice the underlying concave curvature of the retina,
suggesting the long eye of a significant myope
Deformations in the foveal profile
 macular  pucker
 macular pseudo-hole
 macular lamellar hole
 macular cyst
 macular hole, stage 1 (no depression, cyst
  present)
 macular hole, stage 2 (partial rupture of retina,
  increased thickness)
 macular hole, stage 3 (hole extends to RPE,
  increased thickness, some fluid)
 macular hole, stage 4 (complete hole, edema at
  margins, complete PVD)
Macular cyst
Macular hole, stage 2
Macular hole, stage 3
Macular hole, stage 4, operculum
suspended by the hyaloid membrane
The macular profile
The macular profile can, and often does,
 include the fovea as it's center
Deformations in the macular profile
 Serous retinal detachment (RD)
 Serous retinal pigment epithelial
  detachment (PED)
 Hemorrhagic pigment epithelial
  detachment
Serous retinal pigment epithelial
     detachment (PED)
Intra-retinal anomalies in the
           macular profile
 Choroidal  neovascular membrane
 Diffuse intra-retinal edema
 Cystoid macular edema
 Drusen
 Hard exudates
 Scar tissue
 Atrophic degeneration
 Sub-retinal fibrosis
 RPE tear
Choroidal neovascular membrane
Cystoid macular edema cause by
     diabetic maculopathy
Sub-retinal fibrosis
Diabetic Macular Edema
 Sponse  like retinal thickening.
 Cystoid macular edema.
 Serous retinal detachment.
 Foveal tractional retinal detachment.
 Taut posterior hyaloid membrane.
Retinal Trauma
Retinal Detachment
Followed by scleral buckling
            and PPV
 Retinal pigment epithelium irregularities.
 Neurosensory atrophy.
 CME
 Retinal pigment epithelium hyperplasia.
Intraocular Tumor
           Retinal   leukemic
            infiltrate.
Degenerative Myopia
Postoperative Endophthalmitis
Glaucoma
 Structural   Damage precedes Functional
  loss.
 Pre-perimetric Glaucoma.
 RNFL measurement.
 Macular Thickness.
 ONH Analysis.
Normal Vs Glaucomatous optic
            cup.
OCT and Fluorescein
Angiography in retinal diagnosis
FAs provide excellent characterization of
 retinal blood flow over time, as well as size
 and extent information on the x and y axis
 (north-south, east-west)
The OCT gives us information in the z
 (depth) axis, telling us what layers of the
 retina are affected
Scan analysis protocols for
       qualitative analysis

Line scans can be viewed with a variety of
  analysis tools (see the OCT manual). I
  have found the "Align process" to be the
  most useful, with the "Proportional"
  analysis a good choice if the align process
  is not needed
The Align Process
This tool "straightens" motions artifacts
Proportional analysis
Proportional analysis produces an image
  with its true horizontal and vertical
  proportions
Retinal Thickness Analysis
Using the retinal thickness analysis tool, the
 software then traces a line along the NFL
 layer and a line along the RPE layer.
The software then measures the distance
 between the two lines and a graph is
 produced which compares the measured
 thickness to the thickness of a normal
 retina
Each of the six scans can be reviewed by
clicking on the slider bar to the left, and any
   or all of them can be printed out for the
                patient's record
Retinal thickness analysis does not measure
  retinal elevation
for example this eye with a pigment epithelial
  detachment (PED) pictured below. The arrow
  on the left would represent retinal elevation,
  from the choroid, through the fluid space of the
  PED, to the nerve fiber level. The arrow on the
  right shows what the analysis measures, defined
  by the distance from the RPE (which is
  detached) to the NFL
Retinal Thickness/Volume
         Change Analysis
Two FMT scans on the same eye, but taken on
 different dates, can be selected at the same time
 while holding down the "ctrl" key. "Retinal
 Thickness/Vol Change is chosen from the
 analysis tab.
The analysis will give you a "change map",
 showing the difference between the two
 scans
Glaucoma Scans
When evaluating the glaucoma suspect
 or the glaucoma patient, two
 parameters that the ophthalmologist is
 interested in are the characteristics of
 the optic nerve cup and the thickness
 of the nerve fiber layer surrounding the
 optic nerve head

 The Fast Optic Disc scan
 The Fast RNFL Thickness scan
The Fast Optic Disc scan
The optic cup profile can be evaluated by
  capturing a "Fast Optic Disc" scan
The patient fixes on the target, which is
  automatically placed at the edge of the scan
  window so that the optic nerve is viewed toward
  the center of the video window. The operator
  then moves the scan so that the star pattern is
  centered on the optic nerve head. Centering
  can be aided by clicking on the scan window to
  view the white centering lines.
The optic nerve scan can be analyzed with
 the "optic nerve head analysis" protocol
The Fast RNFL Thickness scan
Nerve fiber layer thickness can be evaluated with
 the "Fast RNFL Thickness" scan. This is a
 circular scan that requires the operator to place
 the circle so that the center of the circle is
 centered on the optic nerve head.
The analysis software places lines on the top and
  bottom of the nerve fiber layer and the distance
  between the two lines is interpreted to be the
  thickness of the nerve fiber layer
Care must be take to make sure that the image is
 captured with the circle centered on the optic
 nerve
The placement of the circle can make a big
 difference in the analysis of the nerve fiber layer
 thickness
These two scans (OD) are of a normal eye. The
  scan in the first analysis is well centered and the
  RNFL thickness falls within the normal range.
  The scan in the second analysis is of the same
  eye (OD), but the scan is not well centered. The
  analysis is abnormal (black arrows).
 Reflectivity
             may be further enhanced by
  moving the focus knob on the side of the
  OCT unit.
Is it Perfect?
Scanning with the OCT suffers from a lack
 of registration and questionable
 repeatability. Until improvements in the
 hardware and software improve or
 eliminate these problems, operator skill
 will play a major roll in the quality of OCT
 scanning.
What makes a good OCT scan?
A  good quality OCT scan has good
  reflectivity from edge to edge.
 The "hotter" colors (orange, red, white,
  yellow) are maximized
 Generally, the retina should be in the
  lower portion of the scan window so that
  the vitreous can be images as well.
Scanning Tips
 Communicate    with the doctor regarding the size
  and location of the pathology of interest.
 Refer to other images of the pathology, e.g.
  color photos and FA.
 Review past OCT exams and repeat scan types
  used before.
 Dilate the eye well??????
 The patient must keep the forehead against the
  bar and the chin in the chinrest, with teeth
  together. Use the marker on the headrest to
  align the patient vertically. The outer canthus
  should be even with the line
Scanning Tips
   Use the two buttons near the joystick for
    freezing and saving scans. This saves you
    from having to juggle the joystick and the
    mouse.
   Minimize patient fatigue by keeping scan time
    to a minimum. Never scan an eye for more
    than 10 minutes (FDA regulation).
   Keep the cornea lubricated. Use artificial tears
    and have the patient blink when you are not
    saving a scan pass.
   Move the instrument on the x and y axis (using
    the joystick) to work around opacities
What’s New

 OCT   better understanding (FA and ICG)
 Increase in resolution to 5 microns
 Overlays, 3D imaging
Questions?

              References:

 Brancato R. and Lumbroso B. Guide to
     Optical Coherence Tomography
 Interpretation. Rome: Innovation-News-
          Communication, 2004.

Schuman J., Puliafito C., and Fujimoto J.
Ocular Coherence Tomography of Ocular
Diseases. Thorofare NJ: Slack Inc., 2004.

Dipakoct

  • 1.
    Optical Coherence Tomography (OCT) By DIPAK KUMAR SAH. B.Optom 3rd year student. BPKLCOS,Maharajgunj Medical campus.
  • 2.
    What is OCT? Diagnosticimaging technique that examines living tissue non-invasively. It is based on a complex analysis of the reflection of low coherence radiation from the tissue under examination. Real time cross sectional analysis
  • 3.
    OCT allows bothqualitative and quantitative analysis of the retina Qualitative analysis includes description by location, a description of form and structure, identification of anomalous structures, and observation of the reflective qualities of the retina
  • 4.
    Quantitative analysis involves measurements of the retina, specifically retinal thickness and volume, and nerve fiber layer thickness. This is possible because the OCT software is able to identify and "trace" two key layers of the retina, the NFL and RPE
  • 5.
    How does itwork?  128 to 768 axial samples (A-scans) in a single "scan pass“  Each A-scan has 1024 data points and is 2mm long (deep).
  • 6.
    OCT: Basic Principles Three-dimensional imaging technique with high spatial resolution and large penetration depth even in highly scattering media  Based on measurements of the reflected light from tissue discontinuities  e.g. the epidermis-dermis junction.  Based on interferometry  interference between the reflected light and the reference beam is used as a coherence gate to isolate light from specific depth.
  • 7.
    OCT vs. standard imaging Resolution (log) 1 mm Standard clinical Ultrasound High 100 µm frequency 10 µm Confocal microscopy OCT 1 µm Penetration depth (log) 1 mm 1 cm 10 cm
  • 8.
    Resolution  When all of the A-scans are combined into one image, the image has a resolving power of about 10 microns vertically and 20 microns horizontally  Compare that to the resolution of a good ophthalmic ultrasound at 100 microns
  • 9.
    OCT Ultrasound
  • 11.
    Scan Protocol Types Line  Circle  Radial Lines
  • 12.
    The "line" scansimply scans in a single, straight line. The length of the line can be changed as well as the scan angle.
  • 13.
    The "circle" scansin a circle instead of a line.
  • 14.
    The "radial lines"scans 6 consecutive line scans in a star pattern
  • 15.
    The Cross HairScan Cross Hair Scan performs a high resolution horizontal line scan and then automatically flips to a vertical line scan without having to exit the protocol This is a common technique used in B-scan ultrasonography
  • 16.
    Not All OCTScans Are Created Equally  The "fast" scan protocols of the OCT 3 reduce the time needed for multiple scans  The scan time reduction is intended to minimize the error created by patient movement  Fast scans grab fewer A-scans in the 6 mm length of the scan. The normal 6 mm scan contains 512 A-scans, whereas the fast 6 mm scan contains only 128 A-scans, resulting in a lower resolution image
  • 17.
    Fast OCT 3scan The same eye scanned with maximum resolution
  • 18.
    Retinal Anatomy Comparedto OCT  The vitreous is the black space on the top of the image  We can identify the fovea by the normal depression  The nerve fiber layer (NFL) and the retinal pigment epithelium (RPE) are easily identifiable layers as they are more highly reflective than the other layers of the retina
  • 19.
     This higherreflectivity is represented by the "hotter" colors (red, yellow, orange, white) in the false color representation of the OCT 3.  The middle layers of the retina, between the NFL and RPE, are much less easily identifiable in the scan.
  • 20.
    Optical Coherence Tomography This is what we wanted…
  • 21.
    Optical Coherence Tomography …this is what we got…
  • 22.
    internal limiting membrane nervefiber layer ganglion cell layer inner plexiform layer inner nuclear layer outer plexiform layer outer nuclear layer outer limiting membrane photoreceptor inner segments photoreceptor outer segments retinal pigment epithelium choriocapillaris
  • 23.
    Interpretation of OCTimages Layers of the retina Nerve fiber layer Ganglion cell layer Inner plexiform layer Inner nuclear layer RPE and choriocapillaris Outer and inner External limiting Outer Outer photoreceptor membrane nuclear plexiform segments layer layer
  • 24.
    Interpretation of OCTimages Layers of the retina Nerve fiber layer Ganglion cell layer Inner plexiform layer Inner Nuclear layer Outer plexiform layer Outer nuclear layer External limiting membrane Inner/outer segment junction RPE Larger choroidal vessels 300 !m____ High resolution spectral OCT
  • 25.
    Image of goodquality Out of focus Vignetted image Fixation error
  • 26.
    The pre-retinal profile A normal pre-retinal profile is black space  Normal vitreous space is translucent  The small, faint, bluish dots in the pre- retinal space is "noise"  This is an electronic aberration created by increasing the sensitivity of the instrument to better visualize low reflective structures.
  • 27.
    Anomalous structures  pre-retinalmembrane  epi-retinal membrane  vitreo-retinal strands  vitreo-retinal traction  pre-retinal neovascular membrane  pre-papillary neovascular membrane
  • 28.
    A pre-retinal membranewith traction on the fovea
  • 29.
    a pigment epithelialdetachment is causing the convexity
  • 30.
    Aside from theretinal detachment, notice the underlying concave curvature of the retina, suggesting the long eye of a significant myope
  • 31.
    Deformations in thefoveal profile  macular pucker  macular pseudo-hole  macular lamellar hole  macular cyst  macular hole, stage 1 (no depression, cyst present)  macular hole, stage 2 (partial rupture of retina, increased thickness)  macular hole, stage 3 (hole extends to RPE, increased thickness, some fluid)  macular hole, stage 4 (complete hole, edema at margins, complete PVD)
  • 32.
  • 33.
  • 34.
  • 35.
    Macular hole, stage4, operculum suspended by the hyaloid membrane
  • 36.
    The macular profile Themacular profile can, and often does, include the fovea as it's center
  • 37.
    Deformations in themacular profile  Serous retinal detachment (RD)  Serous retinal pigment epithelial detachment (PED)  Hemorrhagic pigment epithelial detachment
  • 38.
    Serous retinal pigmentepithelial detachment (PED)
  • 39.
    Intra-retinal anomalies inthe macular profile  Choroidal neovascular membrane  Diffuse intra-retinal edema  Cystoid macular edema  Drusen  Hard exudates  Scar tissue  Atrophic degeneration  Sub-retinal fibrosis  RPE tear
  • 40.
  • 41.
    Cystoid macular edemacause by diabetic maculopathy
  • 42.
  • 43.
    Diabetic Macular Edema Sponse like retinal thickening.  Cystoid macular edema.  Serous retinal detachment.  Foveal tractional retinal detachment.  Taut posterior hyaloid membrane.
  • 46.
  • 48.
  • 50.
    Followed by scleralbuckling and PPV  Retinal pigment epithelium irregularities.  Neurosensory atrophy.  CME  Retinal pigment epithelium hyperplasia.
  • 51.
    Intraocular Tumor  Retinal leukemic infiltrate.
  • 52.
  • 53.
  • 54.
    Glaucoma  Structural Damage precedes Functional loss.  Pre-perimetric Glaucoma.  RNFL measurement.  Macular Thickness.  ONH Analysis.
  • 55.
  • 57.
    OCT and Fluorescein Angiographyin retinal diagnosis FAs provide excellent characterization of retinal blood flow over time, as well as size and extent information on the x and y axis (north-south, east-west) The OCT gives us information in the z (depth) axis, telling us what layers of the retina are affected
  • 60.
    Scan analysis protocolsfor qualitative analysis Line scans can be viewed with a variety of analysis tools (see the OCT manual). I have found the "Align process" to be the most useful, with the "Proportional" analysis a good choice if the align process is not needed
  • 61.
    The Align Process Thistool "straightens" motions artifacts
  • 62.
    Proportional analysis Proportional analysisproduces an image with its true horizontal and vertical proportions
  • 63.
    Retinal Thickness Analysis Usingthe retinal thickness analysis tool, the software then traces a line along the NFL layer and a line along the RPE layer. The software then measures the distance between the two lines and a graph is produced which compares the measured thickness to the thickness of a normal retina
  • 64.
    Each of thesix scans can be reviewed by clicking on the slider bar to the left, and any or all of them can be printed out for the patient's record
  • 65.
    Retinal thickness analysisdoes not measure retinal elevation for example this eye with a pigment epithelial detachment (PED) pictured below. The arrow on the left would represent retinal elevation, from the choroid, through the fluid space of the PED, to the nerve fiber level. The arrow on the right shows what the analysis measures, defined by the distance from the RPE (which is detached) to the NFL
  • 67.
    Retinal Thickness/Volume Change Analysis Two FMT scans on the same eye, but taken on different dates, can be selected at the same time while holding down the "ctrl" key. "Retinal Thickness/Vol Change is chosen from the analysis tab.
  • 68.
    The analysis willgive you a "change map", showing the difference between the two scans
  • 69.
    Glaucoma Scans When evaluatingthe glaucoma suspect or the glaucoma patient, two parameters that the ophthalmologist is interested in are the characteristics of the optic nerve cup and the thickness of the nerve fiber layer surrounding the optic nerve head  The Fast Optic Disc scan  The Fast RNFL Thickness scan
  • 70.
    The Fast OpticDisc scan The optic cup profile can be evaluated by capturing a "Fast Optic Disc" scan The patient fixes on the target, which is automatically placed at the edge of the scan window so that the optic nerve is viewed toward the center of the video window. The operator then moves the scan so that the star pattern is centered on the optic nerve head. Centering can be aided by clicking on the scan window to view the white centering lines.
  • 72.
    The optic nervescan can be analyzed with the "optic nerve head analysis" protocol
  • 73.
    The Fast RNFLThickness scan Nerve fiber layer thickness can be evaluated with the "Fast RNFL Thickness" scan. This is a circular scan that requires the operator to place the circle so that the center of the circle is centered on the optic nerve head.
  • 74.
    The analysis softwareplaces lines on the top and bottom of the nerve fiber layer and the distance between the two lines is interpreted to be the thickness of the nerve fiber layer
  • 75.
    Care must betake to make sure that the image is captured with the circle centered on the optic nerve The placement of the circle can make a big difference in the analysis of the nerve fiber layer thickness
  • 76.
    These two scans(OD) are of a normal eye. The scan in the first analysis is well centered and the RNFL thickness falls within the normal range. The scan in the second analysis is of the same eye (OD), but the scan is not well centered. The analysis is abnormal (black arrows).
  • 77.
     Reflectivity may be further enhanced by moving the focus knob on the side of the OCT unit.
  • 78.
    Is it Perfect? Scanningwith the OCT suffers from a lack of registration and questionable repeatability. Until improvements in the hardware and software improve or eliminate these problems, operator skill will play a major roll in the quality of OCT scanning.
  • 79.
    What makes agood OCT scan? A good quality OCT scan has good reflectivity from edge to edge.  The "hotter" colors (orange, red, white, yellow) are maximized  Generally, the retina should be in the lower portion of the scan window so that the vitreous can be images as well.
  • 80.
    Scanning Tips  Communicate with the doctor regarding the size and location of the pathology of interest.  Refer to other images of the pathology, e.g. color photos and FA.  Review past OCT exams and repeat scan types used before.  Dilate the eye well??????  The patient must keep the forehead against the bar and the chin in the chinrest, with teeth together. Use the marker on the headrest to align the patient vertically. The outer canthus should be even with the line
  • 82.
    Scanning Tips  Use the two buttons near the joystick for freezing and saving scans. This saves you from having to juggle the joystick and the mouse.  Minimize patient fatigue by keeping scan time to a minimum. Never scan an eye for more than 10 minutes (FDA regulation).  Keep the cornea lubricated. Use artificial tears and have the patient blink when you are not saving a scan pass.  Move the instrument on the x and y axis (using the joystick) to work around opacities
  • 83.
    What’s New  OCT better understanding (FA and ICG)  Increase in resolution to 5 microns  Overlays, 3D imaging
  • 84.
    Questions? References: Brancato R. and Lumbroso B. Guide to Optical Coherence Tomography Interpretation. Rome: Innovation-News- Communication, 2004. Schuman J., Puliafito C., and Fujimoto J. Ocular Coherence Tomography of Ocular Diseases. Thorofare NJ: Slack Inc., 2004.