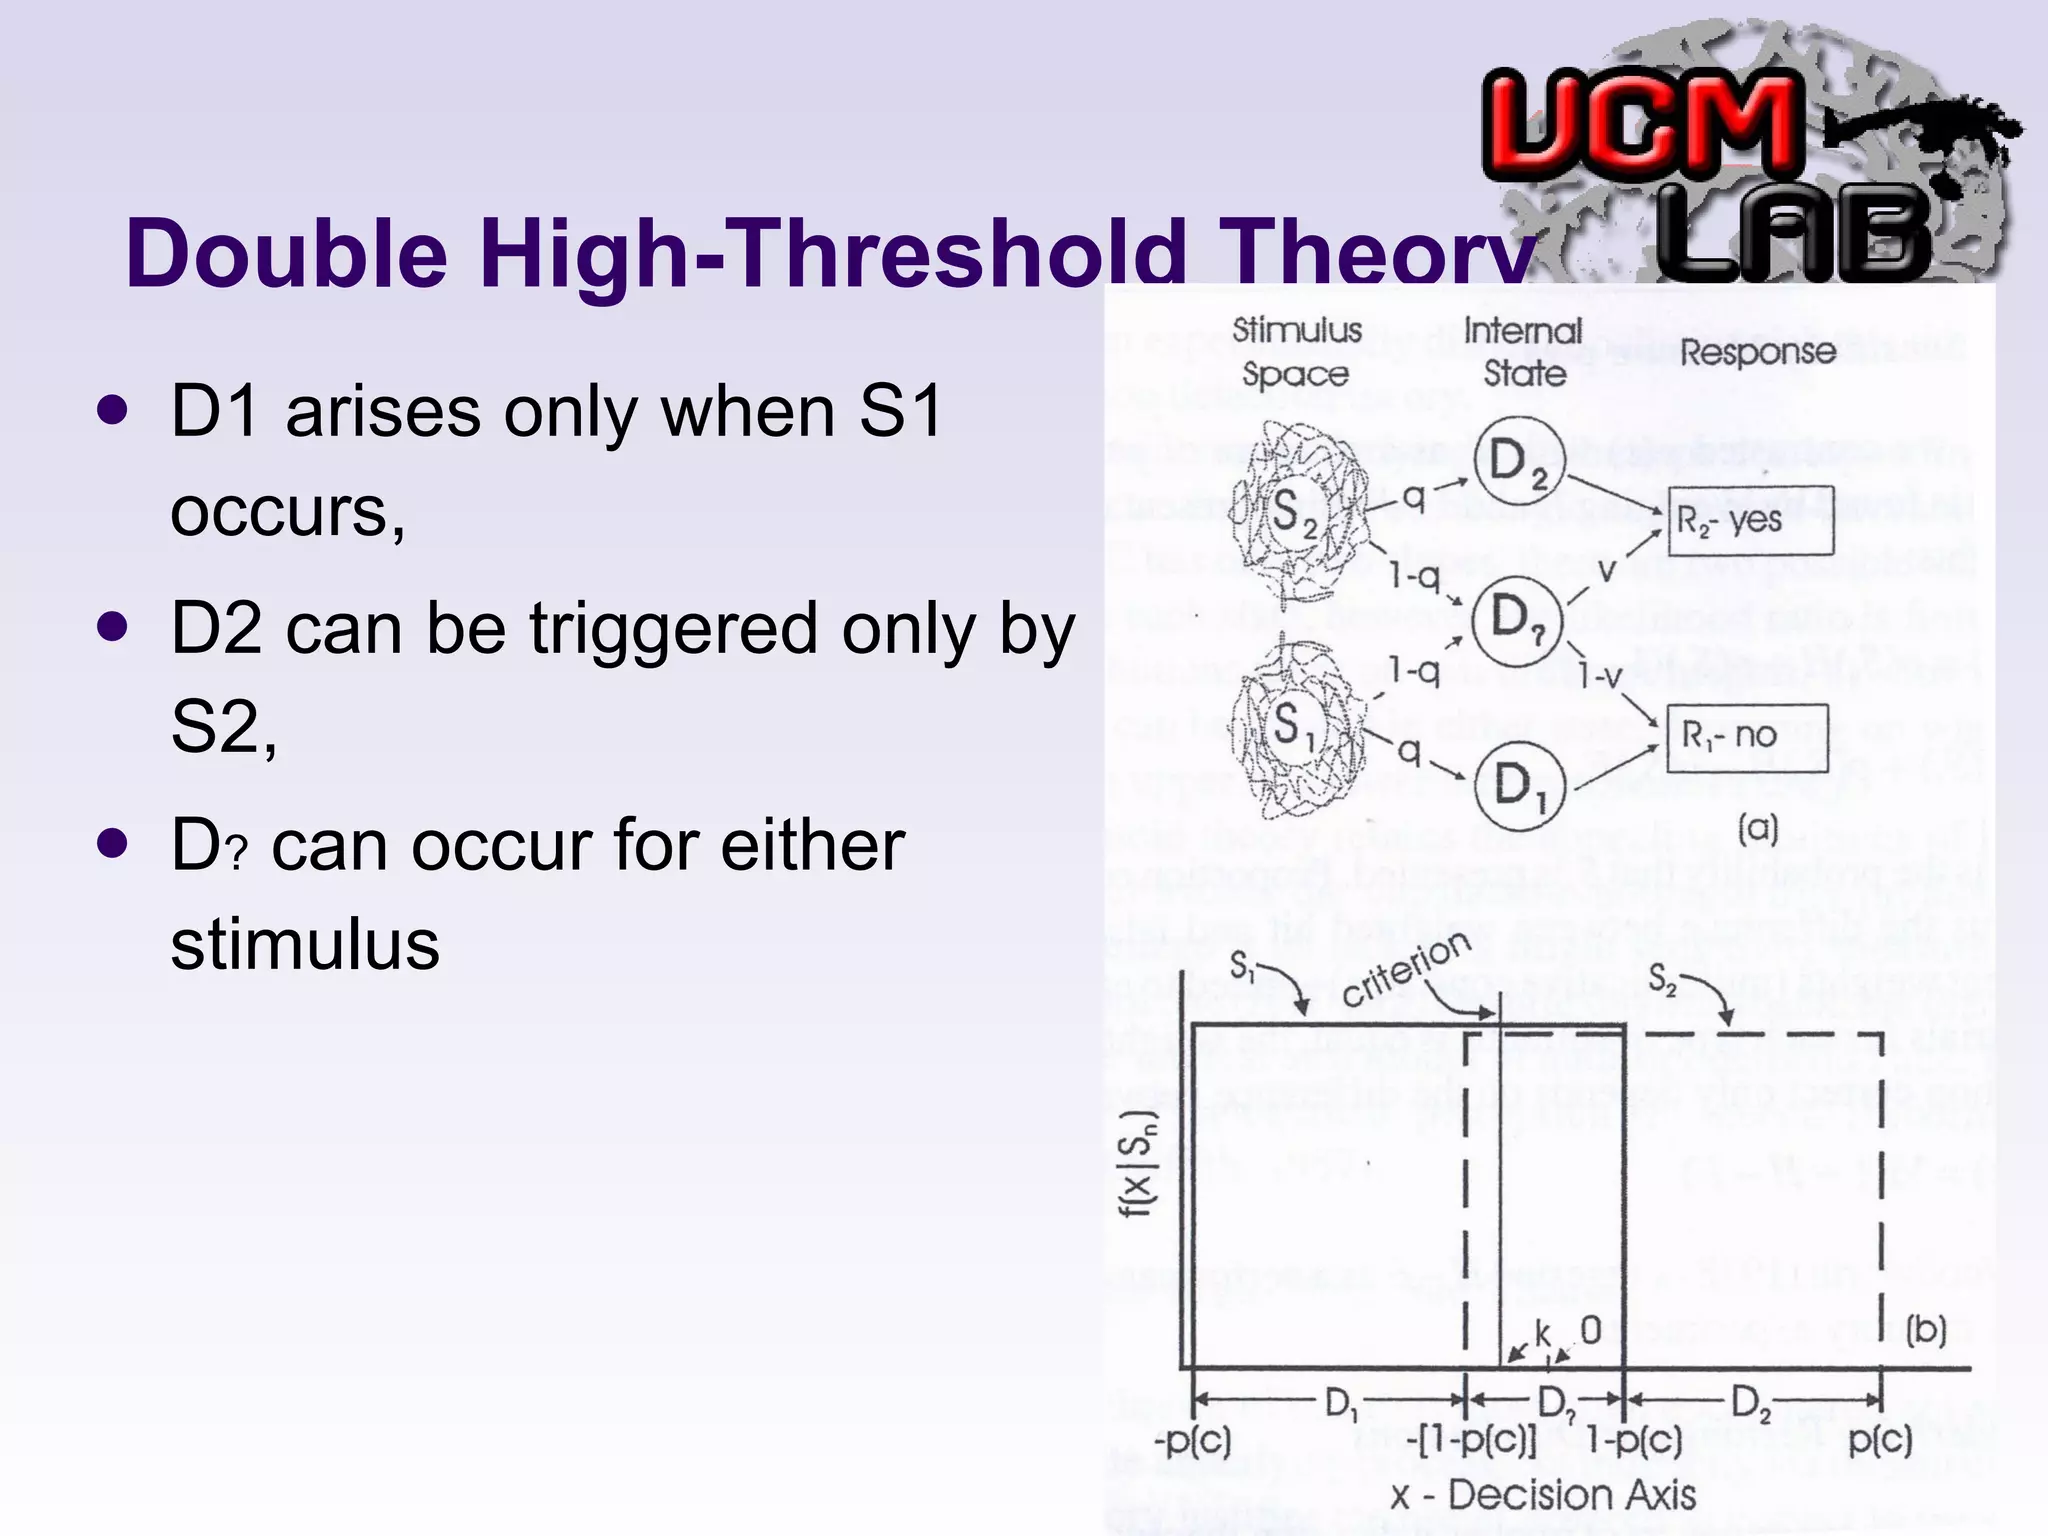
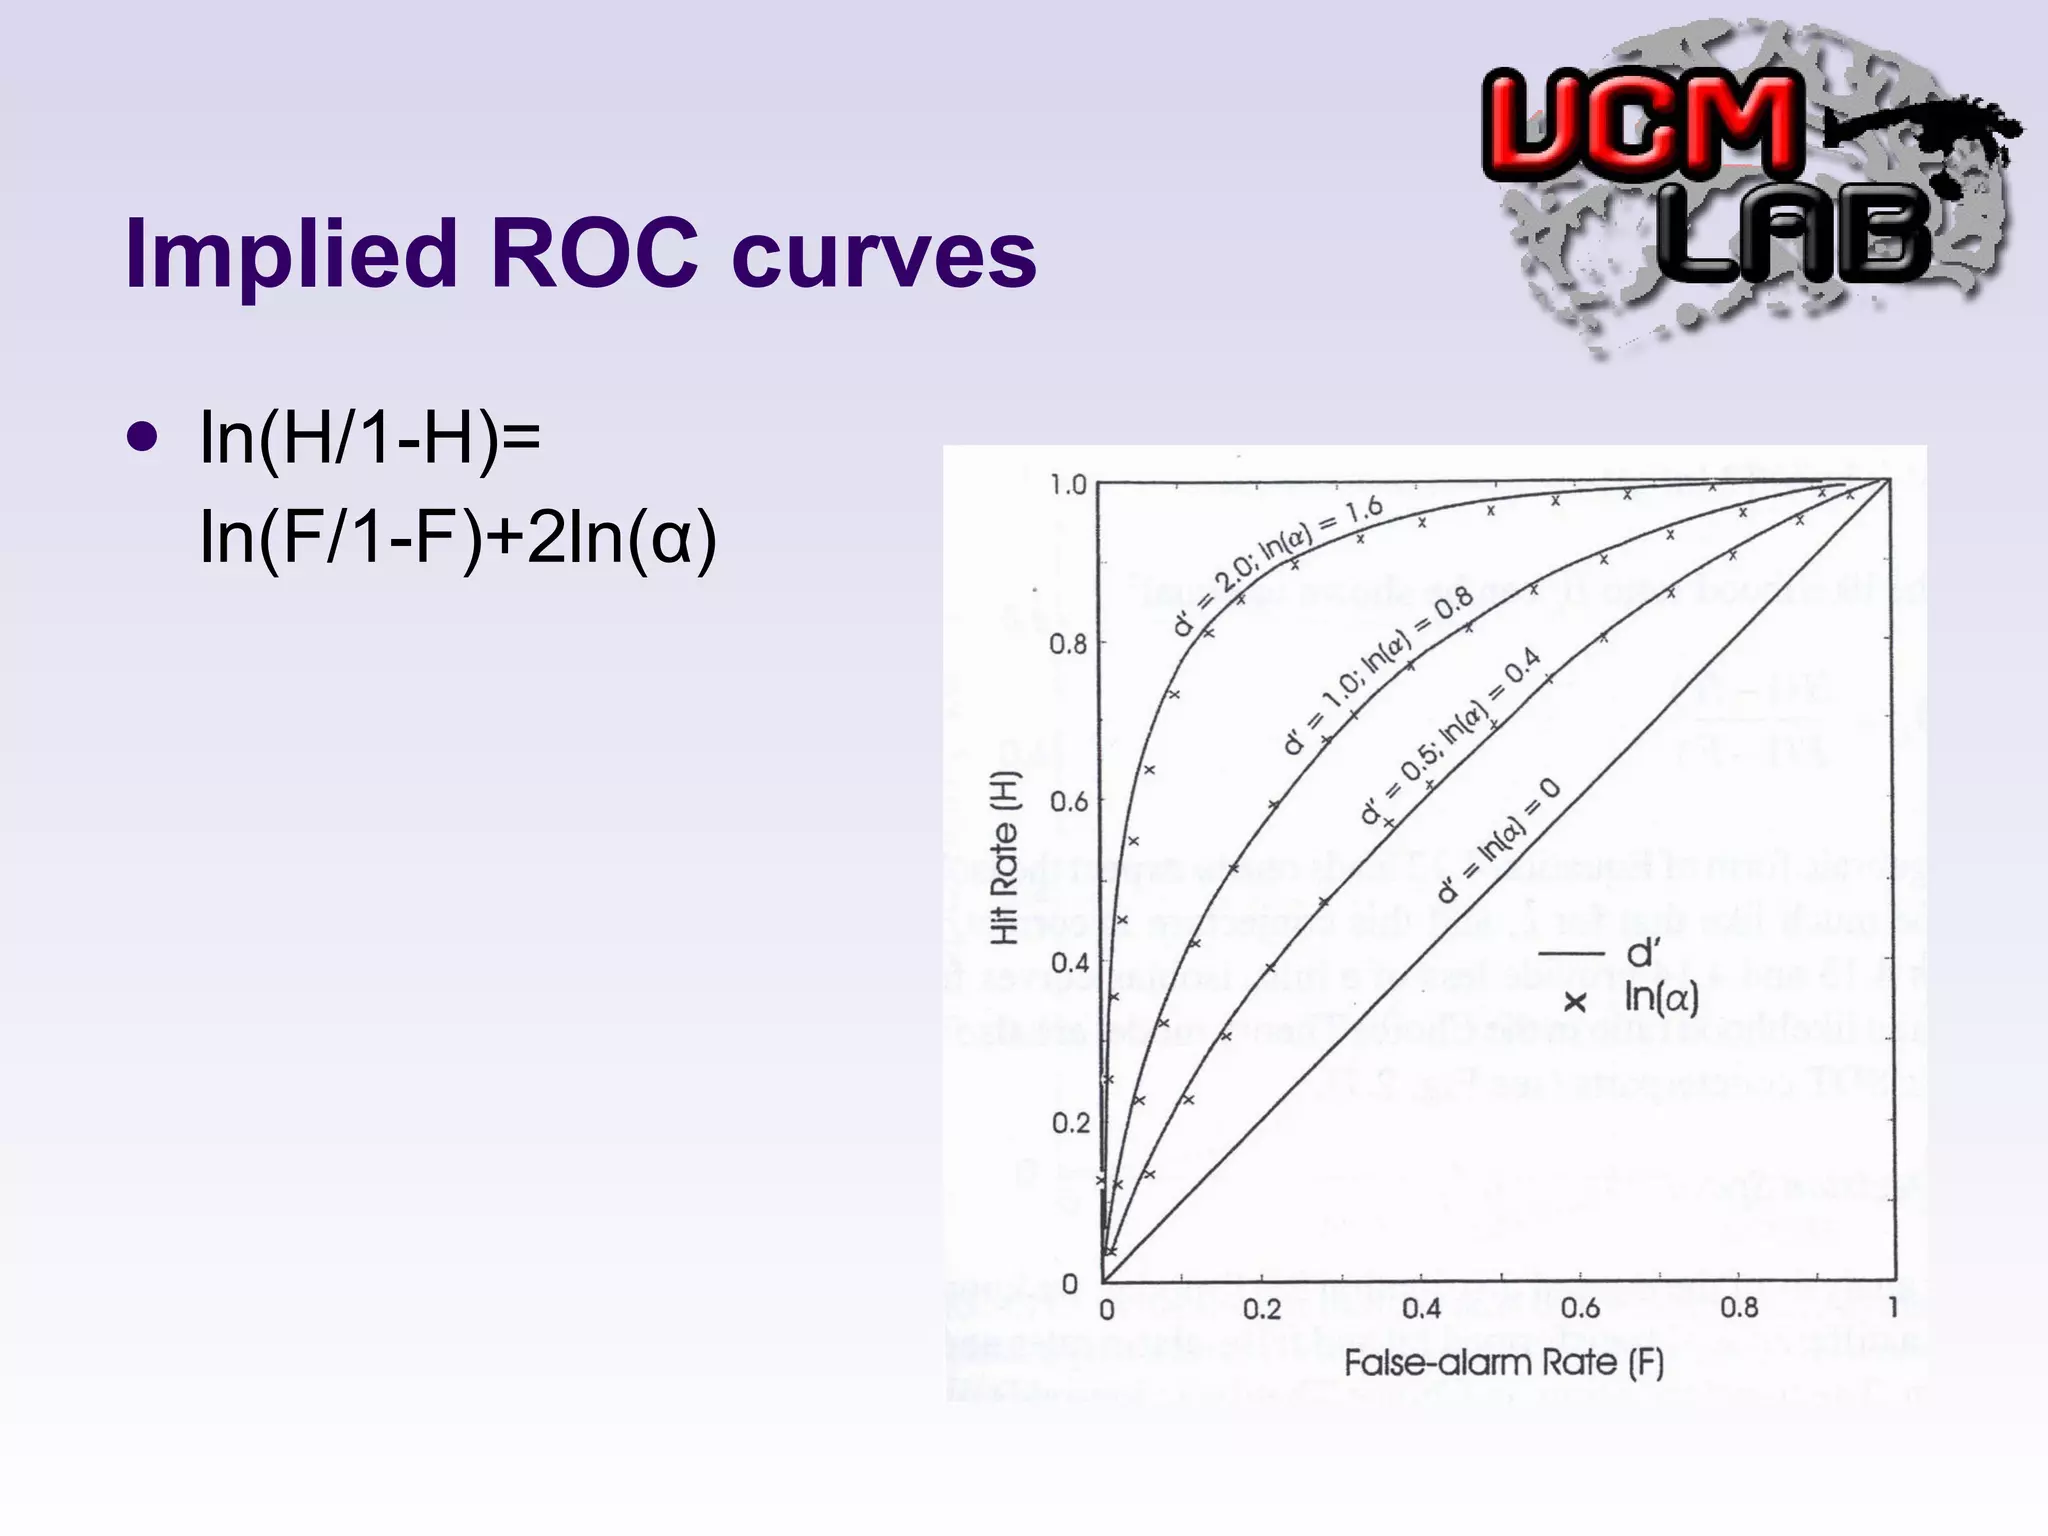
This document discusses several threshold and choice theories that were developed to model human decision making in psychophysics experiments. It describes single high-threshold theory, low-threshold theory, and double high-threshold theory, which make different assumptions about the thresholds used to discriminate between stimuli. It also discusses Luce's choice theory, which is based on choice axioms and models decisions using log-odds. Choice theory represents sensitivity using a measure called alpha and bias using a measure called beta.

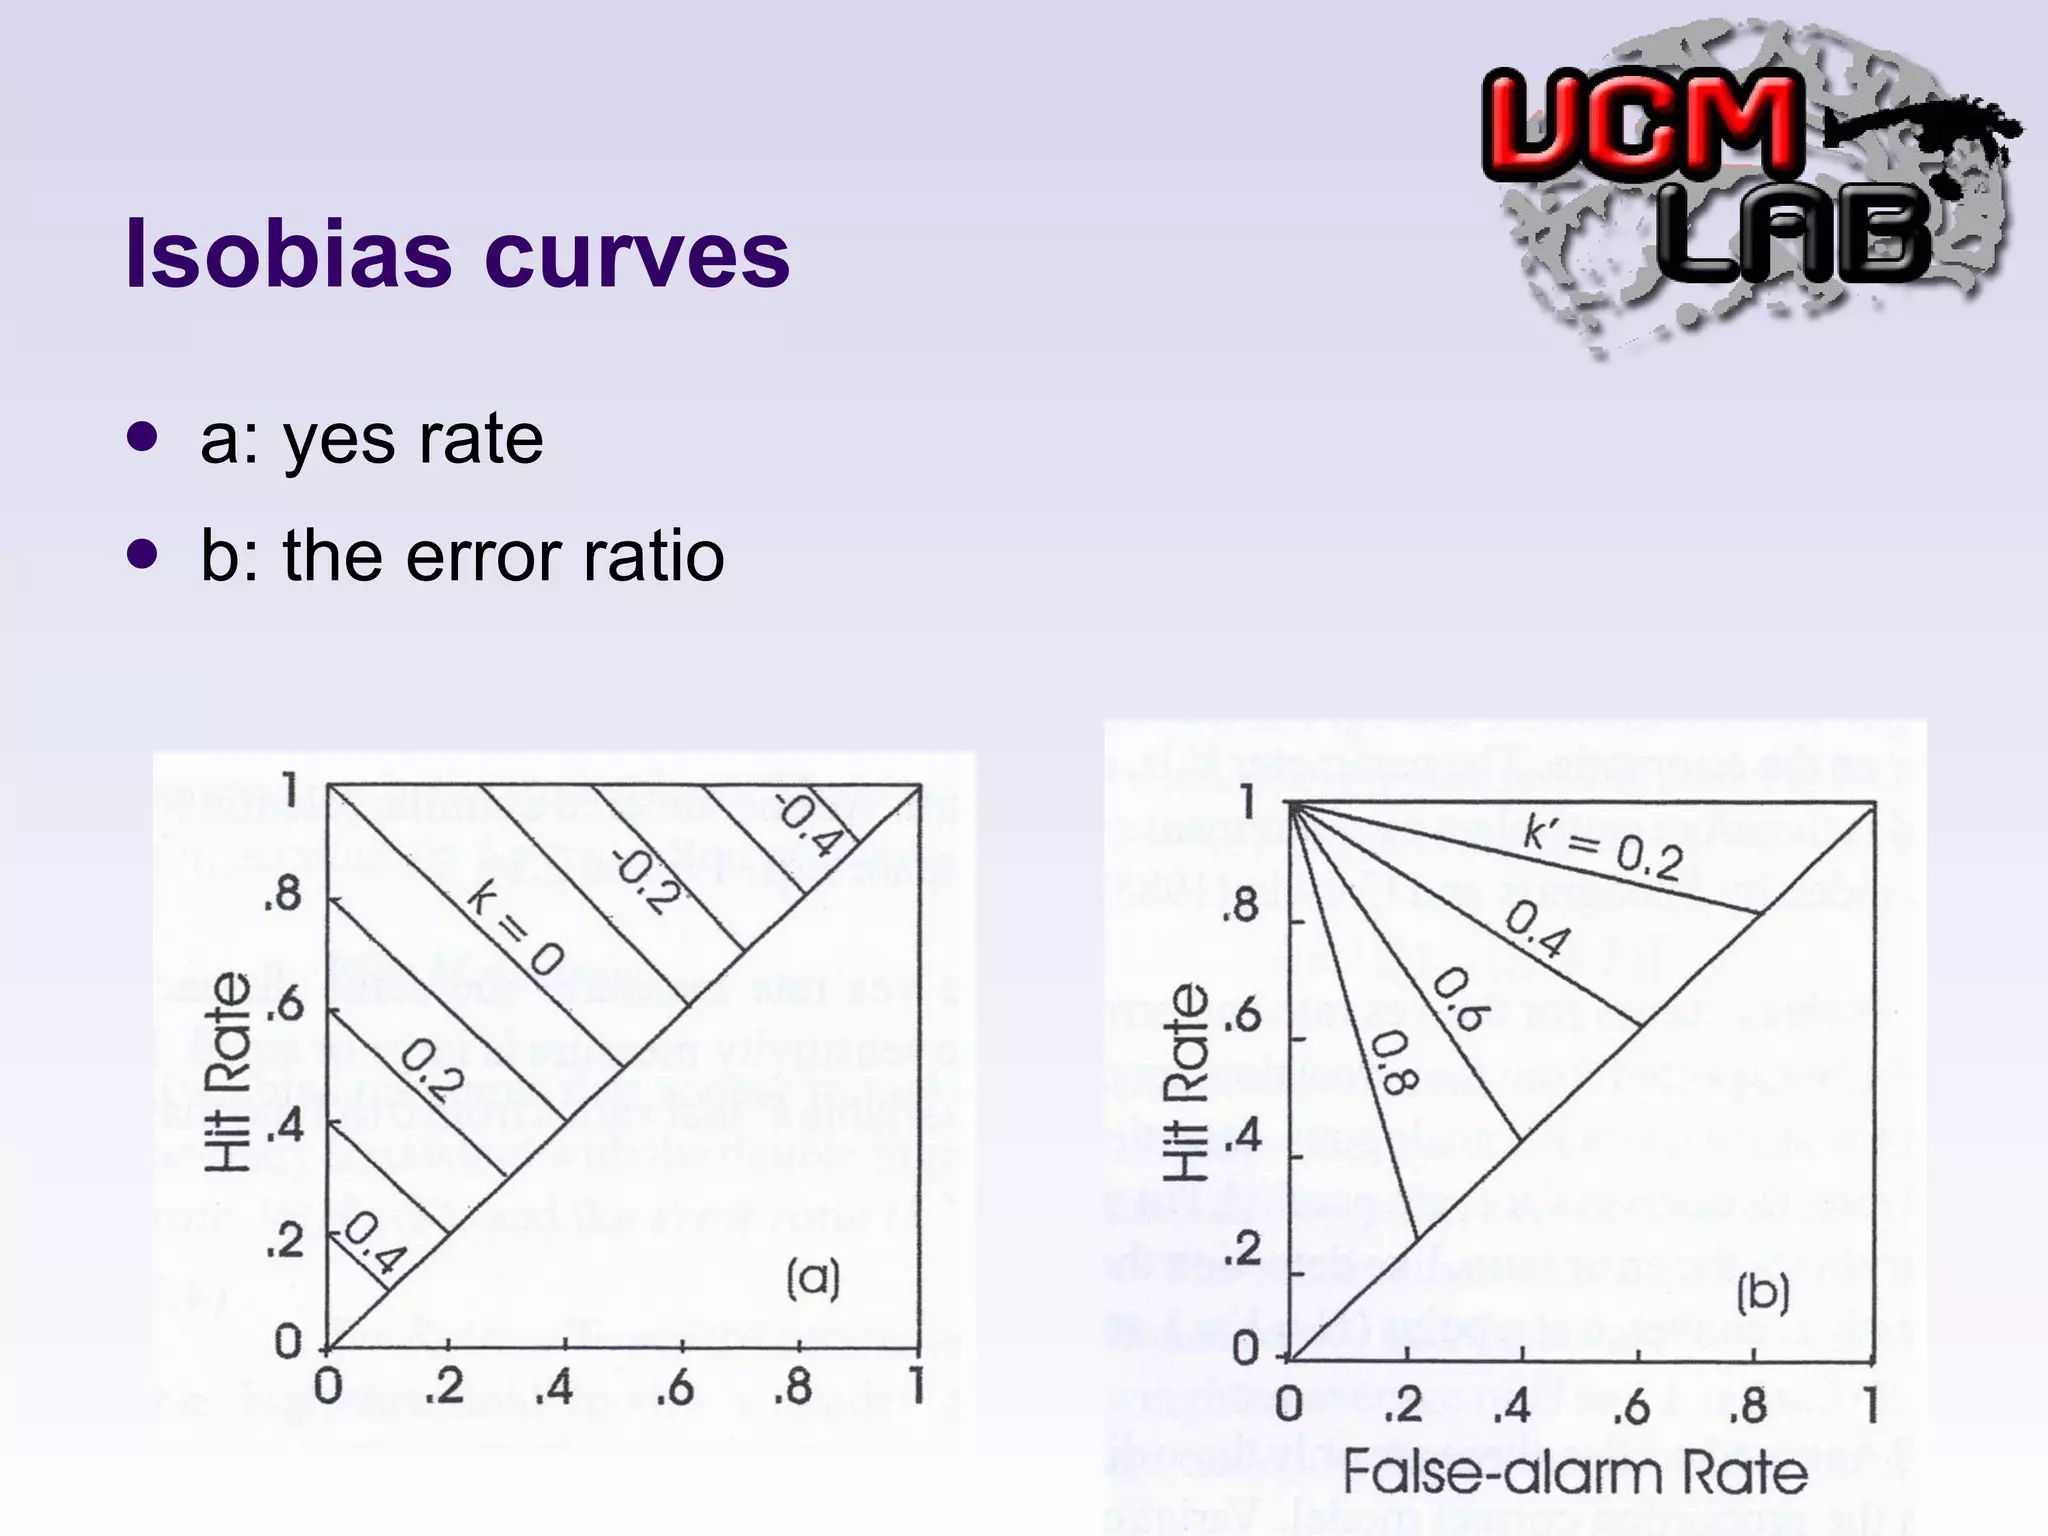
![Yes Rate: ½ (H+F) Error Rate: (1-H)/F k is criterion H=p(c)-k F=1-p(c)-k k=1/2[1-(H+F)]](https://image.slidesharecdn.com/ch-4alternativeapproaches-110624022339-phpapp02/75/DETECTION-THEORY-CHAPTER-4-16-2048.jpg)
![Error ratio: Linearly transform k into a new variable k’ that varies from 0 to 1, no matter what p(c) k’=[1+F/(1-H)] -1 k’=1-v](https://image.slidesharecdn.com/ch-4alternativeapproaches-110624022339-phpapp02/75/DETECTION-THEORY-CHAPTER-4-17-2048.jpg)
![Choice Theory Base on choice axiom Sensitivity Measure: α α=[H(1-F)/(1-H)F] 1/2 ln(α)=1/2ln(H/1-H)-1/2ln(F/1-F)](https://image.slidesharecdn.com/ch-4alternativeapproaches-110624022339-phpapp02/75/DETECTION-THEORY-CHAPTER-4-19-2048.jpg)
![Bias Measures b (for “bias”)=[(1-H)(1-F)/HF] 1/2 ln(b)=-1/2[ln(H/1-H)+ln(F/1-F)] b’=ln(b)/[2 ln(α)] β L =H(1-H)/F1-F](https://image.slidesharecdn.com/ch-4alternativeapproaches-110624022339-phpapp02/75/DETECTION-THEORY-CHAPTER-4-21-2048.jpg)
![Choice Theory is log-odds, which converts a proportion p to ln[p/(1-p)]](https://image.slidesharecdn.com/ch-4alternativeapproaches-110624022339-phpapp02/75/DETECTION-THEORY-CHAPTER-4-22-2048.jpg)
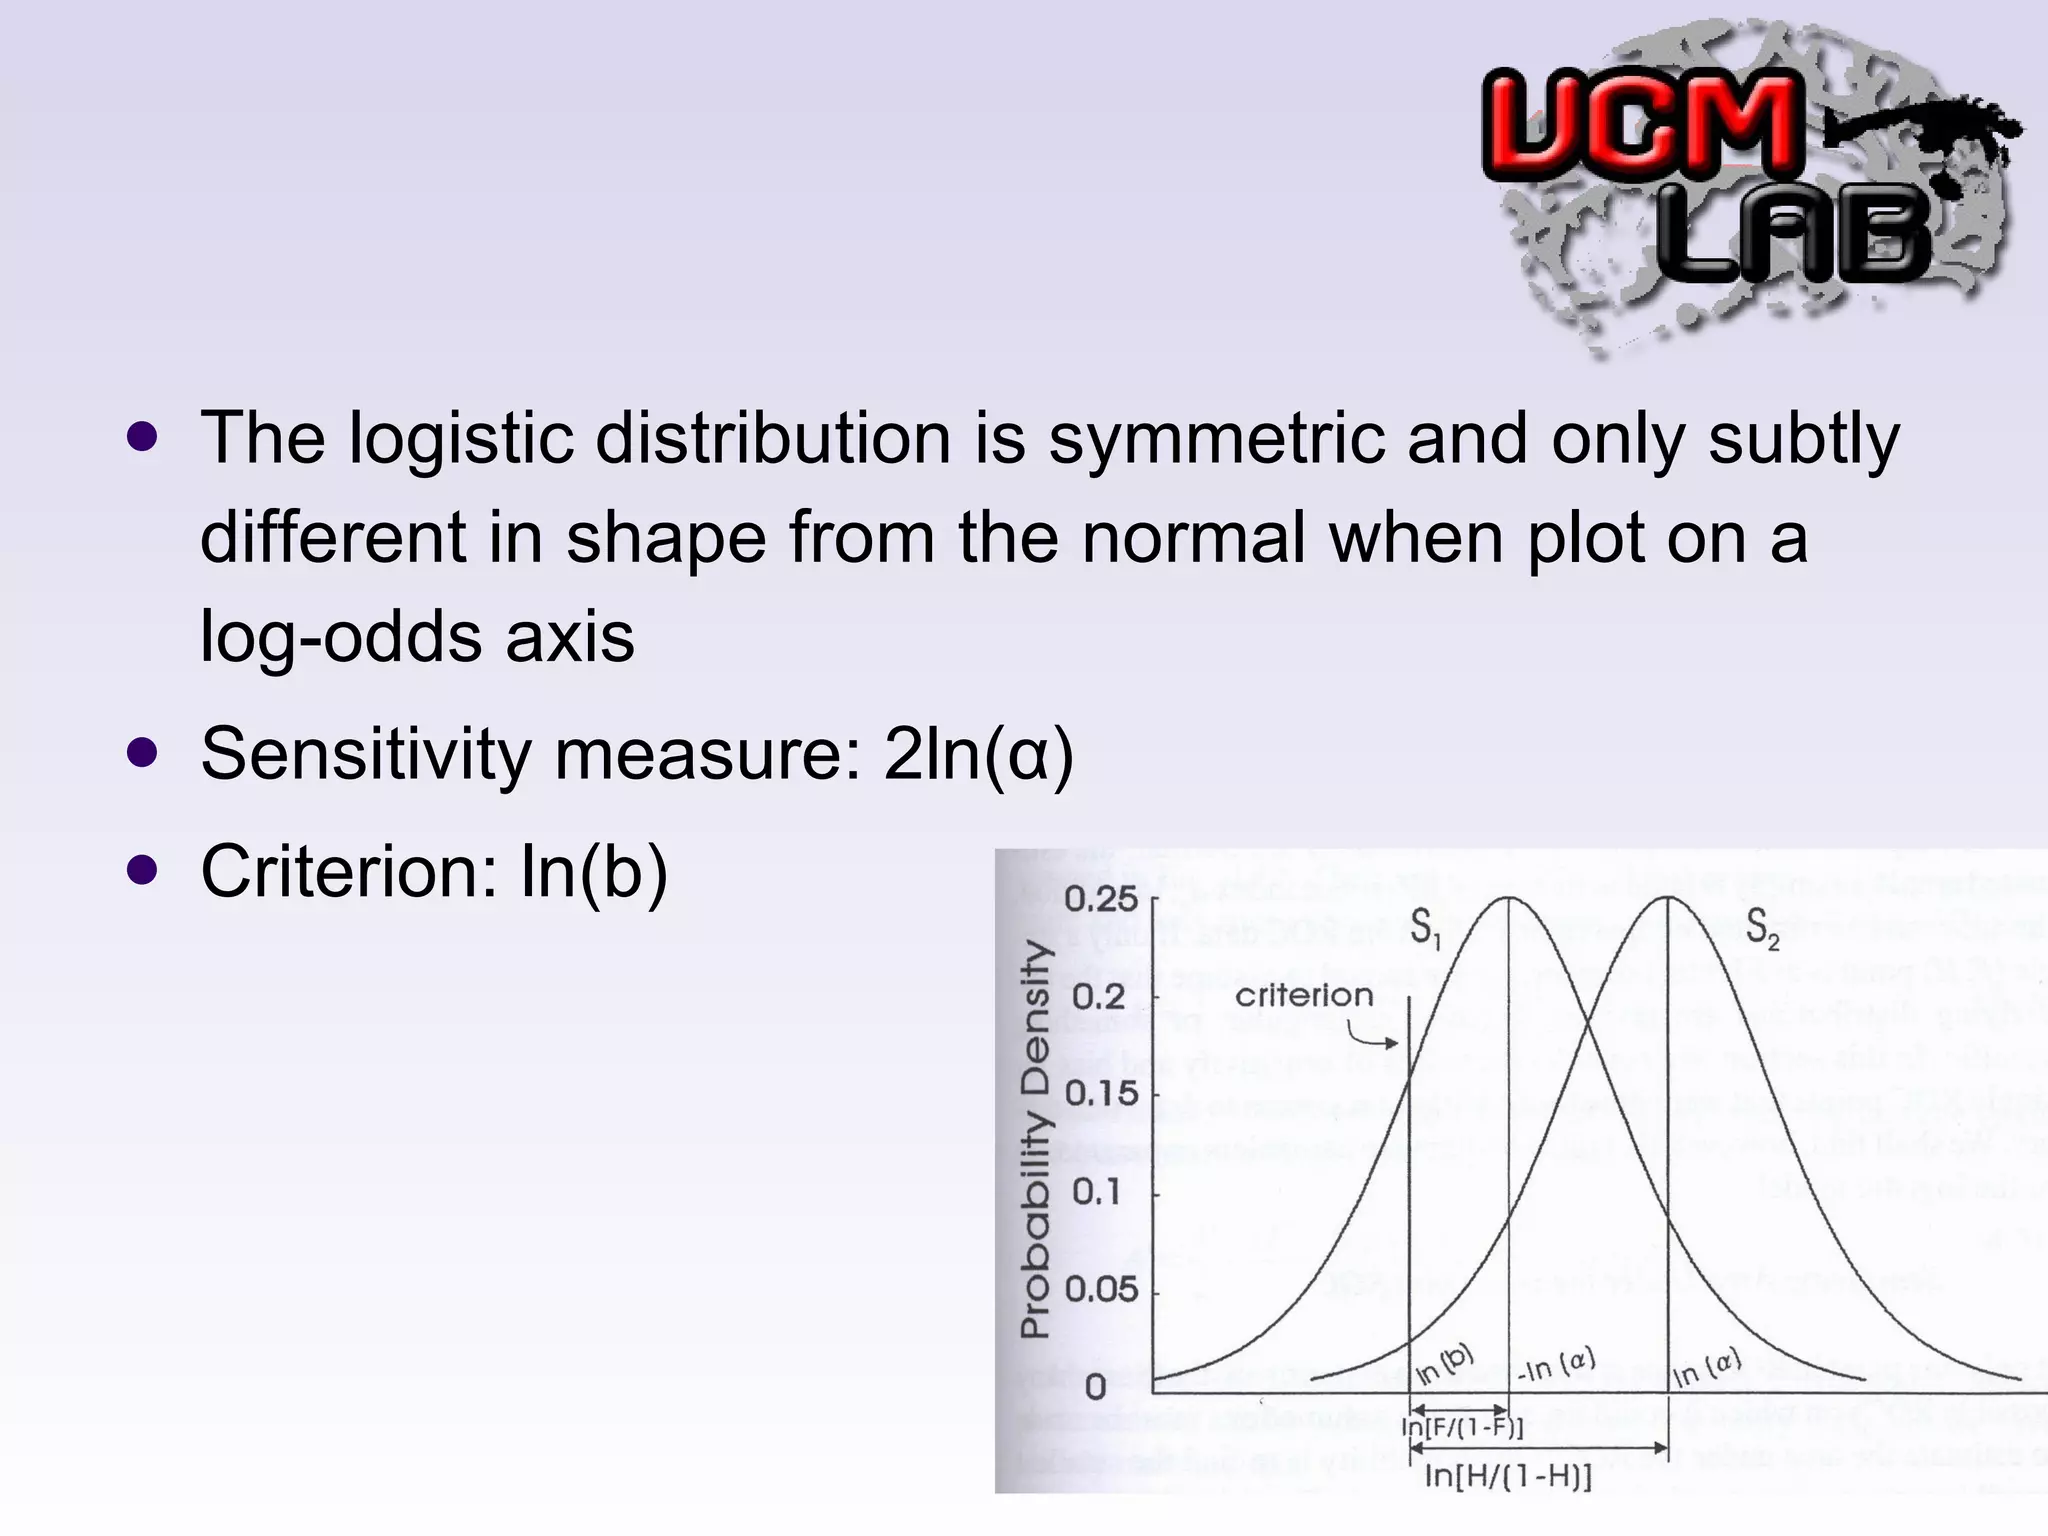
![x= ln[p/(1-p)] p=1/(1+e x ) x must be expressed as a distance from the mean S2 distribution: x=ln(b)-ln(α) S1 distribution: x=ln(b)+ln(α) H=α/(α+b) F=1/(1+αb)](https://image.slidesharecdn.com/ch-4alternativeapproaches-110624022339-phpapp02/75/DETECTION-THEORY-CHAPTER-4-24-2048.jpg)
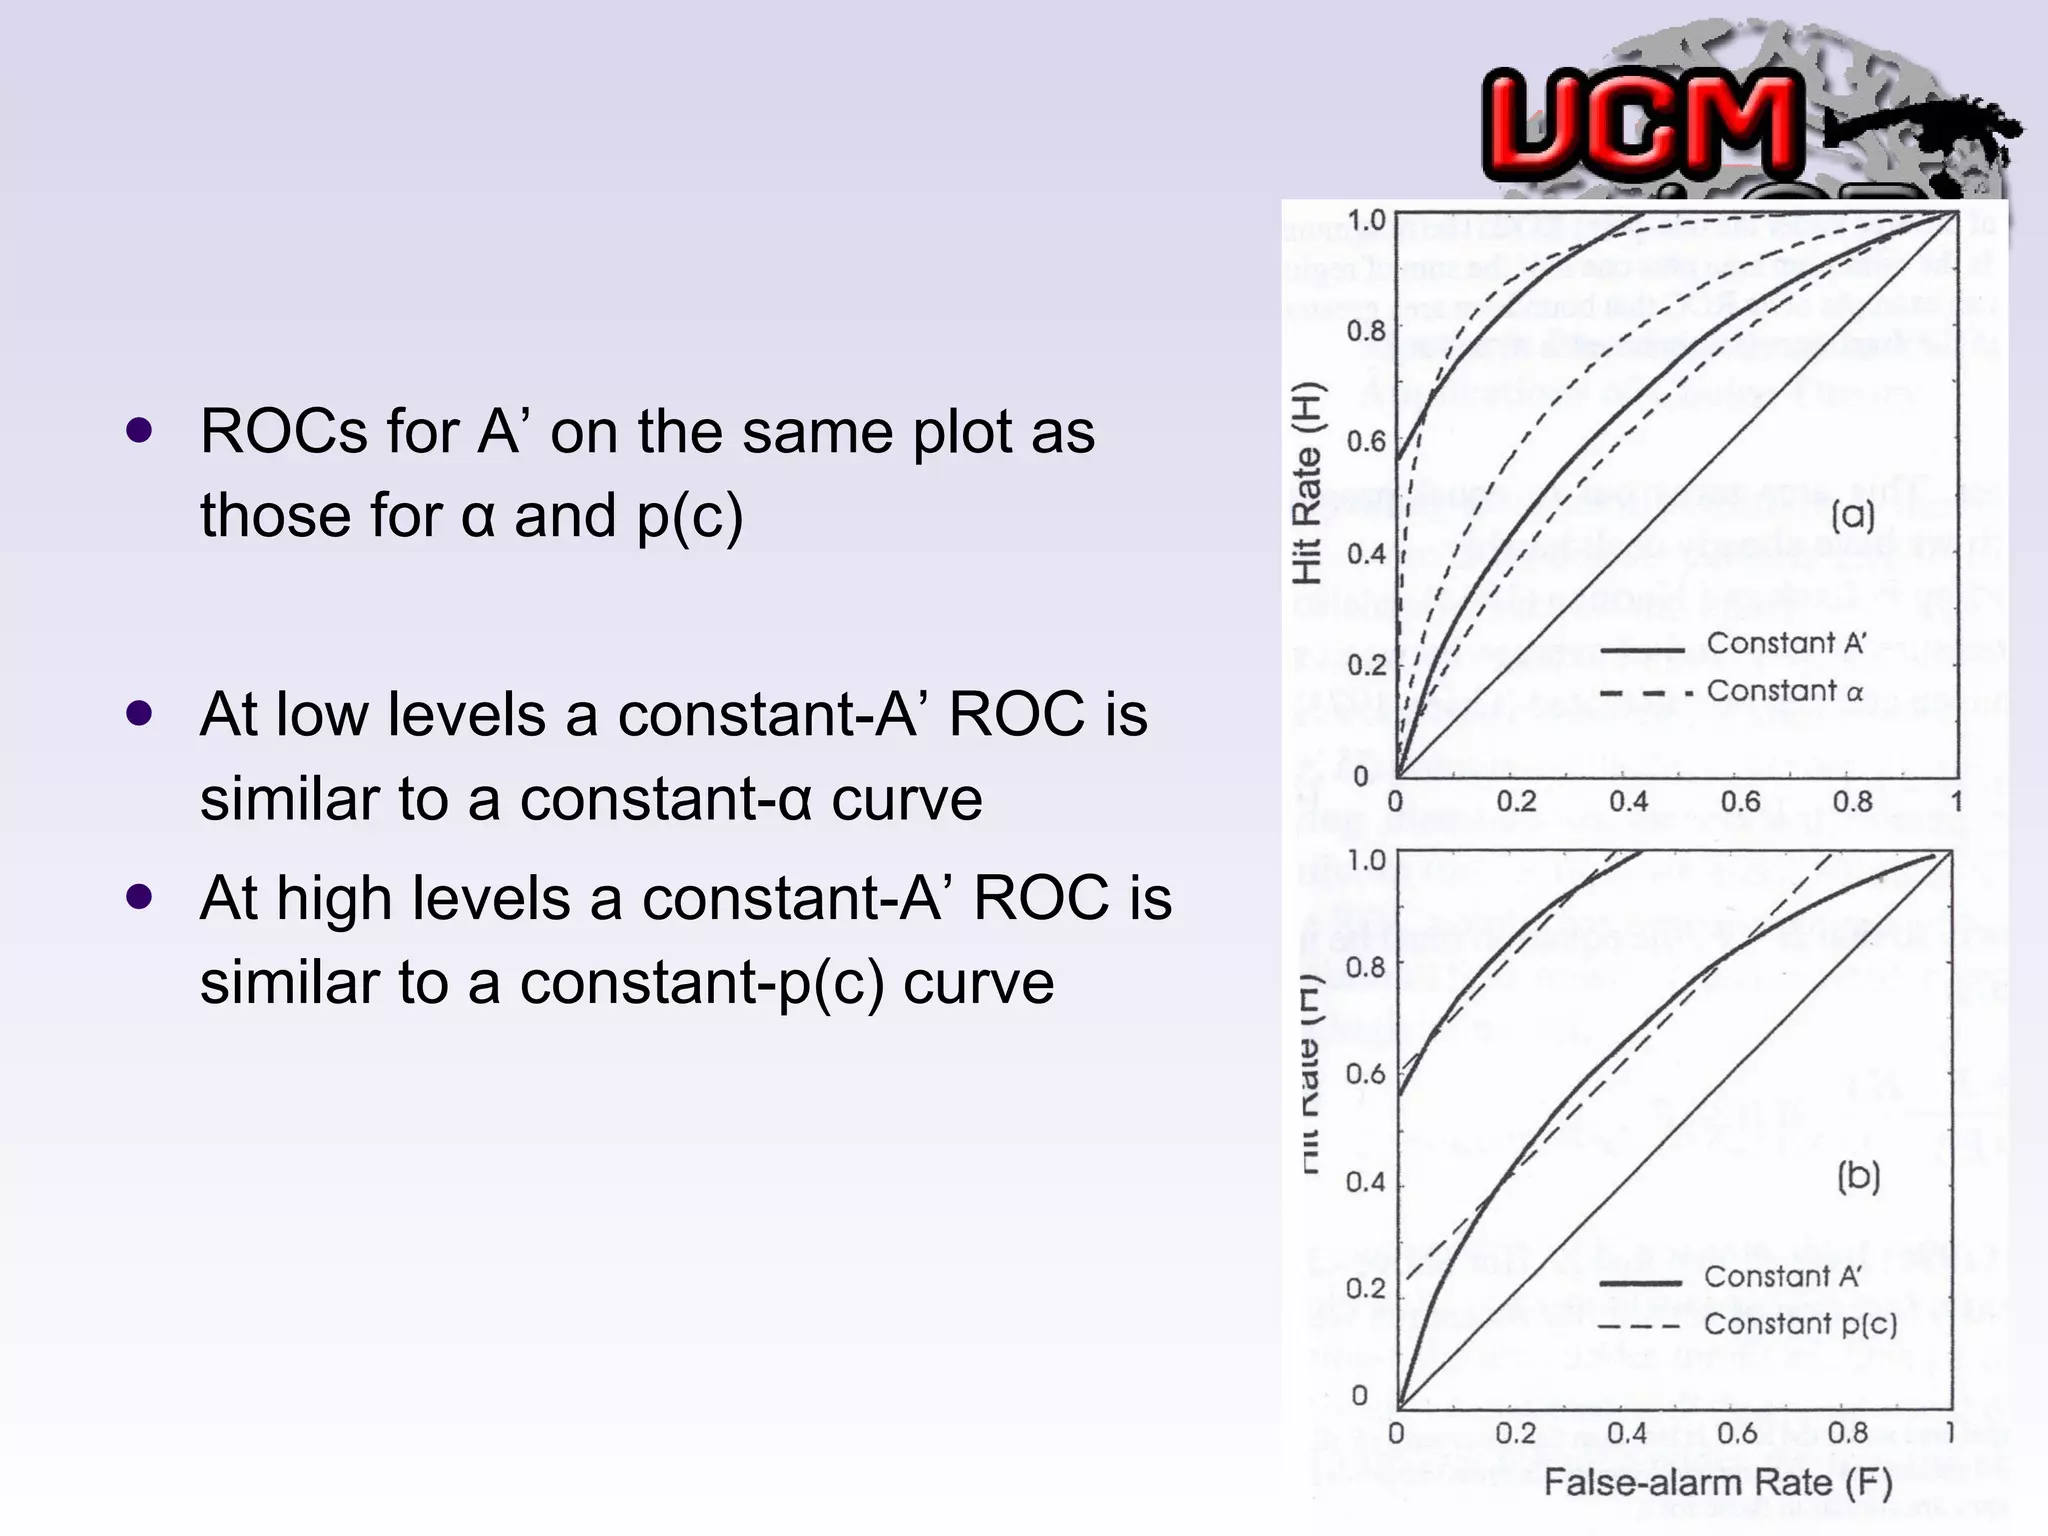
![Area Under the one-point ROC A’=1/2+(H-F)(1+H-F)/4H(1-F), if H>=F A’= 1/2+(F-H)(1+F-H)/4F(1-H), if H<=F A’=1/2+1/2p(c){1-1/[2ln(α)] 2 }](https://image.slidesharecdn.com/ch-4alternativeapproaches-110624022339-phpapp02/75/DETECTION-THEORY-CHAPTER-4-26-2048.jpg)