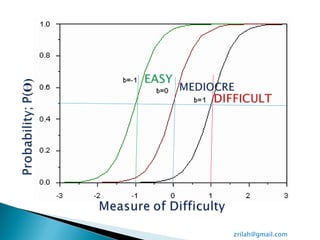
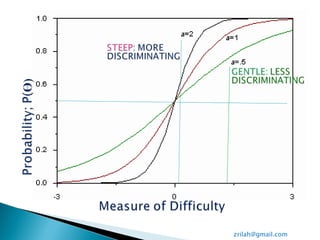
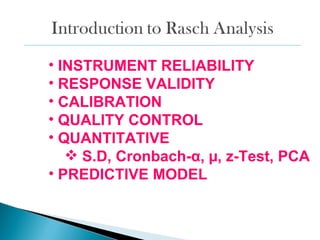
The document discusses Rasch measurement model and its advantages. It provides an overview of key Rasch concepts like instrument construct, findings and discussion. It then outlines some key benefits of Rasch analysis - it allows for easier interpretation of results, estimation of individual abilities independent of the instrument, and evaluation of how well data fits the measurement model. Rasch is also described as offering a probabilistic approach and separating item and person parameters.
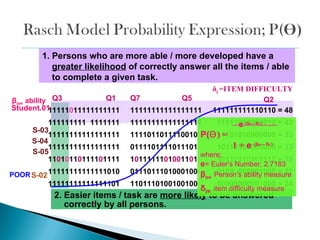

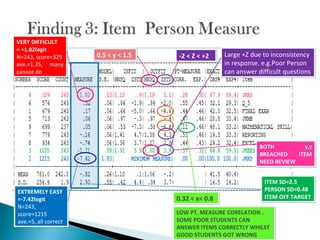
![-ve Person mean
μ = -0.03 logit
P[Ɵ] LOi= 0.4921
0.66 ‘Poor’ Person
separation of 2 groups.
0.31 ‘Poor’ reliability
Valid Responses:
99.9%
Cronbach-α :0.33 Poor
reliability assessment
of student learning
0.99; ‘Very Good’
instrument reliability
in item measuring
student learning ability](https://image.slidesharecdn.com/0-2araschmodeltheoremscaleconstruct-120507014908-phpapp01/85/Rasch-Model-Theorem_Scale-Construct-16-320.jpg)