Download to read offline


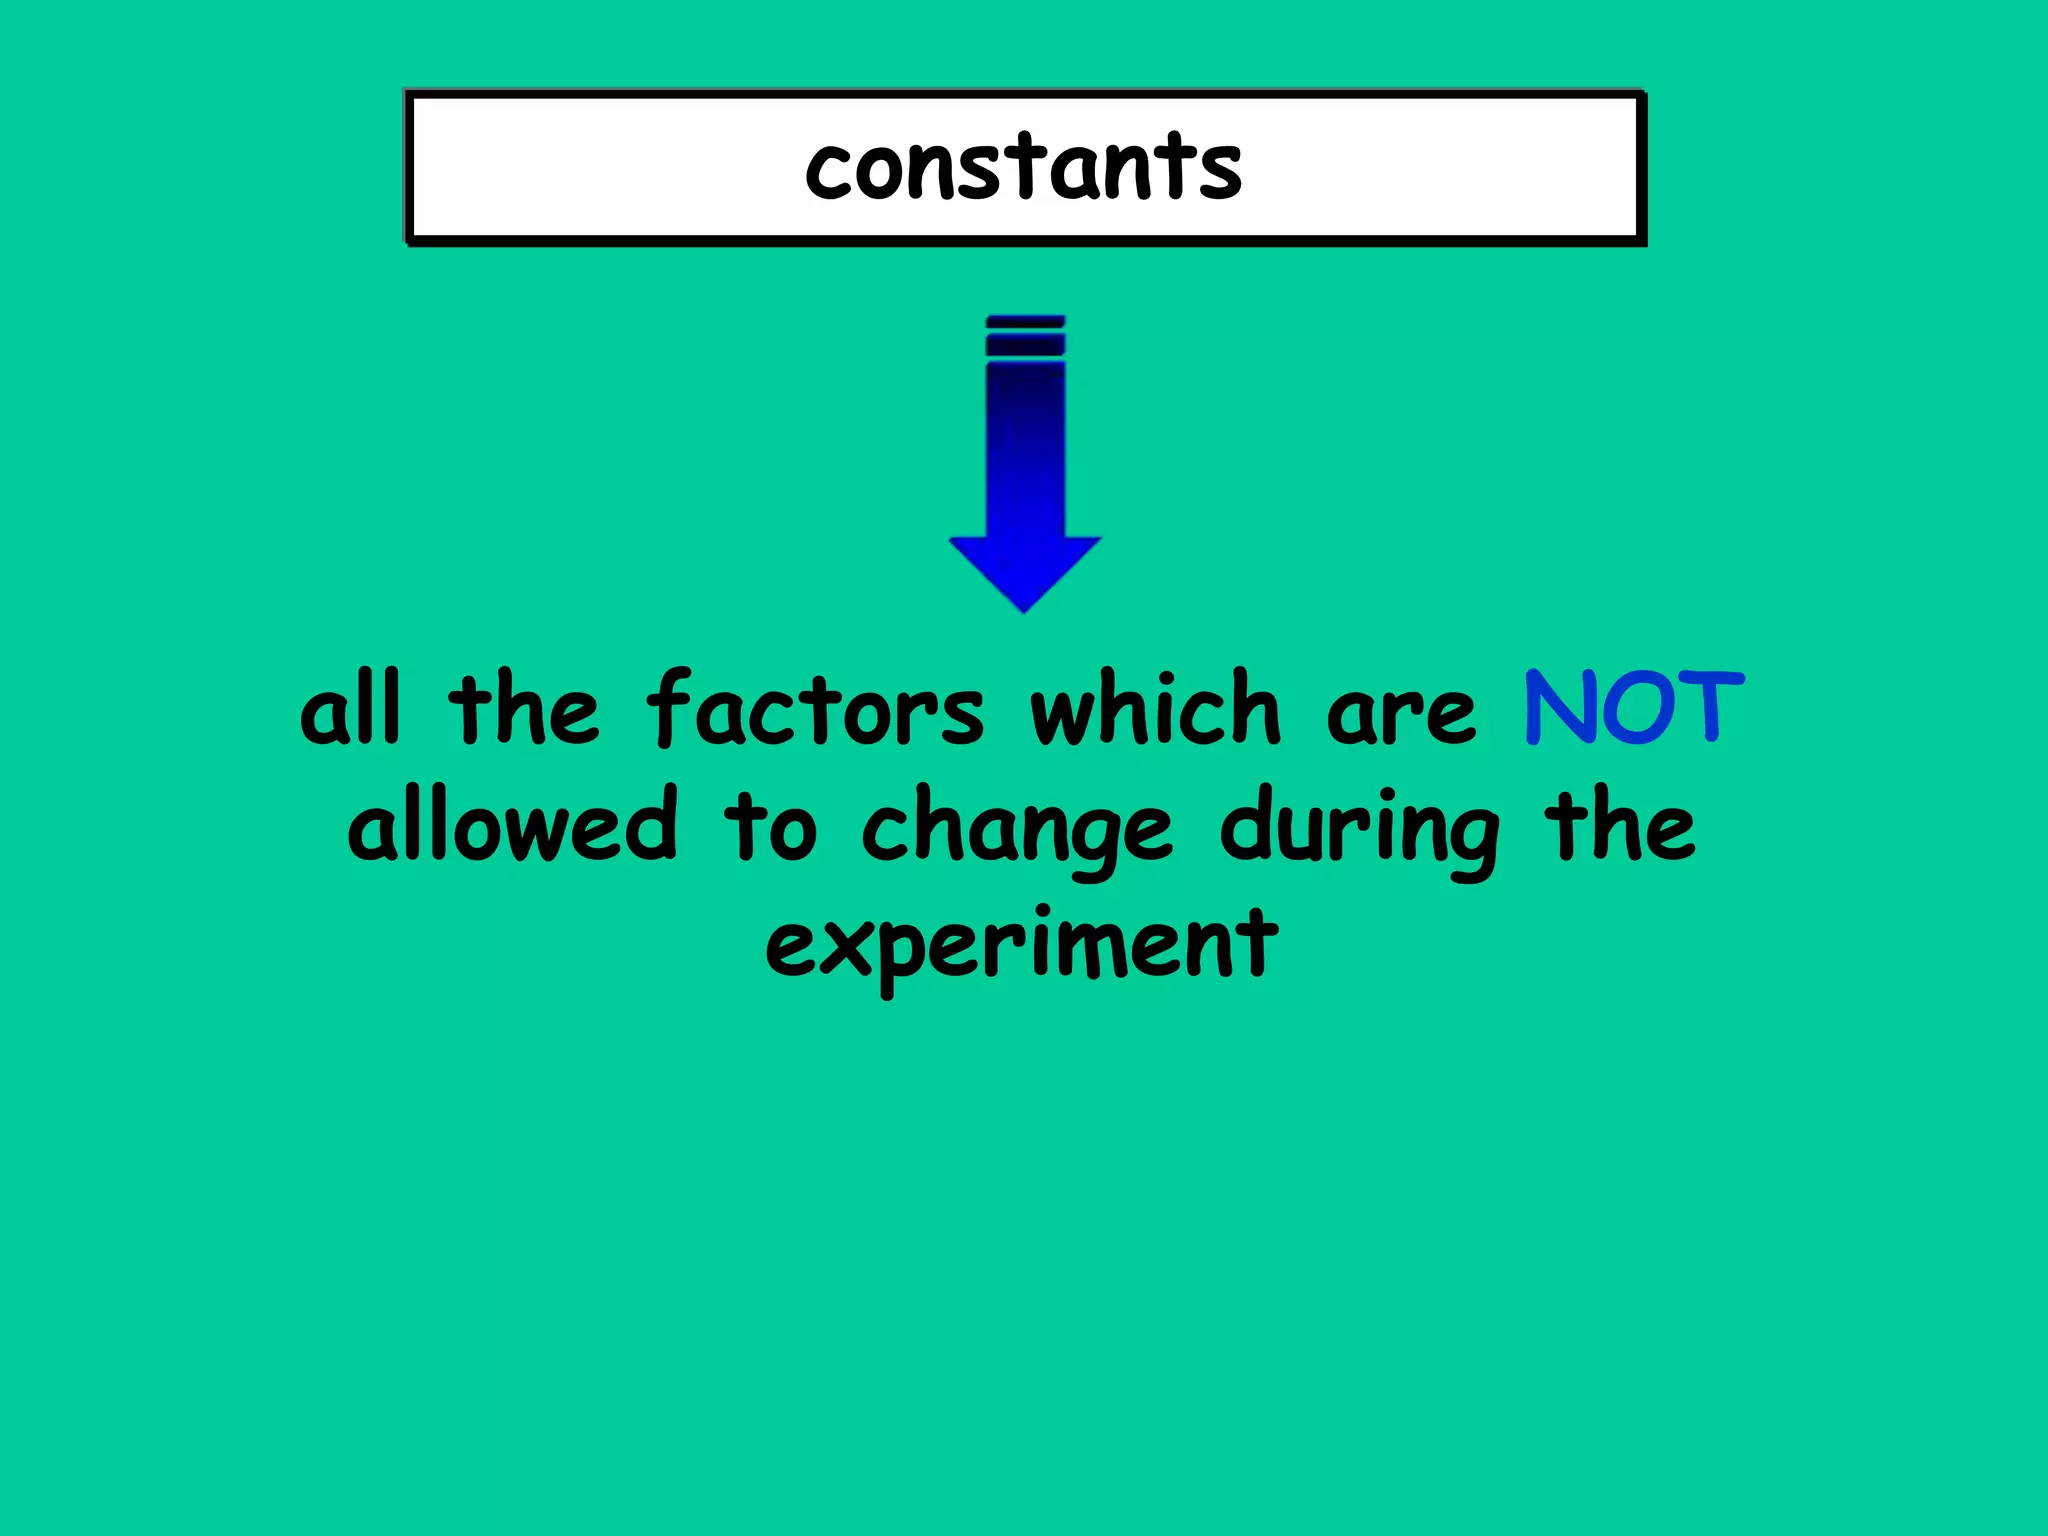


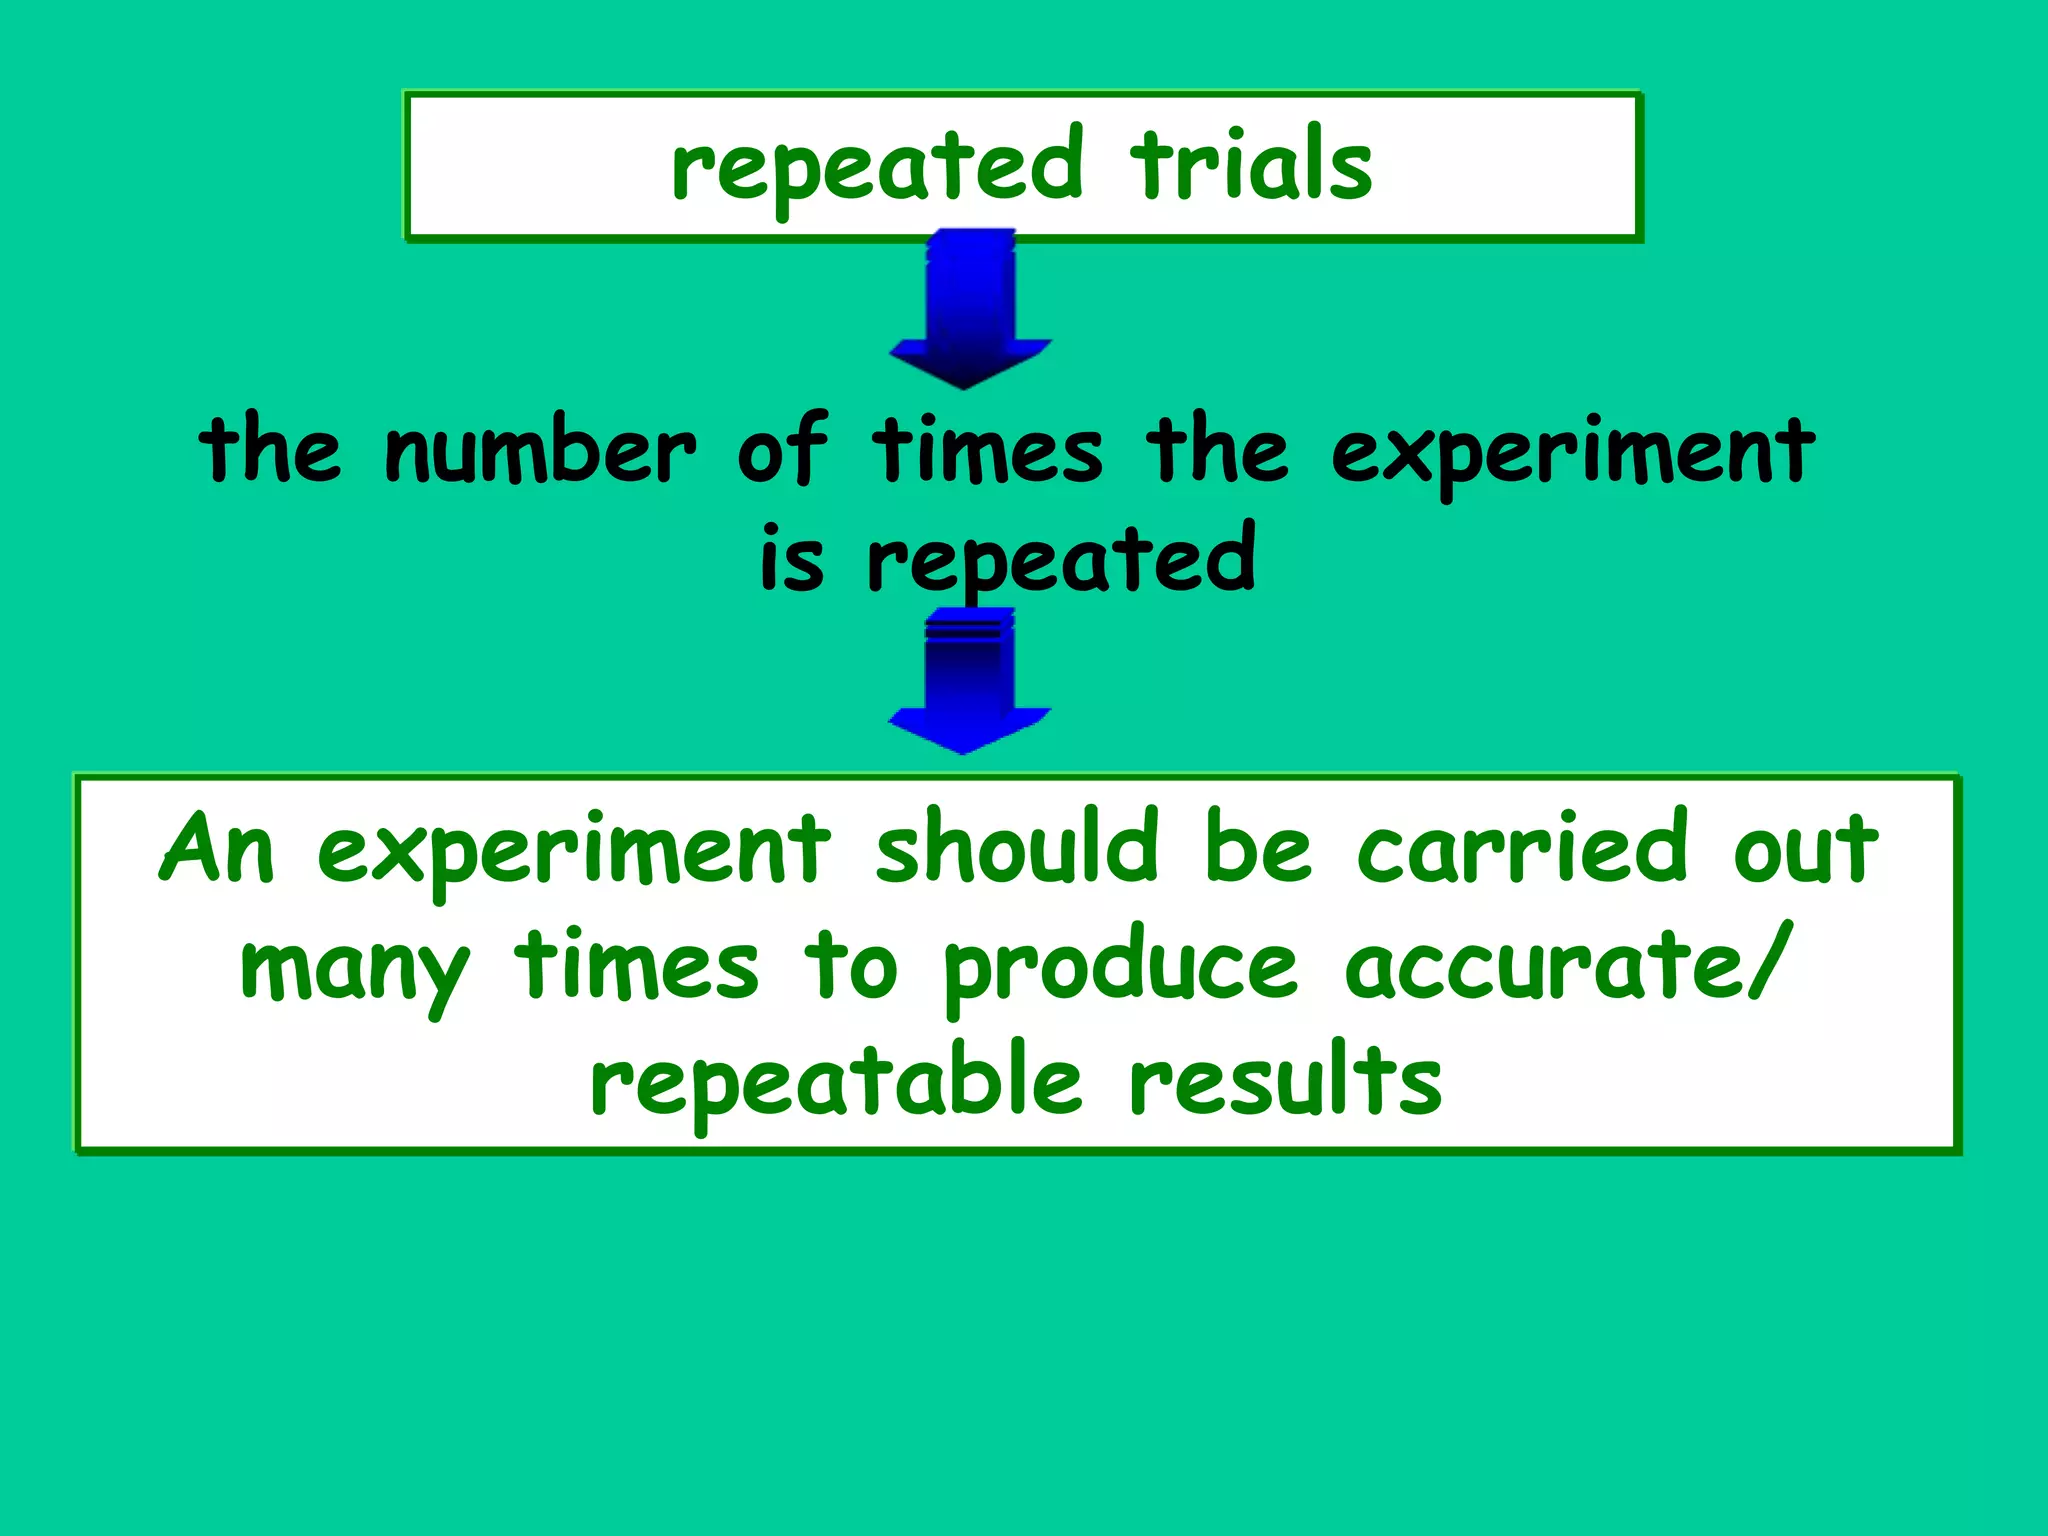


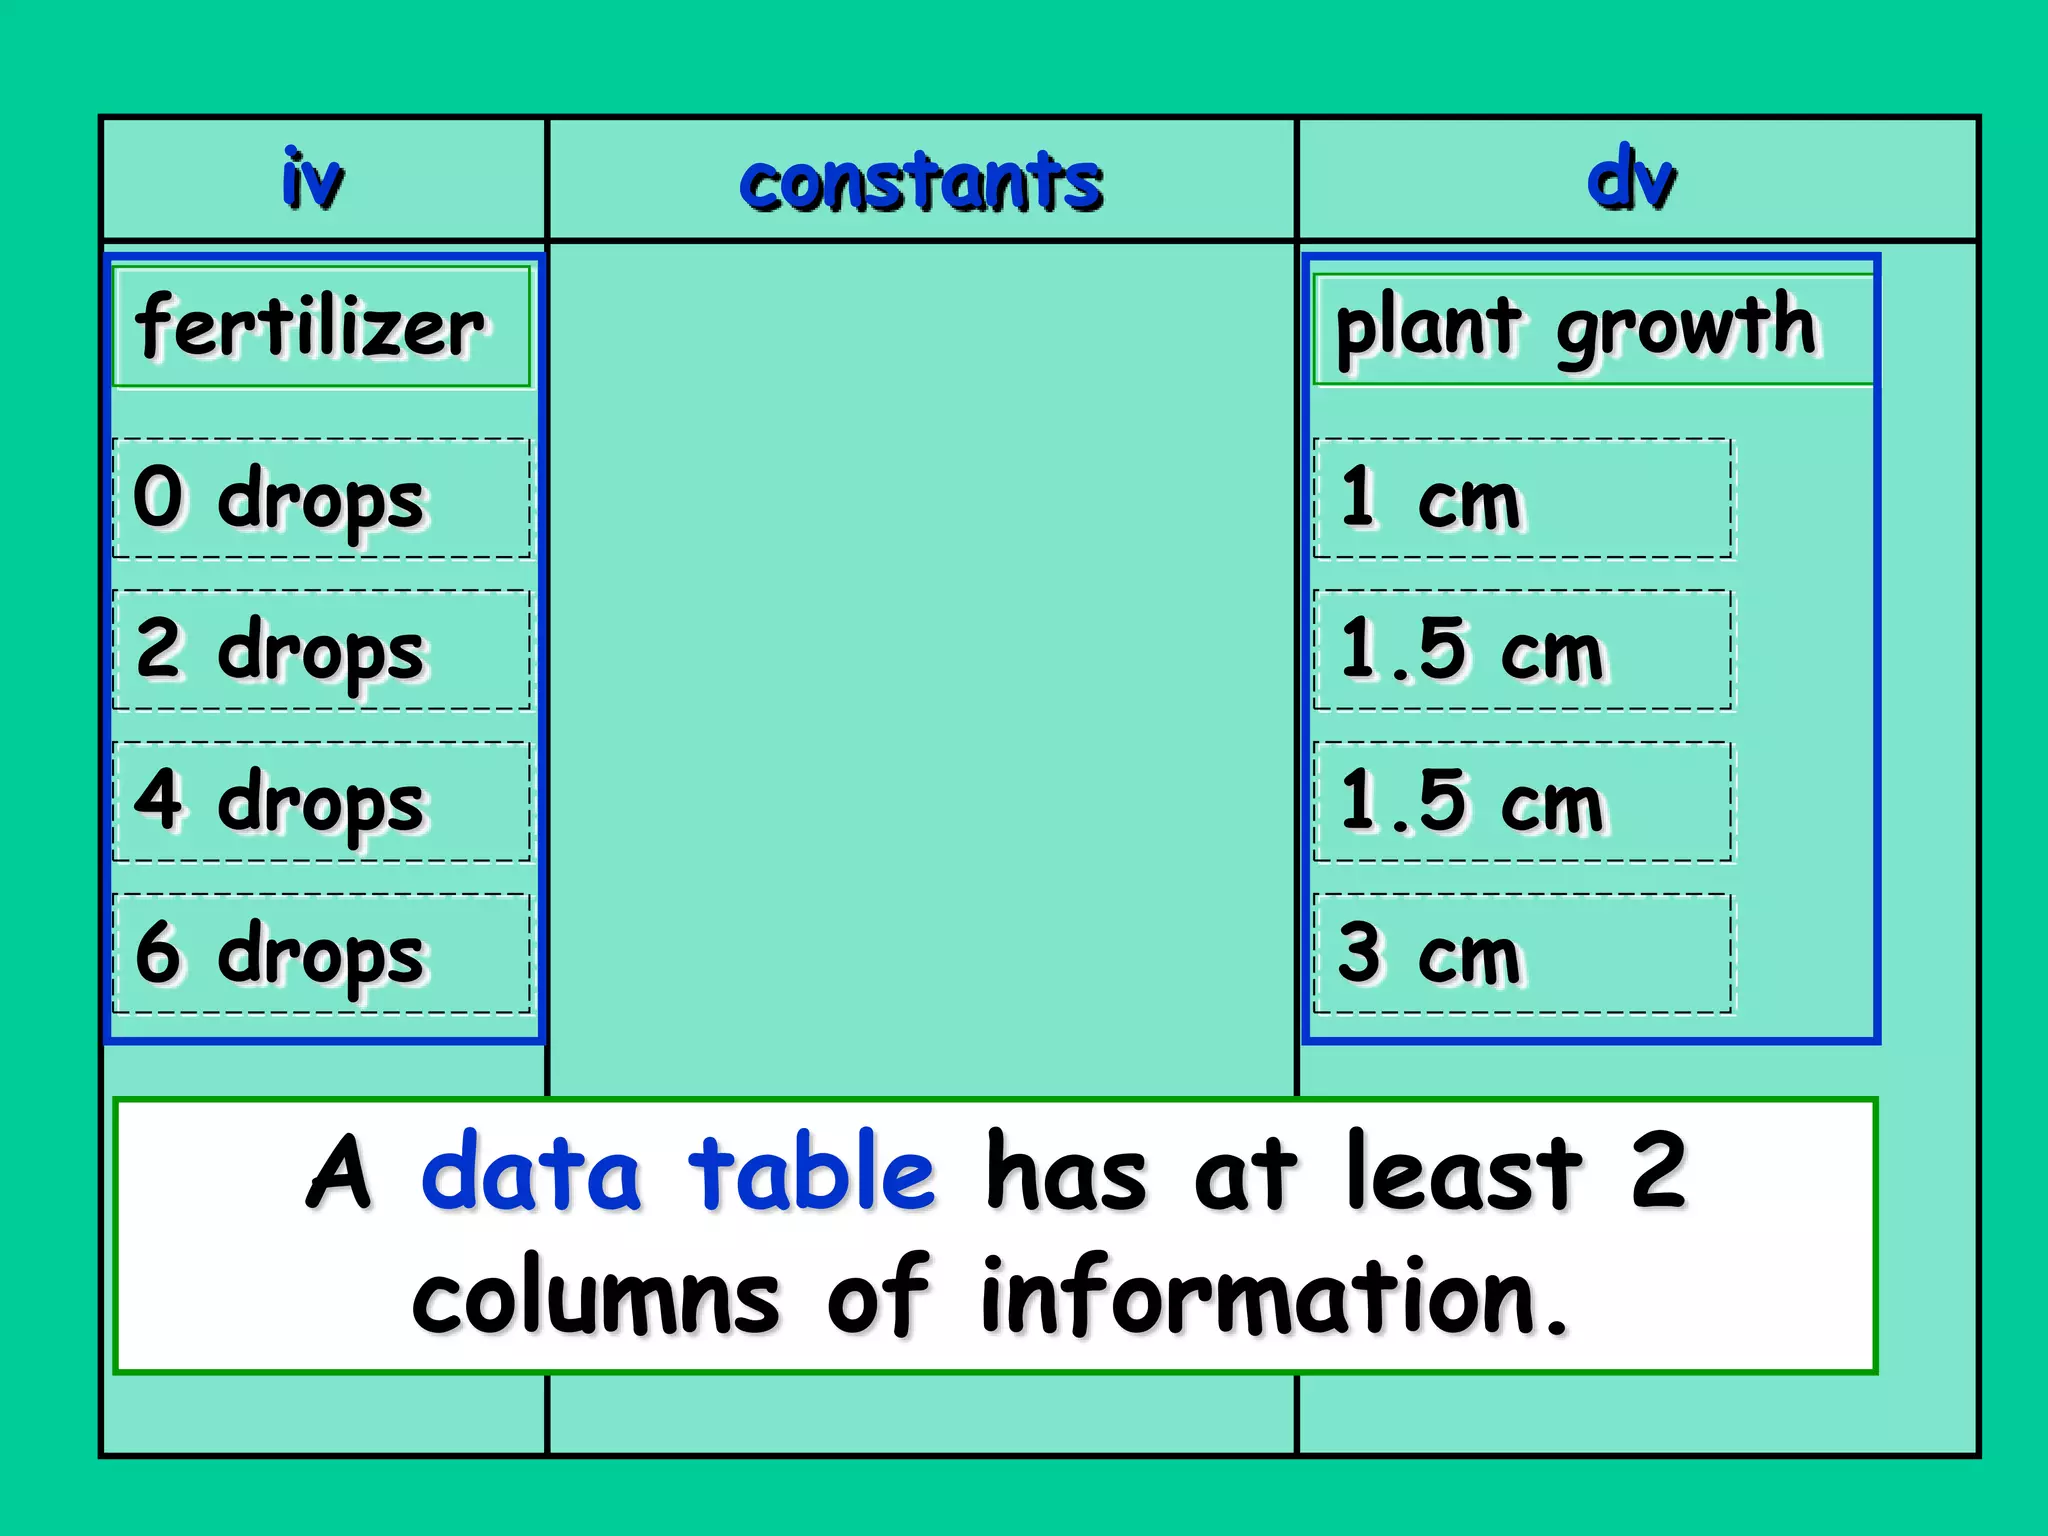

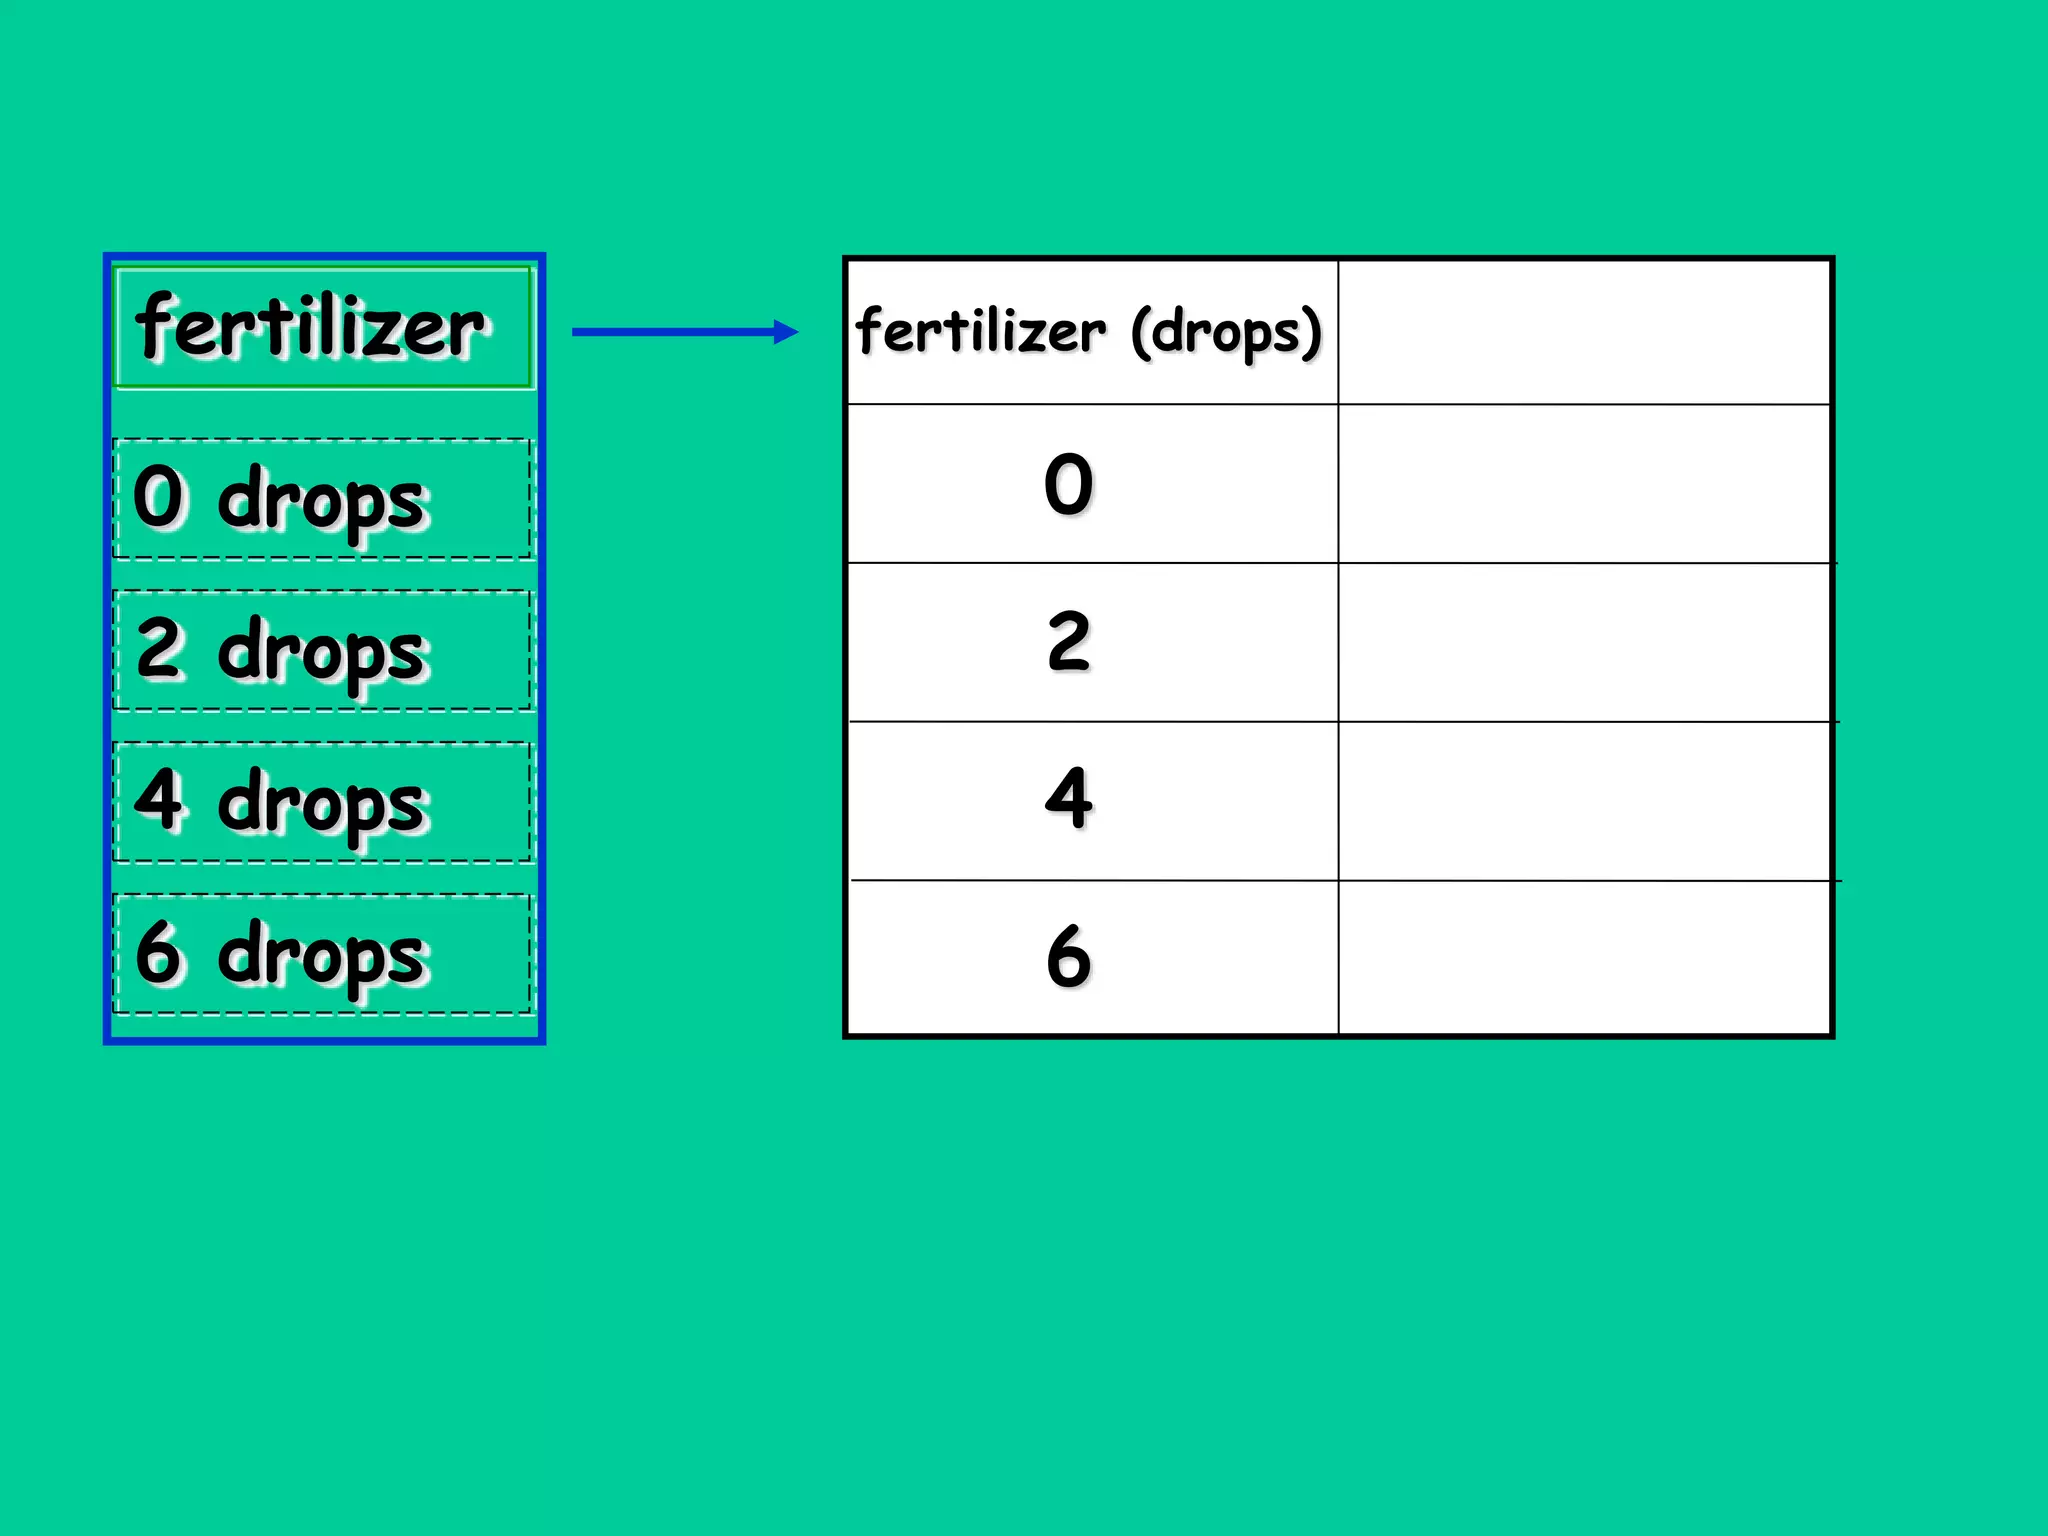


This document discusses the key components of designing an experiment, including the independent variable, dependent variable, constants, control group, experimental group, and repeated trials. It provides definitions and explanations of each component. It also discusses how to form a hypothesis, record and display data in a table and graph, and choose an appropriate title.