Downloaded 59 times


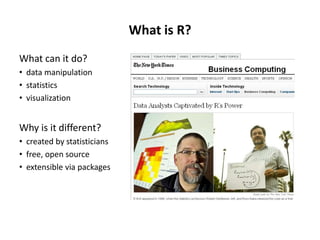
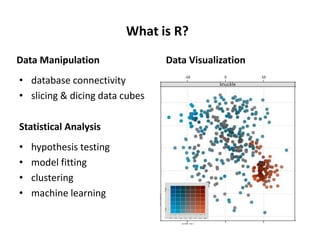

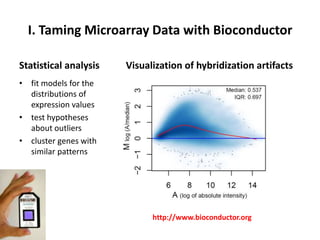
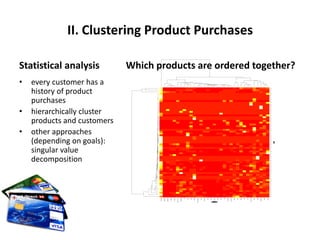

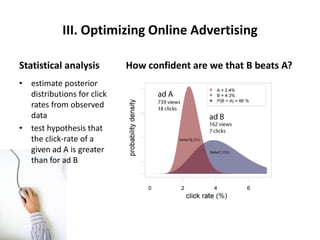

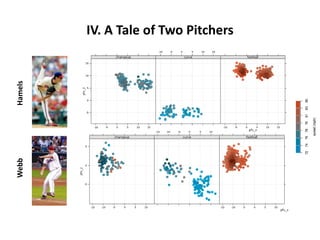

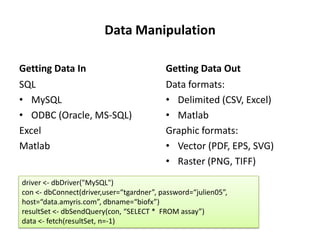
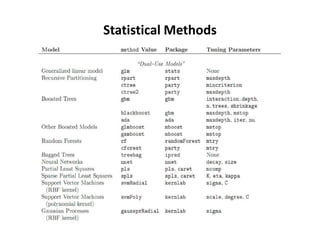
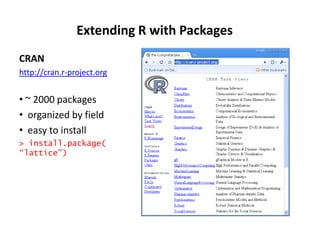
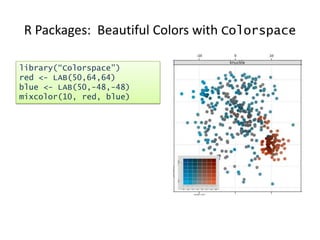
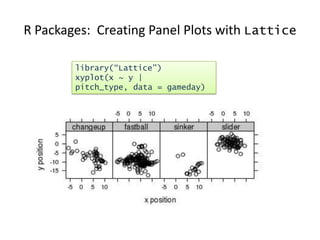


This document discusses using the R programming language for visualizing and analyzing big data. R is a free and open-source language created by statisticians for data manipulation, statistical analysis, and visualization. It allows users to import and export different data types, connect to databases, perform statistical tests and modeling, and visualize results. R has over 2000 add-on packages that extend its functionality for tasks like machine learning, bioinformatics, and creating dashboards. The document provides examples of using R for clustering product purchases, optimizing online advertising, and analyzing baseball player statistics. It also covers getting started with R and where to find help and documentation.