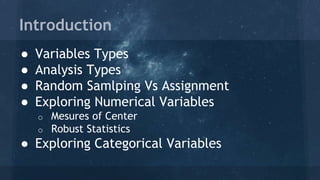
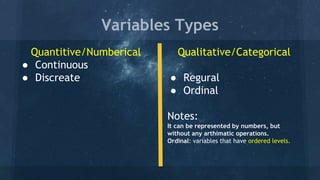
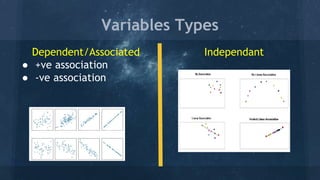
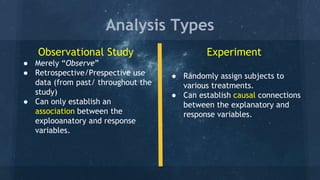
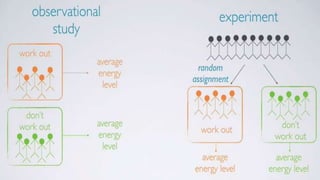
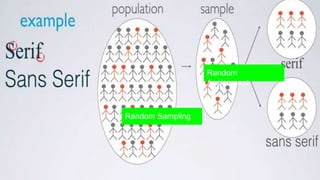
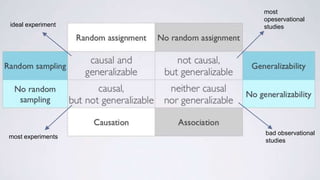
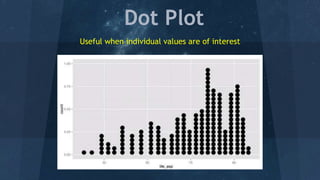
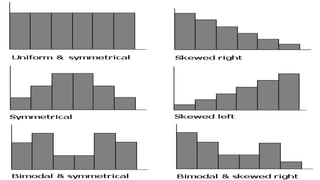
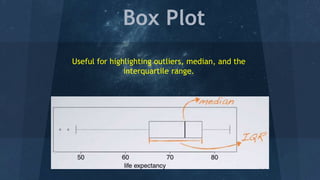
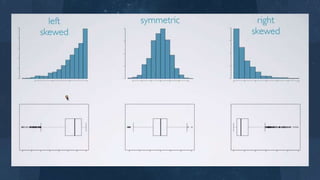
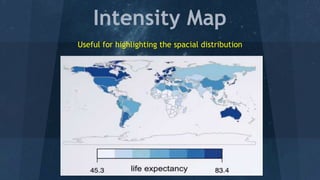
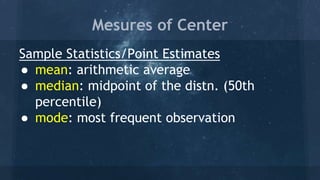
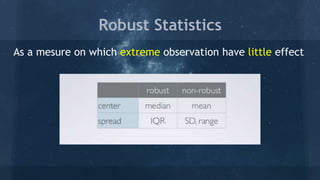
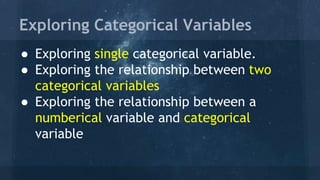
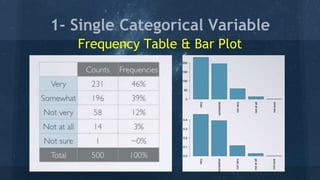
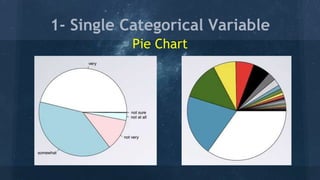
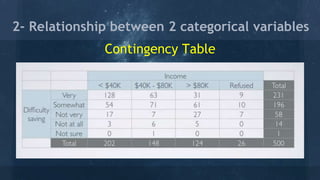
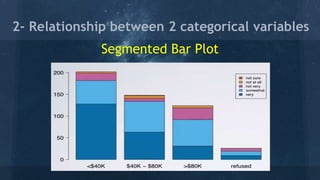
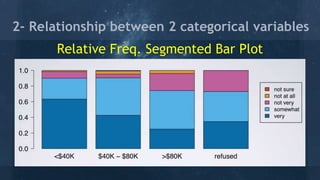
Data Analysis
Spotlights - I
M.Elkharashy
Introduction
● Variables Types
● Analysis Types
● Random Samlping Vs Assignment
● Exploring Numerical Variables
o Mesures of Center
o Robust Statistics
● Exploring Categorical Variables
Variables Types
Quantitive/Numberical
● Continuous
● Discreate
Qualitative/Categorical
● Regural
● Ordinal
Notes:
It can be represented by numbers, but
without any arthimatic operations.
Ordinal: variables that have ordered levels.
Variables Types
Dependent/Associated
● +ve association
● -ve association
Independant
Analysis Types
Observational Study
● Merely “Observe”
● Retrospective/Prespective use
data (from past/ throughout the
study)
● Can only establish an
association between the
explooanatory and response
variables.
Experiment
● Randomly assign subjects to
various treatments.
● Can establish causal connections
between the explanatory and
response variables.
Random Sampling
Random
Assignment
ideal experiment
most experiments
most
opeservational
studies
bad observational
studies
Exploring Numerical
Variables
Dot Plot
Useful when individual values are of interest
Histogram
Box Plot
Useful for highlighting outliers, median, and the
interquartile range.
Intensity Map
Useful for highlighting the spacial distribution
Mesures of Center
Mesures of Center
Sample Statistics/Point Estimates
● mean: arithmetic average
● median: midpoint of the distn. (50th
percentile)
● mode: most frequent observation
Mesures of Center
Skewness Vs Mesures of Center
Robust Statistics
Robust Statistics
As a mesure on which extreme observation have little effect
Robust Statistics
As a mesure on which extreme observation have little effect
Exploring Categorical
Variables
Exploring Categorical Variables
● Exploring single categorical variable.
● Exploring the relationship between two
categorical variables
● Exploring the relationship between a
numberical variable and categorical
variable
1- Single Categorical Variable
Frequency Table & Bar Plot
1- Single Categorical Variable
Pie Chart
Contingency Table
2- Relationship between 2 categorical variables
Segmented Bar Plot
2- Relationship between 2 categorical variables
Relative Freq. Segmented Bar Plot
2- Relationship between 2 categorical variables
Mosaicplot
2- Relationship between 2 categorical variables
Side-by-Side Box Plots
3- Rel. bet. numberical & categorical variables
● Disjoint events Vs independent process
● Conditional probability & probability trees
● Normal distribution
● Binomial distribution
● Centeral Limit Theorem (CLT)
● Confidence Interval
● Introductoin to Inference
In Next Session
● Another introduction to inference
● Hypothesis testing(for mean)
o p-value
o test statistics (Z & T)
o ANOVA
● Hypothesis testing(for proportion)
o Chi-Square (GOF & Independence Test)
● Frequentist Vs Bayesian Inference
● Linear Regression
In 3rd Session
Questions?

Data analysis spotlights # 1