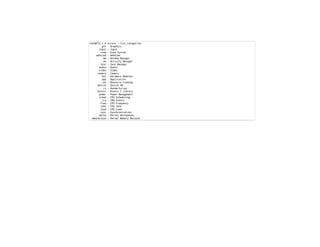
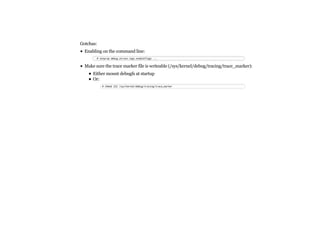
The document details a course on Android debugging and performance analysis, covering tools, techniques, and the internal workings of Android and its underlying Linux architecture. It outlines high-level and specific goals for participants, prerequisites for attending, key topics to be discussed, and provides an overview of available tools for debugging and performance monitoring. Additionally, it includes hands-on exercises and resources for further learning.


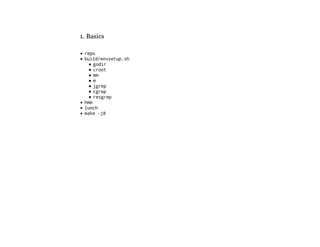
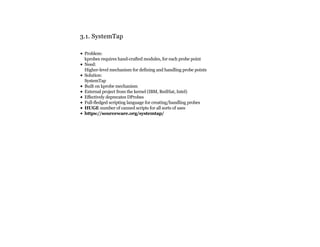
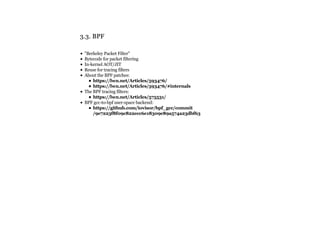
![Create AOSP project files for Studio:
Sometimes you also need to fix an issue with "res.java":
[aosp]$ make idegen && development/tools/idegen/idegen.sh
[aosp]$ cd out/target/product/generic/obj/GYP/shared_intermediates
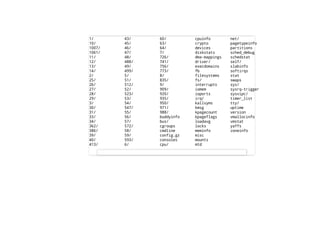
[aosp]$ mv res.java res.j && croot](https://image.slidesharecdn.com/androiddebugslides-240510062044-81847d47/85/Android-memory-analysis-Debug-slides-pdf-26-320.jpg)
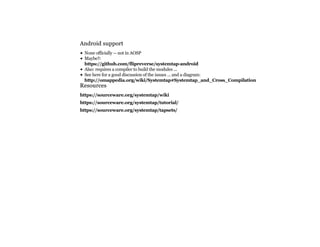
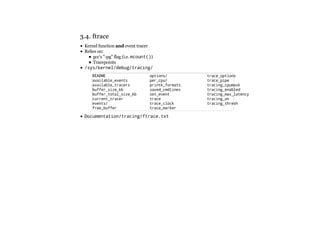
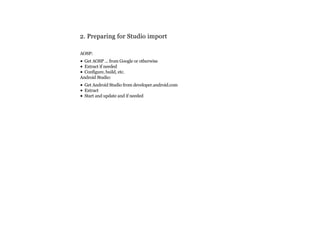
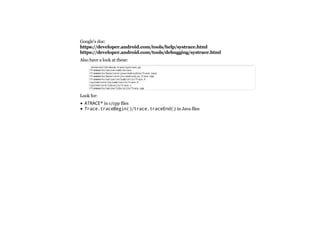
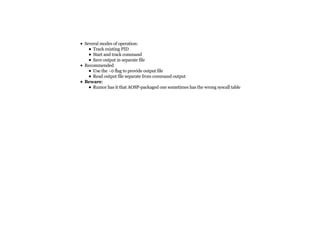
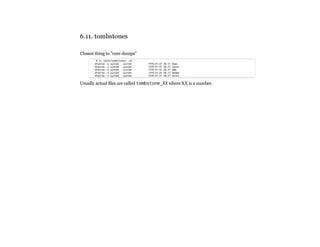
![Check the content of a trace:
# cat trace
# tracer: function
#
# entries-in-buffer/entries-written: 60028/3128571 #P:1
#
# _-----=> irqs-off
# / _----=> need-resched
# | / _---=> hardirq/softirq
# || / _--=> preempt-depth
# ||| / delay
# TASK-PID CPU# |||| TIMESTAMP FUNCTION
# | | | |||| | |
adbd-55 [000] .... 1075.680000: __schedule <-schedule
adbd-55 [000] .... 1075.680000: rcu_sched_qs <-__schedule
adbd-55 [000] d... 1075.680000: deactivate_task <-__schedule
adbd-55 [000] d... 1075.680000: dequeue_task <-deactivate_task
adbd-55 [000] d... 1075.680000: update_rq_clock <-dequeue_task
adbd-55 [000] d... 1075.680000: dequeue_task_fair <-dequeue_task
adbd-55 [000] d... 1075.680000: update_curr <-dequeue_task_fair
adbd-55 [000] d... 1075.680000: clear_buddies <-dequeue_task_fair
adbd-55 [000] d... 1075.680000: account_entity_dequeue <-dequeue_task_fair
...](https://image.slidesharecdn.com/androiddebugslides-240510062044-81847d47/85/Android-memory-analysis-Debug-slides-pdf-61-320.jpg)
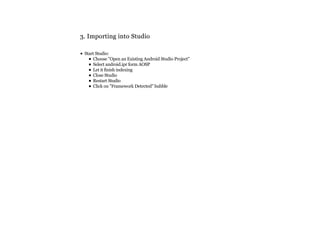
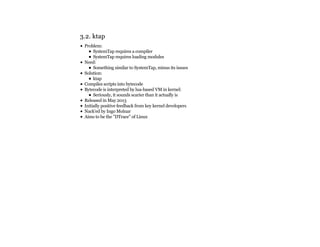
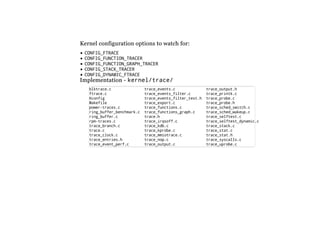
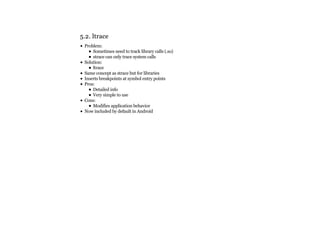
![# atrace --help
usage: atrace [options] [categories...]
options include:
-a appname enable app-level tracing for a comma separated list of cmdlines
-b N use a trace buffer size of N KB
-c trace into a circular buffer
-k fname,... trace the listed kernel functions
-n ignore signals
-s N sleep for N seconds before tracing [default 0]
-t N trace for N seconds [defualt 5]
-z compress the trace dump
--async_start start circular trace and return immediatly
--async_dump dump the current contents of circular trace buffer
--async_stop stop tracing and dump the current contents of circular
trace buffer
--list_categories
list the available tracing categories](https://image.slidesharecdn.com/androiddebugslides-240510062044-81847d47/85/Android-memory-analysis-Debug-slides-pdf-66-320.jpg)
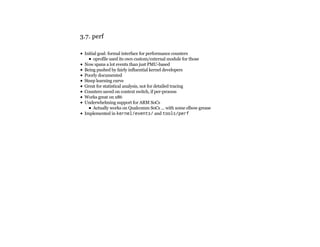
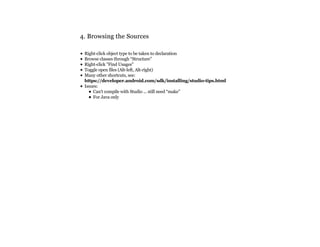
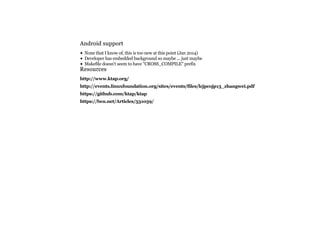
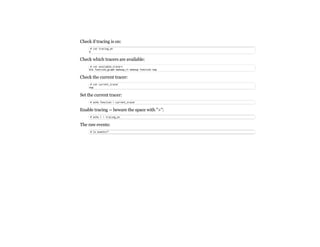
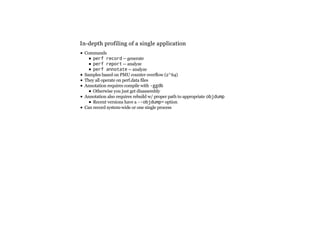
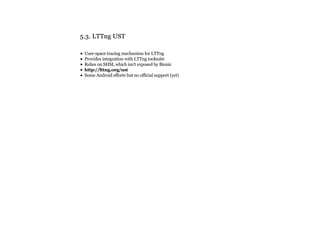
![# perf
usage: perf [--version] [--help] COMMAND [ARGS]
The most commonly used perf commands are:
annotate Read perf.data (created by perf record) and display annotated code
archive Create archive with object files with build-ids found in perf.data file
bench General framework for benchmark suites
buildid-cache Manage build-id cache.
buildid-list List the buildids in a perf.data file
diff Read two perf.data files and display the differential profile
evlist List the event names in a perf.data file
inject Filter to augment the events stream with additional information
kmem Tool to trace/measure kernel memory(slab) properties
kvm Tool to trace/measure kvm guest os
list List all symbolic event types
lock Analyze lock events
probe Define new dynamic tracepoints
record Run a command and record its profile into perf.data
report Read perf.data (created by perf record) and display the profile
sched Tool to trace/measure scheduler properties (latencies)
script Read perf.data (created by perf record) and display trace output
stat Run a command and gather performance counter statistics
test Runs sanity tests.
timechart Tool to visualize total system behavior during a workload
top System profiling tool.
See 'perf help COMMAND' for more information on a specific command.](https://image.slidesharecdn.com/androiddebugslides-240510062044-81847d47/85/Android-memory-analysis-Debug-slides-pdf-79-320.jpg)
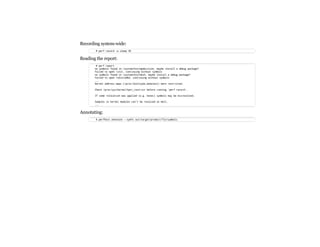
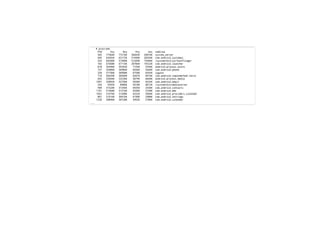
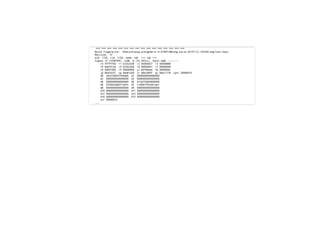
![Get basic stats:
# perf stat -a sleep 5
Performance counter stats for 'sleep 5':
5014.375095 task-clock # 1.000 CPUs utilized
371 context-switches # 0.000 M/sec
0 CPU-migrations # 0.000 M/sec
270 page-faults # 0.000 M/sec
49315140 cycles # 0.010 GHz [80.45%]
0 stalled-cycles-frontend # 0.00% frontend cycles idle [78.46%]
0 stalled-cycles-backend # 0.00% backend cycles idle [96.02%]
16766094 instructions # 0.34 insns per cycle [72.67%]
1826454 branches # 0.364 M/sec [76.27%]
158411 branch-misses # 8.67% of all branches [76.58%]
5.013001679 seconds time elapsed](https://image.slidesharecdn.com/androiddebugslides-240510062044-81847d47/85/Android-memory-analysis-Debug-slides-pdf-80-320.jpg)
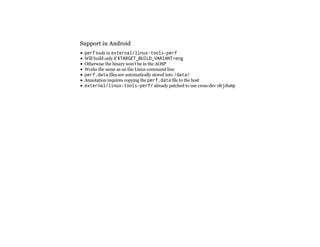
![Monitor what functions are using the CPU:
PerfTop: 935 irqs/sec kernel:91.6% exact: 0.0% [1000Hz cycles], (all, 1 CPU)
-------------------------------------------------------------------------------
samples pcnt function DSO
_______ _____ ______________________ _____________________
13.00 34.2% dvmAsmInstructionStart /system/lib/libdvm.so
6.00 15.8% strcmp /system/lib/libc.so
6.00 15.8% __vfprintf /system/lib/libc.so
6.00 15.8% dlmalloc /system/lib/libc.so
5.00 13.2% dvmJitToInterpNoChain /system/lib/libdvm.so
...](https://image.slidesharecdn.com/androiddebugslides-240510062044-81847d47/85/Android-memory-analysis-Debug-slides-pdf-81-320.jpg)
![See the events it can monitor:
# perf list
List of pre-defined events (to be used in -e):
cpu-cycles OR cycles [Hardware event]
stalled-cycles-frontend OR idle-cycles-frontend [Hardware event]
stalled-cycles-backend OR idle-cycles-backend [Hardware event]
instructions [Hardware event]
cache-references [Hardware event]
cache-misses [Hardware event]
branch-instructions OR branches [Hardware event]
branch-misses [Hardware event]
bus-cycles [Hardware event]
cpu-clock [Software event]
task-clock [Software event]
page-faults OR faults [Software event]
minor-faults [Software event]
major-faults [Software event]
context-switches OR cs [Software event]
cpu-migrations OR migrations [Software event]
alignment-faults [Software event]
emulation-faults [Software event]](https://image.slidesharecdn.com/androiddebugslides-240510062044-81847d47/85/Android-memory-analysis-Debug-slides-pdf-82-320.jpg)
![continued:
L1-dcache-loads [Hardware cache event]
L1-dcache-load-misses [Hardware cache event]
L1-dcache-stores [Hardware cache event]
L1-dcache-store-misses [Hardware cache event]
L1-dcache-prefetches [Hardware cache event]
L1-dcache-prefetch-misses [Hardware cache event]
L1-icache-loads [Hardware cache event]
L1-icache-load-misses [Hardware cache event]
L1-icache-prefetches [Hardware cache event]
L1-icache-prefetch-misses [Hardware cache event]
LLC-loads [Hardware cache event]
LLC-load-misses [Hardware cache event]
LLC-stores [Hardware cache event]
LLC-store-misses [Hardware cache event]
LLC-prefetches [Hardware cache event]
LLC-prefetch-misses [Hardware cache event]
dTLB-loads [Hardware cache event]
dTLB-load-misses [Hardware cache event]
dTLB-stores [Hardware cache event]
dTLB-store-misses [Hardware cache event]
dTLB-prefetches [Hardware cache event]
dTLB-prefetch-misses [Hardware cache event]](https://image.slidesharecdn.com/androiddebugslides-240510062044-81847d47/85/Android-memory-analysis-Debug-slides-pdf-83-320.jpg)
![continued:
All tracepoint events can be monitored by perf
iTLB-loads [Hardware cache event]
iTLB-load-misses [Hardware cache event]
branch-loads [Hardware cache event]
branch-load-misses [Hardware cache event]
rNNN (see 'perf list --help' on how to encode it) [Raw hardware event descriptor]
mem:<addr>[:access] [Hardware breakpoint]
sunrpc:rpc_call_status [Tracepoint event]
sunrpc:rpc_bind_status [Tracepoint event]
sunrpc:rpc_connect_status [Tracepoint event]
...
sched:sched_wakeup_new [Tracepoint event]
sched:sched_switch [Tracepoint event]
sched:sched_migrate_task [Tracepoint event]
sched:sched_process_free [Tracepoint event]
...
irq:irq_handler_entry [Tracepoint event]
irq:irq_handler_exit [Tracepoint event]
...](https://image.slidesharecdn.com/androiddebugslides-240510062044-81847d47/85/Android-memory-analysis-Debug-slides-pdf-84-320.jpg)
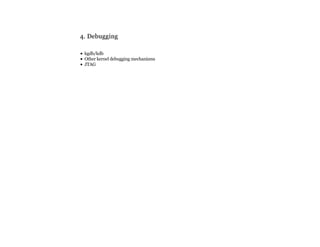
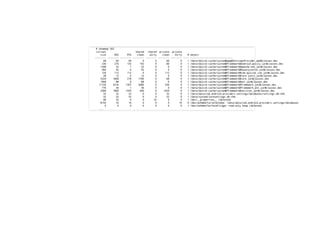
![# Events: 15K cycles
#
# Overhead Command Shared Object ... Symbol
# ........ ............... ............................... ....................................
#
61.17% adbd [unknown] [k] 0xc07c5cd4
5.19% adbd dumpsys [.] 0x1b8f8
4.52% perf [unknown] [k] 0xc07c3fe0
3.46% swapper [unknown] [k] 0xc07c5d0c
2.71% logcat [unknown] [k] 0xc029b0d0
2.57% kworker/0:0 [unknown] [k] 0xc07c5cd4
1.76% mpdecision [unknown] [k] 0xc029a77c
1.53% system_server dumpsys [.] 0x3c18c
1.39% system_server [unknown] [k] 0xc0087710
0.63% ls [unknown] [k] 0xc0008578
0.51% perf dumpsys [.] 0x25fc8
0.41% ndroid.launcher dumpsys [.] _Z17dvmHeapBitmapWalkPK10HeapBitmapPFvP6ObjectPvES4_
0.39% d.process.media dumpsys [.] 0x39c18
0.39% system_server dumpsys [.] 0x81740
0.37% system_server dumpsys [.] 0x5226
0.36% logcat dumpsys [.] 0x18f4
0.36% system_server dumpsys [.] dvmAsmInstructionStart
0.32% ps [unknown] [k] 0xc07c7940
0.28% perf dumpsys [.] dlfree
0.27% ndroid.launcher [unknown] [k] 0xc07c58d4
0.27% perf dumpsys [.] memcpy
...](https://image.slidesharecdn.com/androiddebugslides-240510062044-81847d47/85/Android-memory-analysis-Debug-slides-pdf-87-320.jpg)

![# strace -o data/logcat.strace logcat
...
# cat data/logcat.strace
execve("/system/bin/logcat", ["logcat"], [/* 14 vars */]) = 0
mprotect(0x4000f000, 4096, PROT_READ) = 0
open("/dev/null", O_RDWR) = 3
fcntl64(0, F_GETFL) = 0x2 (flags O_RDWR)
fcntl64(1, F_GETFL) = 0x2 (flags O_RDWR)
fcntl64(2, F_GETFL) = 0x2 (flags O_RDWR)
close(3) = 0
gettid() = 798
set_tls(0x40010efc, 0x40010efc, 0, 0xffffffbc, 0x40010ffc) = 0
sigaction(SIGILL, {0x40000a41, [], SA_RESTART|SA_SIGINFO}, NULL, 0x2a04b038) = 0
sigaction(SIGABRT, {0x40000a41, [], SA_RESTART|SA_SIGINFO}, NULL, 0x2a04b038) = 0
sigaction(SIGBUS, {0x40000a41, [], SA_RESTART|SA_SIGINFO}, NULL, 0x2a04b038) = 0
sigaction(SIGFPE, {0x40000a41, [], SA_RESTART|SA_SIGINFO}, NULL, 0x2a04b038) = 0
sigaction(SIGSEGV, {0x40000a41, [], SA_RESTART|SA_SIGINFO}, NULL, 0x2a04b038) = 0
sigaction(SIGSTKFLT, {0x40000a41, [], SA_RESTART|SA_SIGINFO}, NULL, 0x2a04b038) = 0
sigaction(SIGPIPE, {0x40000a41, [], SA_RESTART|SA_SIGINFO}, NULL, 0x2a04b038) = 0
mmap2(NULL, 4092, PROT_READ|PROT_WRITE, MAP_PRIVATE|MAP_ANONYMOUS, 0, 0) = 0x40012000
open("/vendor/lib/liblog.so", O_RDONLY) = -1 ENOENT (No such file or directory)
open("/system/lib/liblog.so", O_RDONLY) = 3
...](https://image.slidesharecdn.com/androiddebugslides-240510062044-81847d47/85/Android-memory-analysis-Debug-slides-pdf-97-320.jpg)

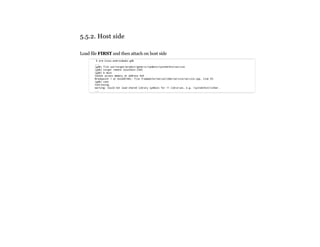
![5.5.1. Target side
5.5.1. Target side
AOSP already takes care of debug:
"-g" flag added to all native binaries
Unstripped binaries in out/target/product/[PRODUCT_NAME]/symbols/...
Two ways to operate gdbserver:
Start app for debugging with gdbserver prepended
Attaching to running process
Either way, need to forward the port on the host:
# gdbserver localhost:2345 service list
# gdbserver --attach locahost:2345 30
$ adb forward tcp:2345 tcp:2345](https://image.slidesharecdn.com/androiddebugslides-240510062044-81847d47/85/Android-memory-analysis-Debug-slides-pdf-103-320.jpg)
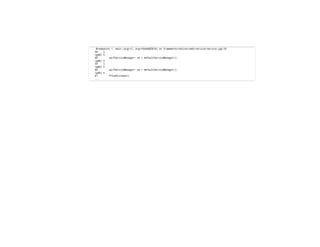
![Can also attach to system services' JNI code -- attach FIRST
$ arm-linux-androideabi-gdb
...
(gdb) target remote localhost:2345
(gdb) file out/target/product/msm8960/symbols/system/bin/app_process
(gdb) set solib-absolute-prefix out/target/product/msm8960/symbols/
(gdb) set solib-search-path out/target/product/msm8960/symbols/system/lib/
(gdb) b com_android_server_OpersysService.cpp:70
(gdb) cont
Continuing.
-----------------------------
root@android:/ # service call opersys 2 s16 adfasd
-----------------------------
[New Thread 576]
[Switching to Thread 576]
Breakpoint 1, write_native (env=0x5c94ad40, clazz=,
ptr=, buffer=0xa4f00005)
at frameworks/base/services/jni/com_android_server_OpersysService.cpp:72
72 if (dev == NULL) {
(gdb)](https://image.slidesharecdn.com/androiddebugslides-240510062044-81847d47/85/Android-memory-analysis-Debug-slides-pdf-106-320.jpg)
![5.5.3. Using 'gdbclient'
5.5.3. Using 'gdbclient'
$ pid system_server
1653
$ gdbclient app_process32 :5039 1653
[1] 13531
Attached; pid = 1653
Listening on port 5039
GNU gdb (GDB) 7.6
...
Reading symbols from /media/6921e18a-5b32-4fe8-97cc-62a85a6f351f/home/karim/opersys-dev/android/aosp-5.0.2_r1-pristine/out/target/product/flo/symbols/system/bin/app_
Remote debugging from host 127.0.0.1
warning: while parsing target library list: not well-formed (invalid token)
warning: Could not load shared library symbols for 29 libraries, e.g. 'U.
Use the "info sharedlibrary" command to see the complete listing.
Do you need "set solib-search-path" or "set sysroot"?
readv () at bionic/libc/arch-arm/syscalls/readv.S:12
12 neg r0, r0
Function "art_sigsegv_fault" not defined.
Breakpoint 1 (art_sigsegv_fault) pending.
ART debugging mode is enabled.
If you are debugging a native only process, you need to
re-enable normal SIGSEGV handling using this command:
handle SIGSEGV print stop](https://image.slidesharecdn.com/androiddebugslides-240510062044-81847d47/85/Android-memory-analysis-Debug-slides-pdf-107-320.jpg)
![(gdb) b com_android_server_power_PowerManagerService.cpp:126
Breakpoint 2 at 0xb404f404: file frameworks/base/services/core/jni/com_android_server_power_PowerManagerService.cpp, line 126.
(gdb) cont
Continuing.
[New Thread 30562]
[Switching to Thread 30562]
Breakpoint 2, android::nativeSetInteractive (env=0xaf6c30f0, clazz=0x9eff29ac,
enable=1 '001')
at frameworks/base/services/core/jni/com_android_server_power_PowerManagerService.cpp:126
126 if (gPowerModule) {
(gdb) n](https://image.slidesharecdn.com/androiddebugslides-240510062044-81847d47/85/Android-memory-analysis-Debug-slides-pdf-108-320.jpg)
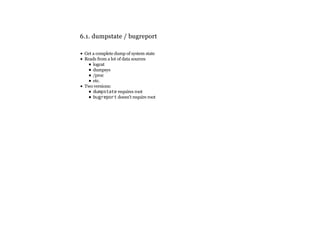
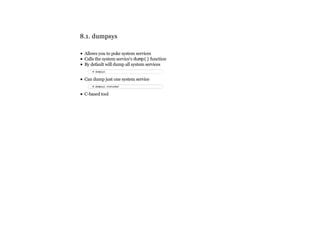
![usage: dumpstate [-b soundfile] [-e soundfile] [-o file [-d] [-p] [-z]] [-s] [-q]
-o: write to file (instead of stdout)
-d: append date to filename (requires -o)
-z: gzip output (requires -o)
-p: capture screenshot to filename.png (requires -o)
-s: write output to control socket (for init)
-b: play sound file instead of vibrate, at beginning of job
-e: play sound file instead of vibrate, at end of job
-q: disable vibrate
-B: send broadcast when finished (requires -o and -p)](https://image.slidesharecdn.com/androiddebugslides-240510062044-81847d47/85/Android-memory-analysis-Debug-slides-pdf-112-320.jpg)
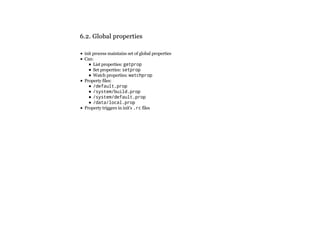
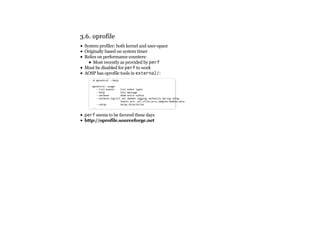
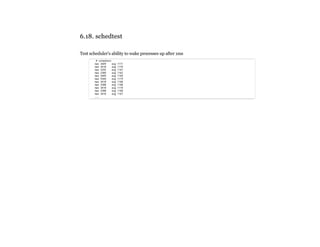
![6.3. schedtop
6.3. schedtop
Similar to plain top
Cumulative execution time of processes
schedtop [-d <delay>] [-bitamun]
-d refresh every <delay> seconds
-b batch - continous prints instead of refresh
-i hide idle tasks
-t show threads
-a use alternate screen
-m use millisecond precision
-u use microsecond precision
-n use nanosecond precision](https://image.slidesharecdn.com/androiddebugslides-240510062044-81847d47/85/Android-memory-analysis-Debug-slides-pdf-114-320.jpg)
![6.4. librank
6.4. librank
Print library memory usage
Usage: librank [ -P | -L ] [ -v | -r | -p | -u | -h ]
Sort options:
-v Sort processes by VSS.
-r Sort processes by RSS.
-p Sort processes by PSS.
-u Sort processes by USS.
(Default sort order is PSS.)
-P /path Limit libraries displayed to those in path.
-R Reverse sort order (default is descending).
-h Display this help screen.](https://image.slidesharecdn.com/androiddebugslides-240510062044-81847d47/85/Android-memory-analysis-Debug-slides-pdf-116-320.jpg)
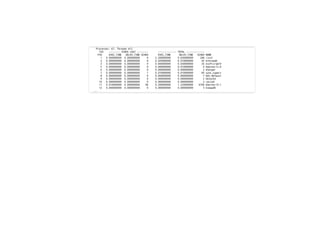
![RSStot VSS RSS PSS USS Name/PID
55386K /dev/ashmem/dalvik-heap
29340K 29340K 23506K 23272K com.android.systemui [645]
13680K 13680K 7753K 7516K com.android.launcher [765]
11240K 11240K 5406K 5172K system_server [565]
7664K 7664K 1628K 1384K com.android.phone [737]
7552K 7552K 1521K 1280K android.process.media [692]
7392K 7392K 1326K 1076K android.process.acore [818]
7228K 7228K 1184K 940K com.android.inputmethod.latin [710]
7108K 7108K 1031K 784K com.android.email [1091]
...
40517K anon_inode:dmabuf
39972K 39972K 25758K 11544K /system/bin/surfaceflinger [253]
16172K 16172K 8142K 132K system_server [565]
11884K 11884K 5944K 4K com.android.launcher [765]
964K 964K 673K 408K com.android.systemui [645]
408K 0K 0K 0K /system/bin/mediaserver [256]
40K 0K 0K 0K /system/bin/qseecomd [341]
19489K /dev/ashmem/dalvik-aux-structure
1480K 1456K 1194K 1184K system_server [565]
1812K 1740K 1116K 1088K com.android.email [1091]
1628K 1552K 1087K 1068K com.android.phone [737]
1824K 1740K 1076K 1044K com.android.contacts [904]
1656K 1572K 1050K 1028K android.process.media [692]
1760K 1684K 982K 944K com.android.settings [801]
...](https://image.slidesharecdn.com/androiddebugslides-240510062044-81847d47/85/Android-memory-analysis-Debug-slides-pdf-117-320.jpg)
![6.5. procmem
6.5. procmem
See PID's memory usage
Usage: procmem [ -w | -W ] [ -p | -m ] [ -h ] pid
-w Displays statistics for the working set only.
-W Resets the working set of the process.
-p Sort by PSS.
-m Sort by mapping order (as read from /proc).
-h Hide maps with no RSS.](https://image.slidesharecdn.com/androiddebugslides-240510062044-81847d47/85/Android-memory-analysis-Debug-slides-pdf-118-320.jpg)
![6.6. procrank
6.6. procrank
See processes' memory usage, in order
Usage: procrank [ -W ] [ -v | -r | -p | -u | -h ]
-v Sort by VSS.
-r Sort by RSS.
-p Sort by PSS.
-u Sort by USS.
(Default sort order is PSS.)
-R Reverse sort order (default is descending).
-w Display statistics for working set only.
-W Reset working set of all processes.
-h Display this help screen.](https://image.slidesharecdn.com/androiddebugslides-240510062044-81847d47/85/Android-memory-analysis-Debug-slides-pdf-120-320.jpg)
![6.7. showmap
6.7. showmap
See objects mapped to process' address space
showmap [-t] [-v] [-c] <pid>
-t = terse (show only items with private pages)
-v = verbose (don't coalesce maps with the same name)
-a = addresses (show virtual memory map)](https://image.slidesharecdn.com/androiddebugslides-240510062044-81847d47/85/Android-memory-analysis-Debug-slides-pdf-122-320.jpg)
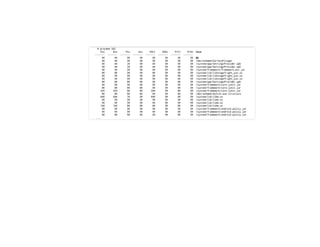
![Usage: logcat [options] [filterspecs]
options include:
-s Set default filter to silent.
Like specifying filterspec '*:s'
-f <filename> Log to file. Default to stdout
-r [<kbytes>] Rotate log every kbytes. (16 if unspecified). Requires -f
-n <count> Sets max number of rotated logs to <count>, default 4
-v <format> Sets the log print format, where <format> is one of:
brief process tag thread raw time threadtime long
-c clear (flush) the entire log and exit
-d dump the log and then exit (don't block)
-t <count> print only the most recent <count> lines (implies -d)
-g get the size of the log's ring buffer and exit
-b <buffer> Request alternate ring buffer, 'main', 'system', 'radio'
or 'events'. Multiple -b parameters are allowed and the
results are interleaved. The default is -b main -b system.
-B output the log in binary
...](https://image.slidesharecdn.com/androiddebugslides-240510062044-81847d47/85/Android-memory-analysis-Debug-slides-pdf-126-320.jpg)
![# log
USAGE: log [-p priorityChar] [-t tag] message
priorityChar should be one of:
v,d,i,w,e](https://image.slidesharecdn.com/androiddebugslides-240510062044-81847d47/85/Android-memory-analysis-Debug-slides-pdf-128-320.jpg)
![6.14. ioctl
6.14. ioctl
Send ioctl() calls to device driver
ioctl [-l <length>] [-a <argsize>] [-rdh] <device> <ioctlnr>
-l <lenght> Length of io buffer
-a <argsize> Size of each argument (1-8)
-r Open device in read only mode
-d Direct argument (no iobuffer)
-h Print help](https://image.slidesharecdn.com/androiddebugslides-240510062044-81847d47/85/Android-memory-analysis-Debug-slides-pdf-135-320.jpg)
![6.16. notify
6.16. notify
Monitor path using inotify kernel functionality (man inotify)
Usage: notify [-m eventmask] [-c count] [-p] [-v verbosity] path [path ...]](https://image.slidesharecdn.com/androiddebugslides-240510062044-81847d47/85/Android-memory-analysis-Debug-slides-pdf-137-320.jpg)
![6.17. run-as
6.17. run-as
Run a command under a given package's user ID
Usage: run-as <package-name> <command> [<args>]](https://image.slidesharecdn.com/androiddebugslides-240510062044-81847d47/85/Android-memory-analysis-Debug-slides-pdf-138-320.jpg)
![7.1. dalvikvm
7.1. dalvikvm
Raw Dalvik VM
Can't run Android code
Seldom used
# dalvikvm -help
dalvikvm: [options] class [argument ...]
dalvikvm: [options] -jar file.jar [argument ...]
The following standard options are recognized:
-classpath classpath
-Dproperty=value
-verbose:tag ('gc', 'jni', or 'class')
-ea[:<package name>... |:<class name>]
-da[:<package name>... |:<class name>]
(-enableassertions, -disableassertions)
-esa
-dsa
(-enablesystemassertions, -disablesystemassertions)
-showversion
-help
...](https://image.slidesharecdn.com/androiddebugslides-240510062044-81847d47/85/Android-memory-analysis-Debug-slides-pdf-142-320.jpg)
![7.2. dvz
7.2. dvz
Requests Zygote to start a specific class
Not built by default
Seldom used
# <userinput>dvz --help</userinput>
Usage: dvz [--help] [-classpath <classpath>]
[additional zygote args] fully.qualified.java.ClassName [args]
Requests a new Dalvik VM instance to be spawned from the zygote
process. stdin, stdout, and stderr are hooked up. This process remains
while the spawned VM instance is alive and forwards some signals.
The exit code of the spawned VM instance is dropped.](https://image.slidesharecdn.com/androiddebugslides-240510062044-81847d47/85/Android-memory-analysis-Debug-slides-pdf-143-320.jpg)

![7.5. dexdump
7.5. dexdump
Dex file disassembler
dexdump: [-c] [-d] [-f] [-h] [-i] [-l layout] [-m] [-t tempfile] dexfile...
-c : verify checksum and exit
-d : disassemble code sections
-f : display summary information from file header
-h : display file header details
-i : ignore checksum failures
-l : output layout, either 'plain' or 'xml'
-m : dump register maps (and nothing else)
-t : temp file name (defaults to /sdcard/dex-temp-*)](https://image.slidesharecdn.com/androiddebugslides-240510062044-81847d47/85/Android-memory-analysis-Debug-slides-pdf-147-320.jpg)
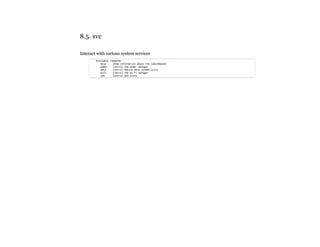
![8.2. service
8.2. service
Interact with system services
See system service's aidl file to get "CODE" and parameter list
C-based tool
Usage: service [-h|-?]
service list
service check SERVICE
service call SERVICE CODE [i32 INT | s16 STR] ...
Options:
i32: Write the integer INT into the send parcel.
s16: Write the UTF-16 string STR into the send parcel.](https://image.slidesharecdn.com/androiddebugslides-240510062044-81847d47/85/Android-memory-analysis-Debug-slides-pdf-160-320.jpg)
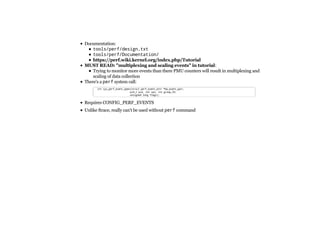
![8.3. am
8.3. am
Interact with the activity manager
Allows you to send intents on the command line (very powerful)
# am
usage: am [subcommand] [options]
usage: am start [-D] [-W] [-P <FILE>] [--start-profiler <FILE>]
[--R COUNT] [-S] [--opengl-trace] <INTENT>
am startservice <INTENT>
am force-stop <PACKAGE>
am kill <PACKAGE>
am kill-all
am broadcast <INTENT>
am instrument [-r] [-e <NAME> <VALUE>] [-p <FILE>] [-w]
[--no-window-animation] <COMPONENT>
am profile start <PROCESS> <FILE>
am profile stop [<PROCESS>]
am dumpheap [flags] <PROCESS> <FILE>
...](https://image.slidesharecdn.com/androiddebugslides-240510062044-81847d47/85/Android-memory-analysis-Debug-slides-pdf-161-320.jpg)
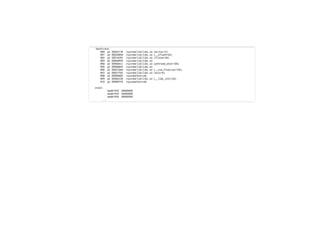
![8.4. pm
8.4. pm
Interact with package manager
usage: pm list packages [-f] [-d] [-e] [-s] [-3] [-i] [-u] [FILTER]
pm list permission-groups
pm list permissions [-g] [-f] [-d] [-u] [GROUP]
pm list instrumentation [-f] [TARGET-PACKAGE]
pm list features
pm list libraries
pm path PACKAGE
pm install [-l] [-r] [-t] [-i INSTALLER_PACKAGE_NAME] [-s] [-f]
[--algo <algorithm name> --key <key-in-hex> --iv <IV-in-hex>] PATH
pm uninstall [-k] PACKAGE
pm clear PACKAGE
pm enable PACKAGE_OR_COMPONENT](https://image.slidesharecdn.com/androiddebugslides-240510062044-81847d47/85/Android-memory-analysis-Debug-slides-pdf-162-320.jpg)
![8.6. monkey
8.6. monkey
Interact with UI
Can take scripts
usage: monkey [-p ALLOWED_PACKAGE [-p ALLOWED_PACKAGE] ...]
[-c MAIN_CATEGORY [-c MAIN_CATEGORY] ...]
[--ignore-crashes] [--ignore-timeouts]
[--ignore-security-exceptions]
[--monitor-native-crashes] [--ignore-native-crashes]
[--kill-process-after-error] [--hprof]
[--pct-touch PERCENT] [--pct-motion PERCENT]
[--pct-trackball PERCENT] [--pct-syskeys PERCENT]
[--pct-nav PERCENT] [--pct-majornav PERCENT]
[--pct-appswitch PERCENT] [--pct-flip PERCENT]
[--pct-anyevent PERCENT] [--pct-pinchzoom PERCENT]
[--pkg-blacklist-file PACKAGE_BLACKLIST_FILE]](https://image.slidesharecdn.com/androiddebugslides-240510062044-81847d47/85/Android-memory-analysis-Debug-slides-pdf-164-320.jpg)