Download to read offline


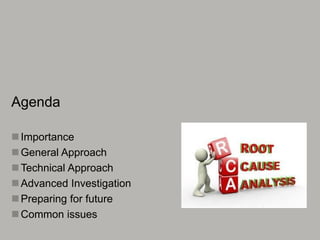
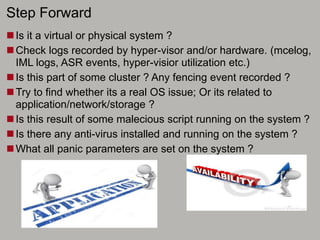
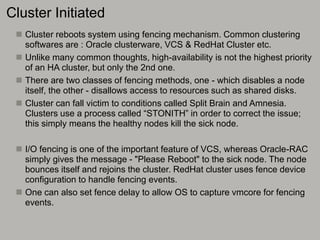
![Panic Parameters
These are used to deliberately panic system, when certain
conditions are met. It is necessary for debugging purpose
• 1) kernel.hung_task_panic
• 2) kernel.softlockup_panic
• 3) vm.panic_on_oom: This parameter will panic the kernel on oom-killer
events and capture a vmcore if kdump service is running as expected.
• 4) kernel.panic_on_io_nmi
• 5) kernel.unknown_nmi_panic: It utilizes NMI switch capability to force a
kernel panic on a hung system. This feature makes use of the computer's NMI
switch to trigger a panic.
• 6) kernel.panic_on_oops
• 7) kernel.panic_on_unrecovered_nmi
• 8) kernel.nmi_watchdog: The NMI watchdog monitors system interrupts and
initiates a reboot if the system appears to have hung.
• 9) kernel.panic_on_stackoverflow
• 10) kernel.panic [secs]](https://image.slidesharecdn.com/technotues15novpptsatishn-removefuji-170804142650/85/Techno-Fest-15nov16-12-320.jpg)
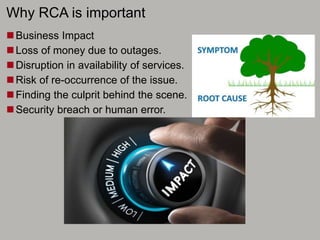
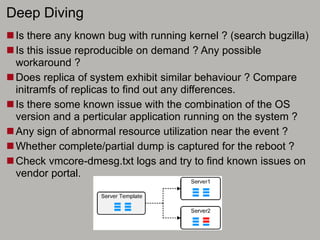
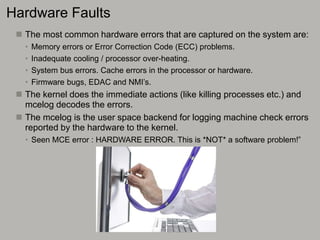
![Panic Strings
These panic strings explain cause of the panic. But it is not always
sufficient to determine the actual cause.
When a kernel panic occurs, the system usually displays a message on
the console and all the system activity stops’
• Kernel BUG at net/sunrpc/sched.c:695!
• BUG: unable to handle kernel paging request at xxxxx
• BUG: unable to handle kernel NULL pointer dereference at xxxxx / (null)
• divide error: 0000 [#1] SMP
• Kernel panic – not syncing: softlockup: hung tasks / hung_task: blocked tasks
• Kernel panic – not syncing: Watchdog detected hard LOCKUP on cpu 0
• Kernel panic – not syncing: out of memory, panic_on_oom is selected
• Kernel panic – not syncing: Out of memory and no killable processes..
• Kernel panic – not syncing: An NMI occurred, please see the Integrated Management Log for
details.”
• Kernel panic – not syncing: NMI IOCK error: Not continuing / NMI: Not continuing / nmi watchdog
• Kernel panic – not syncing: Fatal Machine check
• Kernel panic – not syncing: Attempted to kill init !
• Kernel panic – not syncing: GAB: Port h halting system due to client process failure](https://image.slidesharecdn.com/technotues15novpptsatishn-removefuji-170804142650/85/Techno-Fest-15nov16-13-320.jpg)
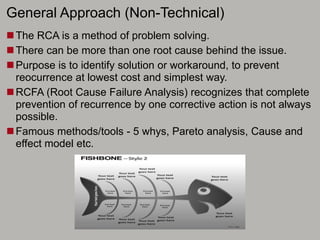
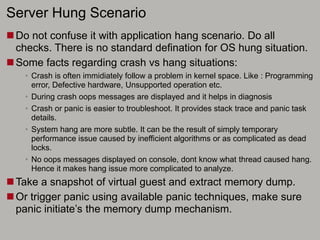
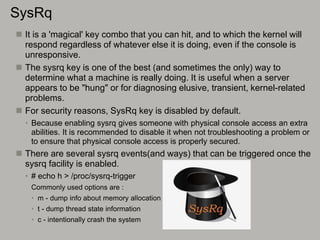
![Kernel logging
Syslog is a standard logging facility. It collects messages of various
programs and services including the kernel, and stores them, depending
on setup, in a bunch of log files typically under /var/log.
The “/var/log/messages” aims at storing valuable, non-debug and non-
critical messages. This log should be considered the "general system
activity" log.
Administrators use log rotation facility to maintain historical data. One
can also change the logging level based on the requirement of the setup.
# Common call traces seen in messages are :
• OOM-killer and memory stats.
• Softlockup logs for various cores.
• Page allocation failures.
• Segfaults : Signifies an error in one particular process.
kernel: fmg[6335]: segfault at 0xffffd2dc rip 0xffffd2dc rsp 00000000ffffd1bc errorX
• Trap divide error : Application crash due to “divide by zero”
kernel: nmupm[2792] trap divide error rip:804a39a rsp:ffa4eb24 error:X](https://image.slidesharecdn.com/technotues15novpptsatishn-removefuji-170804142650/85/Techno-Fest-15nov16-14-320.jpg)
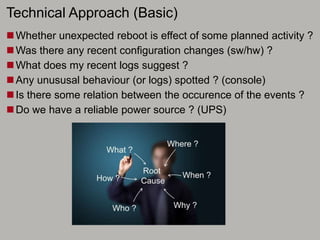
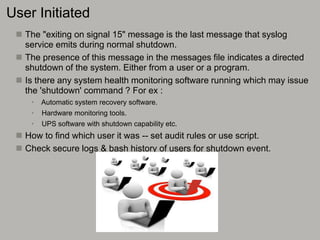
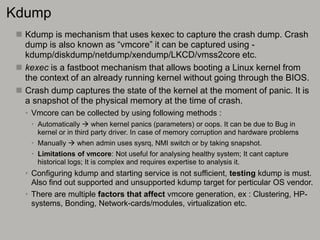
![OOM call traces
The out_of_memory function is called when the system memory
(including swap) has been fully allocated to a point where regular system
activities cannot be performed until some of that memory is freed.
The mm/oom_kill.c terminate one or more processes based on badness()
score; which follows an algorithm that does not kill any innocent task.
<snip/>
Node 0 DMA: 3*4kB 2*8kB 2*16kB 3*32kB 2*64kB 2*128kB ... 3*4096kB = 15132kB
Node 0 DMA32: 452*4kB ..
Node 0 Normal: 13315*4kB .. <<<
[..]
Free swap = 0kB <<<
Total swap = 8388604kB
[..]
kernel: httpd invoked oom-killer: gfp_mask=0x201d2, order=0, oomkilladj=0 <<<
kernel:
kernel: Call Trace:
[<ffffffff800c3a6a>] out_of_memory+0x8e/0x2f5
[<ffffffff8000f2eb>] __alloc_pages+0x245/0x2ce
[<ffffffff80012a62>] __do_page_cache_readahead+0x95/0x1d9
</snip>](https://image.slidesharecdn.com/technotues15novpptsatishn-removefuji-170804142650/85/Techno-Fest-15nov16-15-320.jpg)
![D-state call traces
These messages serve as a warning that something may not be
operating optimally. They do not necessarily indicate a serious problem
and any blocked processes should eventually proceed when the system
recovers.
The “khungtaskd” has the ability to detect tasks stuck in D-state (
Uninterruptible Sleep (UN) ) longer than a specified time period and
results in following type of message in system log:
<snip/>
INFO: task syslogd:2643 blocked for more than 120 seconds. <<<
"echo 0 > /proc/sys/kernel/hung_task_timeout_secs" disables this message. <<<
syslogd D ffff81000237eaa0 0 2643 1 2646 2634
(NOTLB) <<<
ffff8101352c3d88 0000000000000086 ffff8101352c3d98 ffffffff80063ff8
0000000000001000 0000000000000009 ffff81013d2c57e0 ffff810102ac1820
0000340b30708992 0000000000000571 ffff81013d2c59c8 000000010000089f
Call Trace: <<<
[<ffffffff80063ff8>] thread_return+0x62/0xfe
[...]
[<ffffffff8005e28d>] tracesys+0xd5/0xe0
</snip>](https://image.slidesharecdn.com/technotues15novpptsatishn-removefuji-170804142650/85/Techno-Fest-15nov16-16-320.jpg)
![Soft-lockup call traces
Soft lockups are situations in which the kernel's scheduler subsystem has
not been given a chance to perform its job.
It can be caused by defects in the kernel, by hardware issues or by
extremely high workloads.
<snip/>
kernel: BUG: soft lockup - CPU#7 stuck for 206s! [sosreport:14372] <<<
kernel: Modules linked in: rpcsec_gss_krb5 nfsd..vsock(U) ipv6 .. vmware_balloon .. vmxnet3 ..
dm_mod [last unloaded: speedstep_lib] <<<
[..]
/440BX Desktop Reference Platform
kernel: RIP: 0010:[<ffffffff81162cbd>] [<ffffffff81162cbd>] s_show+0x1ad/0x330 <<<
kernel: RSP: 0018:ffff8801e482fd98 EFLAGS: 00000202
kernel: RAX: 0000000000000000 RBX: ffff8801e482fe18 RCX: ffff88043febfb80 <<<
kernel: RDX: 0000000000000000 RSI: 00000000000036a7 RDI: ffff88043febfb60
[...]
kernel: <d> 00000000000036a7 ffff880437830f00 ffff8801e482fe18 ffff88031e3f1640
kernel: Call Trace:
kernel: [<ffffffff8119db87>] ? seq_read+0x267/0x3f0 <<<
kernel: [<ffffffff81054c30>] ? __dequeue_entity+0x30/0x50 .....
</snip>](https://image.slidesharecdn.com/technotues15novpptsatishn-removefuji-170804142650/85/Techno-Fest-15nov16-17-320.jpg)
![Page allocation failures
The kernel frequently needs to allocate chunks of memory for the
temporary storage of data and structures. Sometimes allocations
demands many physically contiguous pages which may not always be
available. In times like this memory allocator may choose to fail the
allocation request.
Common cause are memory-crunch, memory-fragmentation, memory-
zone exhausted and drivers with different service routines.
• Usual workaround is to check the value of vm.min_free_kbytes and double it. Also
setting vm.zone_reclaim_mode to 0 can help to avoid memory congestion issues .
</snip>
kernel: swapper: page allocation failure. order:2, mode:0x20 <<<
kernel: Pid: 0, comm: swapper Not tainted 2.6.32-220.4.1.el6.x86_64 #1
kernel: Call Trace:
kernel: <IRQ> [<ffffffff81123daf>] ? __alloc_pages_nodemask+0x77f/0x940
kernel: [<ffffffff8115dc62>] ? kmem_getpages+0x62/0x170
kernel: [<ffffffff8115e87a>] ? fallback_alloc+0x1ba/0x270
kernel: [<ffffffff8115e2cf>] ? cache_grow+0x2cf/0x320
kernel: [<ffffffff8115e5f9>] ? ____cache_alloc_node+0x99/0x160 ...
</snip>](https://image.slidesharecdn.com/technotues15novpptsatishn-removefuji-170804142650/85/Techno-Fest-15nov16-18-320.jpg)
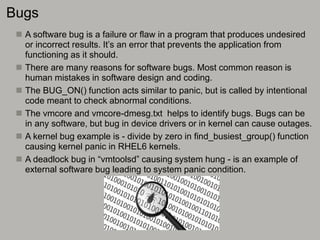


The document outlines the importance and methods of root cause analysis (RCA) for Linux system reboots, highlighting business impacts and strategies to prevent recurrence of issues. It discusses both non-technical and technical approaches to identify root causes, common issues leading to system reboots, and the distinction between crashes and hangs. Furthermore, it details diagnostic techniques such as log analysis, kdump usage, and the role of hardware and software bugs in system failures.


![Getting Started with Apache Spark: Big Data Made Simple [Free Meetup]](https://cdn.slidesharecdn.com/ss_thumbnails/apachesparkgettingstarted-260203175547-8361bcc3-thumbnail.jpg?width=640&height=640&fit=bounds)


