Downloaded 88 times


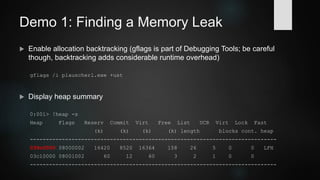
![Finding a Memory Leak
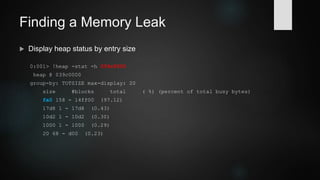
Filter by entry size
0:001> !heap -flt s fa0
_HEAP @ 39c0000
HEAP_ENTRY Size Prev Flags UserPtr UserSize - state
039d1190 01f7 0000 [00] 039d11a8 00fa0 - (busy)
039d2148 01f7 01f7 [00] 039d2160 00fa0 - (busy)
039d3100 01f7 01f7 [00] 039d3118 00fa0 - (busy)
039d40b8 01f7 01f7 [00] 039d40d0 00fa0 - (busy)](https://image.slidesharecdn.com/windowsdebugging-151214173937/85/Windows-Debugging-with-WinDbg-12-320.jpg)
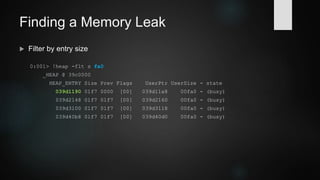
![Finding a Memory Leak
Inspect entry and get allocation backtrace
0:001> !heap -p -a 039d1190
address 039d1190 found in
_HEAP @ 39c0000
HEAP_ENTRY Size Prev Flags UserPtr UserSize - state
039d1190 01f7 0000 [00] 039d11a8 00fa0 - (busy)
77b3cdb3 ntdll!RtlpCallInterceptRoutine+0x00000026
77af71f1 ntdll!RtlAllocateHeap+0x000461d1
73f3f7cb ucrtbase!malloc+0x0000002b
d112d plauscherl!operator new+0x0000002c
d1027 plauscherl!allocateStuff+0x00000027
d12f6 plauscherl!__scrt_common_main_seh+0x000000ff
77447c04 KERNEL32!BaseThreadInitThunk+0x00000024
77acad1f ntdll!__RtlUserThreadStart+0x0000002f](https://image.slidesharecdn.com/windowsdebugging-151214173937/85/Windows-Debugging-with-WinDbg-13-320.jpg)
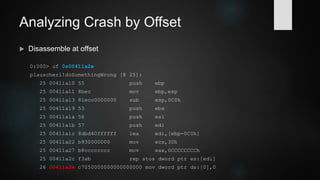
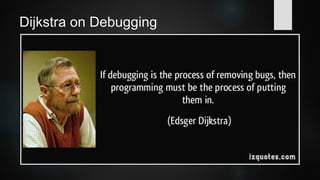
![Analyzing Crash by Offset
Disassemble at offset
0:000> uf 0x00411a2e
plauscherl!doSomethingWrong [@ 25]:
25 00411a10 55 push ebp
25 00411a11 8bec mov ebp,esp
25 00411a13 81ecc0000000 sub esp,0C0h
25 00411a19 53 push ebx
25 00411a1a 56 push esi
25 00411a1b 57 push edi
25 00411a1c 8dbd40ffffff lea edi,[ebp-0C0h]
25 00411a22 b930000000 mov ecx,30h
25 00411a27 b8cccccccc mov eax,0CCCCCCCCh
25 00411a2c f3ab rep stos dword ptr es:[edi]
26 00411a2e c7050000000000000000 mov dword ptr ds:[0],0](https://image.slidesharecdn.com/windowsdebugging-151214173937/85/Windows-Debugging-with-WinDbg-15-320.jpg)
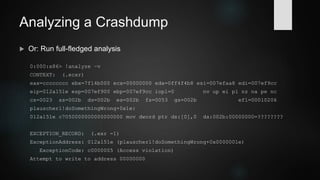
![Analyzing a Crashdump
Or: Run full-fledged analysis
0:000:x86> !analyze –v
CONTEXT: (.ecxr)
eax=cccccccc ebx=7f14b000 ecx=00000000 edx=0ff4f4b8 esi=007efaa8 edi=007ef9cc
eip=012a151e esp=007ef900 ebp=007ef9cc iopl=0 nv up ei pl nz na pe nc
cs=0023 ss=002b ds=002b es=002b fs=0053 gs=002b efl=00010206
plauscherl!doSomethingWrong+0x1e:
012a151e c7050000000000000000 mov dword ptr ds:[0],0 ds:002b:00000000=????????
EXCEPTION_RECORD: (.exr -1)
ExceptionAddress: 012a151e (plauscherl!doSomethingWrong+0x0000001e)
ExceptionCode: c0000005 (Access violation)
Attempt to write to address 00000000](https://image.slidesharecdn.com/windowsdebugging-151214173937/85/Windows-Debugging-with-WinDbg-17-320.jpg)
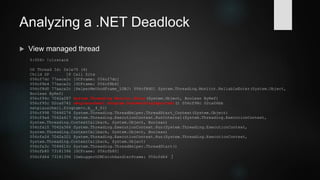
![Analyzing a .NET Deadlock
View managed thread
0:004> !clrstack
OS Thread Id: 0x1e70 (4)
Child SP IP Call Site
056cf7dc 77aaca2c [GCFrame: 056cf7dc]
056cf8b4 77aaca2c [GCFrame: 056cf8b4]
056cf8d0 77aaca2c [HelperMethodFrame_1OBJ: 056cf8d0] System.Threading.Monitor.ReliableEnter(System.Object,
Boolean ByRef)
056cf94c 7042a287 System.Threading.Monitor.Enter(System.Object, Boolean ByRef)
056cf95c 02ca0741 netplauscherl.Program.DoSomethingImportant() 056cf98c 02ca06bb
netplauscherl.Program+c.b__4_0()
056cf998 70446274 System.Threading.ThreadHelper.ThreadStart_Context(System.Object)
056cf9a4 7042a417 System.Threading.ExecutionContext.RunInternal(System.Threading.ExecutionContext,
System.Threading.ContextCallback, System.Object, Boolean)
056cfa10 7042a366 System.Threading.ExecutionContext.Run(System.Threading.ExecutionContext,
System.Threading.ContextCallback, System.Object, Boolean)
056cfa24 7042a321 System.Threading.ExecutionContext.Run(System.Threading.ExecutionContext,
System.Threading.ContextCallback, System.Object)
056cfa3c 704461fc System.Threading.ThreadHelper.ThreadStart()
056cfb80 73181396 [GCFrame: 056cfb80]
056cfd64 73181396 [DebuggerU2MCatchHandlerFrame: 056cfd64 ]](https://image.slidesharecdn.com/windowsdebugging-151214173937/85/Windows-Debugging-with-WinDbg-20-320.jpg)
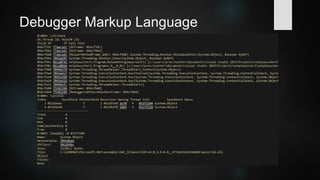
![Some WinDbg commands
Go
g
Set breakpoint at address
bp [Addr]
Set breakpoint at symbol (pattern)
bm SymPattern
Set breakpoint on access
ba [r|w|e] [Size] Addr](https://image.slidesharecdn.com/windowsdebugging-151214173937/85/Windows-Debugging-with-WinDbg-23-320.jpg)
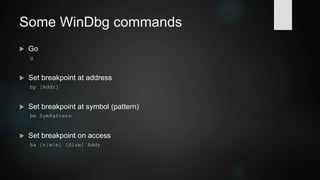
![More WinDbg commands
Display callstack for selected thread
k
Display local variables and parameters
dv [/i /t /V /a /n /z] [Pattern]
Display type
dt [-n|y] [mod!]Name [-n|y] [Field] [Addr] -abcehioprsv
0:000> dt 0x0100297c MYTYPE1
+0x000 a : 22
+0x004 b : 43 '+'
+0x006 c : 0x0
+0x008 d : 0x0
+0x00c gn : [6] 0x0](https://image.slidesharecdn.com/windowsdebugging-151214173937/85/Windows-Debugging-with-WinDbg-24-320.jpg)
![More WinDbg commands
Display callstacks for all threads
~* k
Dump all registers
r
Show process environment block
!peb
Display time consumption per thread
!runaway
Search memory for pattern
s -[Flags][b|w|d|q|a|u] Range Pattern](https://image.slidesharecdn.com/windowsdebugging-151214173937/85/Windows-Debugging-with-WinDbg-25-320.jpg)
![Selected SOS commands
Display managed callstack
!CLRStack [-a] [-l] [-p] [-n]
Display managed / unmanaged callstack for all threads (see: !DumpStack)
!EEStack [-short] [-EE]
Display IL associated with managed method
!DumpIL <Managed DynamicMethod object> | <MethodDesc pointer>
Heap object statistics
!DumpHeap –stat
Display object at specified address
!DumpObj [-nofields] <object address>](https://image.slidesharecdn.com/windowsdebugging-151214173937/85/Windows-Debugging-with-WinDbg-26-320.jpg)
![Selected SOSEX commands
Display deadlocks between SyncBlocks and/or ReaderWriterLocks
!dlk [-d]
Display GC roots for the specified object
!mroot <ObjectAddr> [-all]
Print a stack trace of managed and unmanaged frames
!mk
Search the managed heap for strings
strings [ModuleAddress] [Options]](https://image.slidesharecdn.com/windowsdebugging-151214173937/85/Windows-Debugging-with-WinDbg-27-320.jpg)


WinDbg is a low-level debugger for Windows that provides features like usermode debugging, kernel debugging, post-mortem debugging, and support for debugging extensions. It can be used to debug crashes, analyze memory leaks, find deadlocks, and investigate other issues when the higher-level Visual Studio debugger is not sufficient. The document provides examples of using WinDbg commands and extensions like SOS to debug memory leaks, analyze crashes based on offset or dump files, and investigate .NET deadlocks.