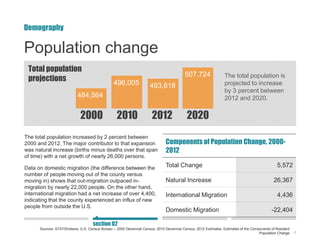
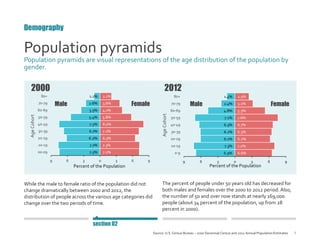
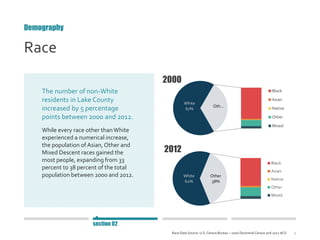
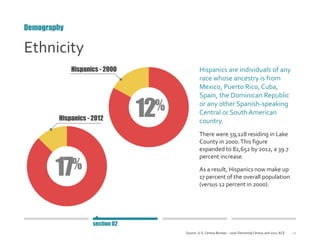
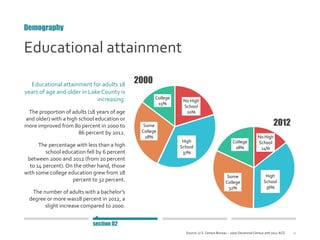
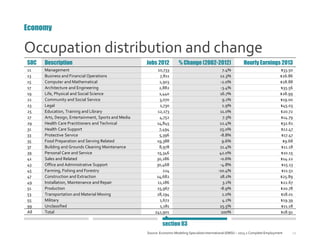
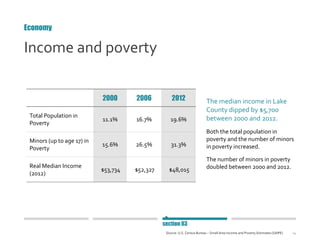
SlideShare a Scribd company logo
Data SnapShot Series 1.0
October 2014
DATA SNAPSHOT
Lake County
Table of contents
Introduction
01
Demography
02
Economy
03
Labor Market
04
Purpose
About Lake County
01
introduction
4
Purpose
This document provides information
and data about Lake County that
can be used to guide local decision-
making activities.
The Data SnapShot showcases a variety
of demographic, economic and labor
market information that local leaders,
community organizations and others can
use to gain a better perspective on
current conditions and opportunities in
their county.
To strengthen the value and usability of
the information, we showcase the data
using a variety of visual tools, such as
charts, graphs and tables. In addition, we
offer key points about the data as a way
of assisting the user with the interpretation
of the information presented.
Finally, short takeaway messages are
offered at the end of each section in order
to highlight some of the more salient
findings.
Introduction
section 01
5
About Lake County
Introduction
section 01
County Background
Established 1837
County
Seat
Crown Point
Area 627 sq. mi.
Neighboring
Counties
Jasper, IN
Newton, IN
Porter, IN
Cook, IL
Kankakee, IL
Will, IL
Population change
Population pyramids
Race
Ethnicity
Educational attainment
Takeaways
02
demograph
y
7
Population change
Components of Population Change, 2000-
2012
Total Change 5,572
Natural Increase 26,367
International Migration 4,436
Domestic Migration -22,404
The total population is
projected to increase
by 3 percent between
2012 and 2020.
Demography
Sources: STATSIndiana, U.S. Census Bureau – 2000 Decennial Census, 2010 Decennial Census, 2012 Estimates, Estimates of the Components of Resident
Population Change
section 02
The total population increased by 2 percent between
2000 and 2012. The major contributor to that expansion
was natural increase (births minus deaths over that span
of time) with a net growth of nearly 26,000 persons.
Data on domestic migration (the difference between the
number of people moving out of the county versus
moving in) shows that out-migration outpaced in-
migration by nearly 22,000 people. On the other hand,
international migration had a net increase of over 4,400,
indicating that the county experienced an influx of new
people from outside the U.S.
484,564
496,005 493,618
507,724
2020201220102000
Total population
projections
8
6.6%
7.0%
6.2%
6.5%
6.7%
7.6%
5.3%
3.2%
2.5%
6.9%
7.3%
6.1%
6.1%
6.3%
7.1%
4.8%
2.4%
1.4%
9 6 3 0 3 6 9
0-9
10-19
20-29
30-39
40-49
50-59
60-69
70-79
80+
Percent of the PopulationAgeCohort
Population pyramids
Population pyramids are visual representations of the age distribution of the population by
gender.
While the male to female ratio of the population did not
change dramatically between 2000 and 2012, the
distribution of people across the various age categories did
change over the two periods of time.
Demography
Source: U.S. Census Bureau – 2000 Decennial Census and 2012 Annual Population Estimates
section 02
The percent of people under 50 years old has decreased for
both males and females over the 2000 to 2012 period.Also,
the number of 50 and over now stands at nearly 169,000
people (about 34 percent of the population, up from 28
percent in 2000).
Male Female
2012
7.2%
7.3%
6.5%
7.2%
8.0%
5.8%
4.1%
3.6%
2.1%
7.5%
7.7%
6.2%
6.7%
7.5%
5.4%
3.5%
2.6%
1.1%
9 6 3 0 3 6 9
00-09
10-19
20-29
30-39
40-49
50-59
60-69
70-79
80+
Percent of the Population
AgeCohort
2000
Male Female
9
Race
The number of non-White
residents in Lake County
increased by 5 percentage
points between 2000 and 2012.
While every race other thanWhite
experienced a numerical increase,
the population of Asian, Other and
Mixed Descent races gained the
most people, expanding from 33
percent to 38 percent of the total
population between 2000 and 2012.
Demography
Race Data Source: U.S. Census Bureau – 2000 Decennial Census and 2012 ACS
section 02
White
67%
Oth…
2000
Black
Asian
Native
Other
Mixed
White
62%
Other
38%
2012
Black
Asian
Native
Other
Mixed
10
Ethnicity
Hispanics are individuals of any
race whose ancestry is from
Mexico, Puerto Rico, Cuba,
Spain, the Dominican Republic
or any other Spanish-speaking
Central or South American
country.
There were 59,128 residing in Lake
County in 2000.This figure
expanded to 82,652 by 2012, a 39.7
percent increase.
As a result, Hispanics now make up
17 percent of the overall population
(versus 12 percent in 2000).
Demography
Source: U.S. Census Bureau – 2000 Decennial Census and 2012 ACS
section 02
17%
12%
Hispanics - 2000
Hispanics - 2012
11
Educational attainment
Demography
Source: U.S. Census Bureau – 2000 Decennial Census and 2012 ACS
section 02
No High
School
14%
High
School
36%
Some
College
32%
College
18%
2012
No High
School
20%
High
School
37%
Some
College
28%
College
15%
2000Educational attainment for adults 18
years of age and older in Lake County is
increasing.
The proportion of adults (18 years of age
and older) with a high school education or
more improved from 80 percent in 2000 to
86 percent by 2012.
The percentage with less than a high
school education fell by 6 percent
between 2000 and 2012 (from 20 percent
to 14 percent). On the other hand, those
with some college education grew from 28
percent to 32 percent.
The number of adults with a bachelor’s
degree or more was18 percent in 2012, a
slight increase compared to 2000.
12
Takeaways
The population of Lake County is expected to
grow modestly over the next few years, and if
past trends hold, that increase will be largely due
to natural increase (more births than deaths).
While Lake County’s population has been
growing over the 2000 to 2012 period, it has also
been aging. In addition, its population has
declined by nearly 22,000 people due to domestic
out-migration, suggesting that young individuals
and those of prime working age (20-39 years of
age) are moving out of the county at a faster pace
than they are moving in.
The educational level of the population has
increased and the county has become more diverse
by race and ethnicity since 2000.
In order to achieve a balanced ratio of
working-age individuals and dependents
(minors and elderly), Lake County should
explore what mix of services and amenities
will retain and attract educated young adults.
Demography
section 02
Establishments
Industries
Occupations
Income and poverty
Takeaways
03
economy
14
Establishments
Components of Change for Establishments
Total Change (2000-11) 16,143
Natural Change (births minus
deaths)
15,755
Net Migration 388
The number of establishments in Lake
County doubled between 2000 and 2011.
The rapid growth of establishments was largely due
to natural change.That is, 35,600 establishments
were launched in the county between 2000 and
2011, while 19,800 closed, resulting in a gain of
15,755 establishments.
Economy
Source: National Establishment Time Series (NETS) – 2011 Database
section 03
An establishment is a
physical business location.
Branches, standalones and
headquarters are all
considered types of
establishments.
Definition of Company
Stages
0 1
2 3
4
Self-
employed
2-9
employees
10-99
employees
100-499
employees
500+
employees
15
Number of establishments by
stage/employment category
Economy
Source: National Establishment Time Series (NETS) – 2011 Database
section 03
2000 2011
Stage Establishments Proportion Establishments Proportion
Stage 0 3,256 20% 10,058 30%
Stage 1 9,314 57% 18,911 58%
Stage 2 3,501 21% 3,260 10%
Stage 3 257 1% 256 1%
Stage 4 46 1% 32 1%
Total 16,374 100% 32,517 100%
16
Number of jobs by stage/employment
category
Economy
Source: National Establishment Time Series (NETS) – 2011 Database
section 03
2000 2011
Stage Jobs Proportion Jobs Proportion
Stage 0 3,256 1% 10,058 4%
Stage 1 35,916 16% 56,994 25%
Stage 2 87,716 39% 82,048 36%
Stage 3 43,486 19% 42,370 19%
Stage 4 56,055 25% 36,882 16%
Total 226,429 100% 228,352 100%
17
Amount of sales by stage/employment
category
Economy
Source: National Establishment Time Series (NETS) – 2011 Database
section 03
2000 2011
Stage Sales Proportion Sales Proportion
Stage 0 $319,631,826 1% $673,636,676 3%
Stage 1 $4,008,852,759 15% $4,719,109,243 21%
Stage 2 $9,024,364,231 34% $7,949,058,309 35%
Stage 3 $5,158,581,200 20% $5,877,793,166 26%
Stage 4 $7,734,249,838 29% $3,526,973,814 16%
Total $26,245,679,854 100% $22,746,571,208 100%
18
Top five industries in 2012
55.6 percent of jobs are tied to
one of the top five industries in
Lake County
Health Care & Social Assistance is the
largest industry sector (34,824 jobs).
Accommodation and Food Services is
the smallest of the top industry sectors
with 18,124 jobs.
Economy
Source: Economic Modeling Specialists International (EMSI) – Complete Employment
section 03
Health Care & Social
Assistance
14.4%
Government
11.9%
Retail Trade
11.3%
Manufacturing
10.5%
Accommodation
& Food Services…
All Other Industries
44.4%
19
Industry distribution and change
NAICS Code Description Jobs 2012 % Change (2002-2012) Earnings 2013
11 Agriculture, Forestry, Fishing and Hunting 639 -10.9% $18,551
21 Mining, Quarrying and Oil and Gas Extraction 176 -27.9% $107,293
22 Utilities 1,730 1.7% $126,479
23 Construction 17,788 25.1% $85,919
31-33 Manufacturing 25,290 -11.7% $107,534
42 Wholesale Trade 6,076 -13.3% $66,946
44-45 Retail Trade 27,407 -4.9% $26,118
48-49 Transportation and Warehousing 10,842 20.7% $53,948
51 Information 1,935 -23.3% $43,244
52 Finance and Insurance 7,201 3.1% $42,461
53 Real Estate and Rental and Leasing 8,339 23.7% $23,385
54 Professional, Scientific and Technical Services 8,829 4.4% $46,116
55 Management of Companies and Enterprises 1,793 36.8% $99,665
56 Administrative and Waste Management 11,827 1.0% $27,577
61 Educational Services (Private) 4,541 56.9% $26,907
62 Health Care and Social Assistance 34,824 20.1% $48,699
71 Arts, Entertainment and Recreation 7,652 -17.1% $28,730
72 Accommodation and Food Services 18,134 17.4% $15,376
81 Other Services (except Public Administration) 18,049 25.9% $20,526
90 Government 28,830 -3.7% $48,730
99 Unclassified Industry <10 - $54,835
All Total 241,901 - $48,711
Economy
Source: Economic Modeling Specialists International (EMSI) – 2013.2 Complete Employment
section 03
20
Industry distribution and change
The largest employment gains in
Lake County occurred in:
 Private Educational Services (+56.9
percent)
 Management of Companies and
Enterprises (+36.8 percent)
The largest employment losses
occurred in:
 Mining,Quarrying and Oil andGas
Extraction (-27.9 percent)
 Information (-23.3 percent)
Economy
Source: Economic Modeling Specialists International (EMSI) – 2013.2 Complete Employment
section 03
Employment Increase Employment Decrease
Changes in the top five industry sectors
(2002-2012):
HealthCare & Social
Assistance
Accommodation &
Food Services
Government
RetailTrade
Manufacturing
21
Office &
Administrative
Support…
Sales & Related
12%
Food Preparation
& Serving…
Transportation &
Material Moving
7%
Production
7%
All Other Occupations
53%
Top five occupations in 2012
The top five occupations in
Lake County represent 47.3
percent of all jobs.
Office andAdministrative Support and
Sales and Related are the occupations
with the largest number of workers.
Production occupations is the smallest of
the top five occupations in the county (7
percent of jobs).
Economy
Source: Economic Modeling Specialists International (EMSI) – 2013.2 Complete Employment
section 03
22
SOC Description Jobs 2012 % Change (2002-2012) Hourly Earnings 2013
11 Management 10,733 7.4% $33.50
13 Business and Financial Operations 7,811 12.3% $26.86
15 Computer and Mathematical 1,903 -2.0% $28.88
17 Architecture and Engineering 2,882 -3.4% $35.56
19 Life, Physical and Social Science 1,440 16.7% $28.99
21 Community and Social Service 3,070 9.1% $19.00
23 Legal 1,730 1.9% $45.03
25 Education, Training and Library 12,273 11.0% $20.72
27 Arts, Design, Entertainment, Sports and Media 4,752 7.3% $14.79
29 Health Care Practitioners and Technical 14,845 12.4% $32.61
31 Health Care Support 7,494 25.0% $12.47
33 Protective Service 5,396 -8.8% $17.47
35 Food Preparation and Serving Related 19,388 9.6% $9.68
37 Building and Grounds Cleaning Maintenance 8,978 11.4% $11.18
39 Personal Care and Service 15,346 42.0% $10.15
41 Sales and Related 30,286 -0.6% $14.22
43 Office and Administrative Support 30,468 -4.8% $15.13
45 Farming, Fishing and Forestry 224 -10.4% $11.51
47 Construction and Extraction 14,682 18.1% $25.89
49 Installation, Maintenance and Repair 11,186 3.1% $22.67
51 Production 15,967 -8.9% $20.78
53 Transportation and Material Moving 18,194 1.0% $18.01
55 Military 1,672 4.1% $19.39
99 Unclassified 1,181 25.5% $11.18
All Total 241,901 100% $18.91
Occupation distribution and change
Economy
Source: Economic Modeling Specialists International (EMSI) – 2013.2 Complete Employment
section 03
23
Occupation distribution and change
Economy
Source: Economic Modeling Specialists International (EMSI) – 2013.2 Complete Employment
section 03
The largest percentage gains in
jobs in Lake County occurred in:
 Personal Care & Service (+42.0
percent)
 Health Care Support (+25.0 percent)
The largest percentage loss in
employment occurred in:
 Farming, Fishing & Forestry (-10.4
percent)
 Production (-8.9 percent)
Changes in the top five occupations (2002-
2012):
Food Preparation
& Serving
Transportation &
Material Moving
Sales & Related
Office &
Administrative
Production
Employment Increase Employment Decrease
24
Income and poverty
2000 2006 2012
Total Population in
Poverty
11.1% 16.7% 19.6%
Minors (up to age 17) in
Poverty
15.6% 26.5% 31.3%
Real Median Income
(2012)
$53,734 $52,327 $48,015
The median income in Lake
County dipped by $5,700
between 2000 and 2012.
Both the total population in
poverty and the number of minors
in poverty increased.
The number of minors in poverty
doubled between 2000 and 2012.
Economy
Source: U.S. Census Bureau – Small Area Income and Poverty Estimates (SAIPE)
section 03
25
Income and poverty
Median income in Lake County has decreased in recent years, while poverty has continued to
increase.
Economy
Source: U.S. Census Bureau – Small Area Income and Poverty Estimates (SAIPE)
section 03
0
5
10
15
20
25
30
35
25,000
30,000
35,000
40,000
45,000
50,000
55,000
60,000
PopulationinPoverty(percent)
RealMedianIncomein2012(dollars)
Median Income
Minors in Poverty
All Ages in
Poverty
26
Takeaways
All establishment growth in Lake County
occurred in businesses having fewer than
10 employees. So, focusing on the needs of
the self-employed (Stage 0) and start-ups
(Stage 1) establishments may be
worthwhile.
The food industry, health care, management,
education and transportation are employment
growth areas for Lake County.These are
industries and occupations that demand workers
with varying educational levels.
Median income has decreased and poverty has
increased in Lake County since 2000.
Lake County might focus on policies and programs
that strengthen high-growth Stage 2 firms since
they employ several people and capture sizable
sales.
Promoting job growth for occupations requiring
educated workers could help retain adults with
higher educational attainment and help increase
median income.
Services targeted to poverty-stricken individuals
should be considered given the dramatic rise in
poverty, especially among children under 18 years
old.
Economy
section 03
Labor force and
unemployment
Laborshed
Commuteshed
Takeaways
04
labor
market
28
Labor force and unemployment
2002 2012
Labor Force 227,989 220,793
Unemployment
Rate
6.4% 9.2%
The labor force in Lake County
decreased by 3.1 percent between
2002 and 2012.
This decrease is likely due to a rise in the
number of individuals who are either
officially unemployed or who have given
up looking for a job.
Labor market
Source: U.S. Bureau of Labor Statistics – Local Area Unemployment Statistics
section 04
29
Unemployment rate
Between 2002 and 2012, the unemployment rate in Lake County peaked at 10.9 percent in
2010.
Labor market
Source: U.S. Bureau of Labor Statistics – Local Area Unemployment Statistics
section 04
3.6%
6.4%
5.2%
10.9%
9.2%
0.0
2.0
4.0
6.0
8.0
10.0
12.0
UnemploymentRate(%)
Year
30
Commuteshed
A county’s commuteshed is the
geographic area to which its
work force travels to work.
Forty-one percent of employed
residents in Lake County commute
to jobs located outside of Lake
County.
The top commuteshed counties for
Lake County residents who work
outside of the county are Cook
County, Illinois, and Porter County,
Indiana.
Labor market
Source: U.S. Census Bureau – Longitudinal Employer-Household Dynamics (LEHD)
section 04
83,806
Out-Commuters
120,585
Same Work/
Home
Commuters Proportion
Cook, IL 39,960 19.6%
Porter, IN 11,061 5.4%
Marion, IN 5,295 2.6%
Will, IL 3,341 1.6%
DuPage, IL 3,156 1.5%
31
Laborshed
Commuters Proportion
Porter, IN 25,554 13.2%
Cook, IL 14,026 7.2%
La Porte, IN 4,685 2.4%
Jasper, IN 3,131 1.6%
Marion, IN 2,527 1.3%
Labor market
Source: U.S. Census Bureau – Longitudinal Employer-Household Dynamics (LEHD)
section 04
72,982
In-Commuters
120,585
Same Work/
Home
A county’s laborshed is the
geographic area from which it
draws employees.
Thirty-eight percent of individuals
working in Lake County commute from
another county for work. Porter County,
Indiana, and Cook County, Illinois, are
the biggest sources of outside labor for
Lake County.
Sixty-four percent of in-commuters
reside in counties adjacent to Lake
County; however, the fifth largest
laborshed county is the Indianapolis
metropolitan area (Marion County,
Indiana).
32
Commuteshed in 2011
Labor market
section 04
Source: U.S. Census Bureau, OTM, LEHD, PCRD
Eighty percent of Lake County’s
working residents are employed
either in Lake or Cook Counties.
Another 5 percent commute to
Porter, while an additional 5
percent travel to jobs in DuPage,
Will, LaPorte or Marion Counties
Collectively, these seven counties
represent 90 percent of the
commuteshed for Lake County.
33
Laborshed in 2011
Labor market
section 04
Source: U.S. Census Bureau, OTM, LEHD, PCRD
The bulk (80 percent) of Lake
County’s workforce is drawn from
Lake and Porter Counties. Another
5 percent is drawn from LaPorte
County in Indiana and Cook County
in Illinois. An additional 5 percent
comes from Will County in Illinois
and Saint Joseph, Jasper and
Marion Counties in Indiana.
Combined, the eight counties
represent 90 percent of Lake
County’s laborshed.
34
Takeaways
Lake County’s unemployment rate has increased
since 2002.The majority of this increase occurred
during the period of the Great Recession
(approximately 2009 to 2010).
Despite population increases, the county’s labor
force has decreased since 2002, indicating that
there may be an increasing number of individuals
who are unemployed or are discouraged workers
(workers who have given up trying to find a job).
Employees that work but do not live in Lake
County tend to commute from surrounding
counties. People who commute out of the county
for work tend to travel to other metropolitan
areas.
Lake County should assess if a major workforce
development training effort should be targeted
to the growing number of working age adults
struggling to find jobs.
The laborshed and commuteshed data
offer solid evidence of the value of
pursuing economic and workforce
development on a regional (multi-
county) basis.
Labor market
section 04
35
.
Report Contributors
This report was prepared by the Purdue Center for Regional Development in partnership with
Purdue University Extension.
Labor market
section 04
Data Analysis
Indraneel Kumar, Ph.D.
Ayoung Kim
Report Authors
Elizabeth Dobis
Bo Beaulieu, Ph.D.
Report Design
Tyler Wright
Adeline Jackson
It is the policy of the Purdue University Cooperative Extension Service that all persons have equal opportunity and access to its
educational programs, services, activities, and facilities without regard to race, religion, color, sex, age, national origin or ancestry,
marital status, parental status, sexual orientation, disability or status as a veteran. Purdue University is an Affirmative Action
institution. This material may be available in alternative formats.
FOR MORE
INFORMATION
Purdue Center for Regional Development
(PCRD) . . .
seeks to pioneer new ideas and strategies that contribute
to regional collaboration, innovation and prosperity.
Purdue Extension Community Development
(CD) . . .
works to strengthen the capacity of local leaders, residents
and organizations to work together to develop and sustain
strong, vibrant communities.
OR
Please contact
Janet Reed
Extension Educator
219-755-3240
reedjm@purdue.edu

More Related Content

Viewers also liked

Economic Snapshot- -August 3, 2015
Economic Snapshot- -August 3, 2015Economic Snapshot- -August 3, 2015
Economic Snapshot- -August 3, 2015
Kurt S. Altrichter
 
Understanding and Using Labor Market Information
Understanding and Using Labor Market InformationUnderstanding and Using Labor Market Information
Understanding and Using Labor Market Information
Michele Martin
 
Cape may-county-data-demographics-labor-employment
Cape may-county-data-demographics-labor-employmentCape may-county-data-demographics-labor-employment
Cape may-county-data-demographics-labor-employmentfianacone
 
Session, Tools for Labor Market Information - Center for Workforce Informatio...
Session, Tools for Labor Market Information - Center for Workforce Informatio...Session, Tools for Labor Market Information - Center for Workforce Informatio...
Session, Tools for Labor Market Information - Center for Workforce Informatio...PAPartners
 
Visualizing the Bureau of Labor Statistics Employment Dataset
Visualizing the Bureau of Labor Statistics Employment DatasetVisualizing the Bureau of Labor Statistics Employment Dataset
Visualizing the Bureau of Labor Statistics Employment Dataset
Curran Kelleher
 
Contextualizing Real-Time and Traditional Labor Market Data
Contextualizing Real-Time and Traditional Labor Market DataContextualizing Real-Time and Traditional Labor Market Data
Contextualizing Real-Time and Traditional Labor Market Data
EMSI
 
African Americans: College Majors and Earnings
African Americans: College Majors and Earnings African Americans: College Majors and Earnings
African Americans: College Majors and Earnings
CEW Georgetown
 
The Online College Labor Market
The Online College Labor MarketThe Online College Labor Market
The Online College Labor Market
CEW Georgetown
 

Viewers also liked (10)

Economic Snapshot- -August 3, 2015
Economic Snapshot- -August 3, 2015Economic Snapshot- -August 3, 2015
Economic Snapshot- -August 3, 2015
 
Understanding and Using Labor Market Information
Understanding and Using Labor Market InformationUnderstanding and Using Labor Market Information
Understanding and Using Labor Market Information
 
2016 Labor Report FINAL
2016 Labor Report FINAL2016 Labor Report FINAL
2016 Labor Report FINAL
 
Cape may-county-data-demographics-labor-employment
Cape may-county-data-demographics-labor-employmentCape may-county-data-demographics-labor-employment
Cape may-county-data-demographics-labor-employment
 
Carlos a
Carlos aCarlos a
Carlos a
 
Session, Tools for Labor Market Information - Center for Workforce Informatio...
Session, Tools for Labor Market Information - Center for Workforce Informatio...Session, Tools for Labor Market Information - Center for Workforce Informatio...
Session, Tools for Labor Market Information - Center for Workforce Informatio...
 
Visualizing the Bureau of Labor Statistics Employment Dataset
Visualizing the Bureau of Labor Statistics Employment DatasetVisualizing the Bureau of Labor Statistics Employment Dataset
Visualizing the Bureau of Labor Statistics Employment Dataset
 
Contextualizing Real-Time and Traditional Labor Market Data
Contextualizing Real-Time and Traditional Labor Market DataContextualizing Real-Time and Traditional Labor Market Data
Contextualizing Real-Time and Traditional Labor Market Data
 
African Americans: College Majors and Earnings
African Americans: College Majors and Earnings African Americans: College Majors and Earnings
African Americans: College Majors and Earnings
 
The Online College Labor Market
The Online College Labor MarketThe Online College Labor Market
The Online College Labor Market
 

Similar to County Profile Template Booklet

LaPorte County Snapshot
LaPorte County SnapshotLaPorte County Snapshot
Floyd County Snapshot
Floyd County SnapshotFloyd County Snapshot
Tippecanoe County SnapShot
Tippecanoe County SnapShotTippecanoe County SnapShot
Tippecanoe County SnapShot
Purdue Center for Regional Development
 
Marion County Snapshot
Marion County SnapshotMarion County Snapshot
Daviess County Snapshot
Daviess County SnapshotDaviess County Snapshot
Jackson County Snapshot
Jackson County SnapshotJackson County Snapshot
Jackson County Snapshot
Jackson County SnapshotJackson County Snapshot
Steuben County Snapshot
Steuben County SnapshotSteuben County Snapshot
Anderson County, TX
Anderson County, TXAnderson County, TX
Anderson County, TX
ETCOG_GIS
 
Harrison County Snapshot
Harrison County SnapshotHarrison County Snapshot
Harrison County Snapshot
Purdue Center for Regional Development
 
Rush County SnapShot
Rush County SnapShotRush County SnapShot
Clinton County Snapshot
Clinton County SnapshotClinton County Snapshot

Similar to County Profile Template Booklet (20)

LaPorte County Data Snapshot
LaPorte County Data SnapshotLaPorte County Data Snapshot
LaPorte County Data Snapshot
 
LaPorte County Snapshot
LaPorte County SnapshotLaPorte County Snapshot
LaPorte County Snapshot
 
La portecountysnapshot final
La portecountysnapshot finalLa portecountysnapshot final
La portecountysnapshot final
 
LaPorte County SnapShot
LaPorte County SnapShotLaPorte County SnapShot
LaPorte County SnapShot
 
Floyd County Data Snapshot
Floyd County Data SnapshotFloyd County Data Snapshot
Floyd County Data Snapshot
 
Floyd County Snapshot
Floyd County SnapshotFloyd County Snapshot
Floyd County Snapshot
 
Tippecanoe County SnapShot
Tippecanoe County SnapShotTippecanoe County SnapShot
Tippecanoe County SnapShot
 
Marion County Data Snapshot
Marion County Data SnapshotMarion County Data Snapshot
Marion County Data Snapshot
 
Marion County Snapshot
Marion County SnapshotMarion County Snapshot
Marion County Snapshot
 
Daviess County Snapshot
Daviess County SnapshotDaviess County Snapshot
Daviess County Snapshot
 
Jackson County Snapshot
Jackson County SnapshotJackson County Snapshot
Jackson County Snapshot
 
Jackson County Snapshot
Jackson County SnapshotJackson County Snapshot
Jackson County Snapshot
 
Steuben County Snapshot
Steuben County SnapshotSteuben County Snapshot
Steuben County Snapshot
 
Jefferson County Data Snapshot
Jefferson County Data SnapshotJefferson County Data Snapshot
Jefferson County Data Snapshot
 
Anderson County, TX
Anderson County, TXAnderson County, TX
Anderson County, TX
 
Harrison County Data Snapshot
Harrison County Data SnapshotHarrison County Data Snapshot
Harrison County Data Snapshot
 
Harrison County Snapshot
Harrison County SnapshotHarrison County Snapshot
Harrison County Snapshot
 
Rush County SnapShot
Rush County SnapShotRush County SnapShot
Rush County SnapShot
 
Clinton County Snapshot
Clinton County SnapshotClinton County Snapshot
Clinton County Snapshot
 
Clinton County Data Snapshot
Clinton County Data SnapshotClinton County Data Snapshot
Clinton County Data Snapshot
 

More from Purdue Center for Regional Development

River Hills Indiana Regional Snapshot
River Hills Indiana Regional SnapshotRiver Hills Indiana Regional Snapshot
River Hills Indiana Regional Snapshot
Purdue Center for Regional Development
 
Radius Indiana Regional Snapshot
Radius Indiana Regional SnapshotRadius Indiana Regional Snapshot
Radius Indiana Regional Snapshot
Purdue Center for Regional Development
 
East Central Indiana Regional Snapshot
East Central Indiana Regional SnapshotEast Central Indiana Regional Snapshot
East Central Indiana Regional Snapshot
Purdue Center for Regional Development
 
Northwest Indiana Regional Data Snapshot
Northwest Indiana Regional Data SnapshotNorthwest Indiana Regional Data Snapshot
Northwest Indiana Regional Data Snapshot
Purdue Center for Regional Development
 
East Central Indiana Regional Data Snapshot
East Central Indiana Regional Data SnapshotEast Central Indiana Regional Data Snapshot
East Central Indiana Regional Data Snapshot
Purdue Center for Regional Development
 
North Central Indiana Regional Data Snapshot
North Central Indiana Regional Data SnapshotNorth Central Indiana Regional Data Snapshot
North Central Indiana Regional Data Snapshot
Purdue Center for Regional Development
 
Pulaski County SnapShot
Pulaski County SnapShotPulaski County SnapShot
Perry County Snapshot
Perry County SnapshotPerry County Snapshot
Lake County Snapshot
Lake County SnapshotLake County Snapshot
Boone County Snapshot
Boone County SnapshotBoone County Snapshot

More from Purdue Center for Regional Development (11)

River Hills Indiana Regional Snapshot
River Hills Indiana Regional SnapshotRiver Hills Indiana Regional Snapshot
River Hills Indiana Regional Snapshot
 
Radius Indiana Regional Snapshot
Radius Indiana Regional SnapshotRadius Indiana Regional Snapshot
Radius Indiana Regional Snapshot
 
East Central Indiana Regional Snapshot
East Central Indiana Regional SnapshotEast Central Indiana Regional Snapshot
East Central Indiana Regional Snapshot
 
Lake County Data Snapshot
Lake County Data SnapshotLake County Data Snapshot
Lake County Data Snapshot
 
Northwest Indiana Regional Data Snapshot
Northwest Indiana Regional Data SnapshotNorthwest Indiana Regional Data Snapshot
Northwest Indiana Regional Data Snapshot
 
East Central Indiana Regional Data Snapshot
East Central Indiana Regional Data SnapshotEast Central Indiana Regional Data Snapshot
East Central Indiana Regional Data Snapshot
 
North Central Indiana Regional Data Snapshot
North Central Indiana Regional Data SnapshotNorth Central Indiana Regional Data Snapshot
North Central Indiana Regional Data Snapshot
 
Pulaski County SnapShot
Pulaski County SnapShotPulaski County SnapShot
Pulaski County SnapShot
 
Perry County Snapshot
Perry County SnapshotPerry County Snapshot
Perry County Snapshot
 
Lake County Snapshot
Lake County SnapshotLake County Snapshot
Lake County Snapshot
 
Boone County Snapshot
Boone County SnapshotBoone County Snapshot
Boone County Snapshot
 

Recently uploaded

Business update Q1 2024 Lar España Real Estate SOCIMI
Business update Q1 2024 Lar España Real Estate SOCIMIBusiness update Q1 2024 Lar España Real Estate SOCIMI
Business update Q1 2024 Lar España Real Estate SOCIMI
AlejandraGmez176757
 
一比一原版(CU毕业证)卡尔顿大学毕业证成绩单
一比一原版(CU毕业证)卡尔顿大学毕业证成绩单一比一原版(CU毕业证)卡尔顿大学毕业证成绩单
一比一原版(CU毕业证)卡尔顿大学毕业证成绩单
yhkoc
 
Opendatabay - Open Data Marketplace.pptx
Opendatabay - Open Data Marketplace.pptxOpendatabay - Open Data Marketplace.pptx
Opendatabay - Open Data Marketplace.pptx
Opendatabay
 
一比一原版(YU毕业证)约克大学毕业证成绩单
一比一原版(YU毕业证)约克大学毕业证成绩单一比一原版(YU毕业证)约克大学毕业证成绩单
一比一原版(YU毕业证)约克大学毕业证成绩单
enxupq
 
standardisation of garbhpala offhgfffghh
standardisation of garbhpala offhgfffghhstandardisation of garbhpala offhgfffghh
standardisation of garbhpala offhgfffghh
ArpitMalhotra16
 
Empowering Data Analytics Ecosystem.pptx
Empowering Data Analytics Ecosystem.pptxEmpowering Data Analytics Ecosystem.pptx
Empowering Data Analytics Ecosystem.pptx
benishzehra469
 
【社内勉強会資料_Octo: An Open-Source Generalist Robot Policy】
【社内勉強会資料_Octo: An Open-Source Generalist Robot Policy】【社内勉強会資料_Octo: An Open-Source Generalist Robot Policy】
【社内勉強会資料_Octo: An Open-Source Generalist Robot Policy】
NABLAS株式会社
 
一比一原版(UVic毕业证)维多利亚大学毕业证成绩单
一比一原版(UVic毕业证)维多利亚大学毕业证成绩单一比一原版(UVic毕业证)维多利亚大学毕业证成绩单
一比一原版(UVic毕业证)维多利亚大学毕业证成绩单
ukgaet
 
Sample_Global Non-invasive Prenatal Testing (NIPT) Market, 2019-2030.pdf
Sample_Global Non-invasive Prenatal Testing (NIPT) Market, 2019-2030.pdfSample_Global Non-invasive Prenatal Testing (NIPT) Market, 2019-2030.pdf
Sample_Global Non-invasive Prenatal Testing (NIPT) Market, 2019-2030.pdf
Linda486226
 
一比一原版(UofM毕业证)明尼苏达大学毕业证成绩单
一比一原版(UofM毕业证)明尼苏达大学毕业证成绩单一比一原版(UofM毕业证)明尼苏达大学毕业证成绩单
一比一原版(UofM毕业证)明尼苏达大学毕业证成绩单
ewymefz
 
Innovative Methods in Media and Communication Research by Sebastian Kubitschk...
Innovative Methods in Media and Communication Research by Sebastian Kubitschk...Innovative Methods in Media and Communication Research by Sebastian Kubitschk...
Innovative Methods in Media and Communication Research by Sebastian Kubitschk...
correoyaya
 
Investigate & Recover / StarCompliance.io / Crypto_Crimes
Investigate & Recover / StarCompliance.io / Crypto_CrimesInvestigate & Recover / StarCompliance.io / Crypto_Crimes
Investigate & Recover / StarCompliance.io / Crypto_Crimes
StarCompliance.io
 
SOCRadar Germany 2024 Threat Landscape Report
SOCRadar Germany 2024 Threat Landscape ReportSOCRadar Germany 2024 Threat Landscape Report
SOCRadar Germany 2024 Threat Landscape Report
SOCRadar
 
一比一原版(UPenn毕业证)宾夕法尼亚大学毕业证成绩单
一比一原版(UPenn毕业证)宾夕法尼亚大学毕业证成绩单一比一原版(UPenn毕业证)宾夕法尼亚大学毕业证成绩单
一比一原版(UPenn毕业证)宾夕法尼亚大学毕业证成绩单
ewymefz
 
一比一原版(ArtEZ毕业证)ArtEZ艺术学院毕业证成绩单
一比一原版(ArtEZ毕业证)ArtEZ艺术学院毕业证成绩单一比一原版(ArtEZ毕业证)ArtEZ艺术学院毕业证成绩单
一比一原版(ArtEZ毕业证)ArtEZ艺术学院毕业证成绩单
vcaxypu
 
Malana- Gimlet Market Analysis (Portfolio 2)
Malana- Gimlet Market Analysis (Portfolio 2)Malana- Gimlet Market Analysis (Portfolio 2)
Malana- Gimlet Market Analysis (Portfolio 2)
TravisMalana
 
一比一原版(CBU毕业证)不列颠海角大学毕业证成绩单
一比一原版(CBU毕业证)不列颠海角大学毕业证成绩单一比一原版(CBU毕业证)不列颠海角大学毕业证成绩单
一比一原版(CBU毕业证)不列颠海角大学毕业证成绩单
nscud
 
Predicting Product Ad Campaign Performance: A Data Analysis Project Presentation
Predicting Product Ad Campaign Performance: A Data Analysis Project PresentationPredicting Product Ad Campaign Performance: A Data Analysis Project Presentation
Predicting Product Ad Campaign Performance: A Data Analysis Project Presentation
Boston Institute of Analytics
 
哪里卖(usq毕业证书)南昆士兰大学毕业证研究生文凭证书托福证书原版一模一样
哪里卖(usq毕业证书)南昆士兰大学毕业证研究生文凭证书托福证书原版一模一样哪里卖(usq毕业证书)南昆士兰大学毕业证研究生文凭证书托福证书原版一模一样
哪里卖(usq毕业证书)南昆士兰大学毕业证研究生文凭证书托福证书原版一模一样
axoqas
 
一比一原版(RUG毕业证)格罗宁根大学毕业证成绩单
一比一原版(RUG毕业证)格罗宁根大学毕业证成绩单一比一原版(RUG毕业证)格罗宁根大学毕业证成绩单
一比一原版(RUG毕业证)格罗宁根大学毕业证成绩单
vcaxypu
 

Recently uploaded (20)

Business update Q1 2024 Lar España Real Estate SOCIMI
Business update Q1 2024 Lar España Real Estate SOCIMIBusiness update Q1 2024 Lar España Real Estate SOCIMI
Business update Q1 2024 Lar España Real Estate SOCIMI
 
一比一原版(CU毕业证)卡尔顿大学毕业证成绩单
一比一原版(CU毕业证)卡尔顿大学毕业证成绩单一比一原版(CU毕业证)卡尔顿大学毕业证成绩单
一比一原版(CU毕业证)卡尔顿大学毕业证成绩单
 
Opendatabay - Open Data Marketplace.pptx
Opendatabay - Open Data Marketplace.pptxOpendatabay - Open Data Marketplace.pptx
Opendatabay - Open Data Marketplace.pptx
 
一比一原版(YU毕业证)约克大学毕业证成绩单
一比一原版(YU毕业证)约克大学毕业证成绩单一比一原版(YU毕业证)约克大学毕业证成绩单
一比一原版(YU毕业证)约克大学毕业证成绩单
 
standardisation of garbhpala offhgfffghh
standardisation of garbhpala offhgfffghhstandardisation of garbhpala offhgfffghh
standardisation of garbhpala offhgfffghh
 
Empowering Data Analytics Ecosystem.pptx
Empowering Data Analytics Ecosystem.pptxEmpowering Data Analytics Ecosystem.pptx
Empowering Data Analytics Ecosystem.pptx
 
【社内勉強会資料_Octo: An Open-Source Generalist Robot Policy】
【社内勉強会資料_Octo: An Open-Source Generalist Robot Policy】【社内勉強会資料_Octo: An Open-Source Generalist Robot Policy】
【社内勉強会資料_Octo: An Open-Source Generalist Robot Policy】
 
一比一原版(UVic毕业证)维多利亚大学毕业证成绩单
一比一原版(UVic毕业证)维多利亚大学毕业证成绩单一比一原版(UVic毕业证)维多利亚大学毕业证成绩单
一比一原版(UVic毕业证)维多利亚大学毕业证成绩单
 
Sample_Global Non-invasive Prenatal Testing (NIPT) Market, 2019-2030.pdf
Sample_Global Non-invasive Prenatal Testing (NIPT) Market, 2019-2030.pdfSample_Global Non-invasive Prenatal Testing (NIPT) Market, 2019-2030.pdf
Sample_Global Non-invasive Prenatal Testing (NIPT) Market, 2019-2030.pdf
 
一比一原版(UofM毕业证)明尼苏达大学毕业证成绩单
一比一原版(UofM毕业证)明尼苏达大学毕业证成绩单一比一原版(UofM毕业证)明尼苏达大学毕业证成绩单
一比一原版(UofM毕业证)明尼苏达大学毕业证成绩单
 
Innovative Methods in Media and Communication Research by Sebastian Kubitschk...
Innovative Methods in Media and Communication Research by Sebastian Kubitschk...Innovative Methods in Media and Communication Research by Sebastian Kubitschk...
Innovative Methods in Media and Communication Research by Sebastian Kubitschk...
 
Investigate & Recover / StarCompliance.io / Crypto_Crimes
Investigate & Recover / StarCompliance.io / Crypto_CrimesInvestigate & Recover / StarCompliance.io / Crypto_Crimes
Investigate & Recover / StarCompliance.io / Crypto_Crimes
 
SOCRadar Germany 2024 Threat Landscape Report
SOCRadar Germany 2024 Threat Landscape ReportSOCRadar Germany 2024 Threat Landscape Report
SOCRadar Germany 2024 Threat Landscape Report
 
一比一原版(UPenn毕业证)宾夕法尼亚大学毕业证成绩单
一比一原版(UPenn毕业证)宾夕法尼亚大学毕业证成绩单一比一原版(UPenn毕业证)宾夕法尼亚大学毕业证成绩单
一比一原版(UPenn毕业证)宾夕法尼亚大学毕业证成绩单
 
一比一原版(ArtEZ毕业证)ArtEZ艺术学院毕业证成绩单
一比一原版(ArtEZ毕业证)ArtEZ艺术学院毕业证成绩单一比一原版(ArtEZ毕业证)ArtEZ艺术学院毕业证成绩单
一比一原版(ArtEZ毕业证)ArtEZ艺术学院毕业证成绩单
 
Malana- Gimlet Market Analysis (Portfolio 2)
Malana- Gimlet Market Analysis (Portfolio 2)Malana- Gimlet Market Analysis (Portfolio 2)
Malana- Gimlet Market Analysis (Portfolio 2)
 
一比一原版(CBU毕业证)不列颠海角大学毕业证成绩单
一比一原版(CBU毕业证)不列颠海角大学毕业证成绩单一比一原版(CBU毕业证)不列颠海角大学毕业证成绩单
一比一原版(CBU毕业证)不列颠海角大学毕业证成绩单
 
Predicting Product Ad Campaign Performance: A Data Analysis Project Presentation
Predicting Product Ad Campaign Performance: A Data Analysis Project PresentationPredicting Product Ad Campaign Performance: A Data Analysis Project Presentation
Predicting Product Ad Campaign Performance: A Data Analysis Project Presentation
 
哪里卖(usq毕业证书)南昆士兰大学毕业证研究生文凭证书托福证书原版一模一样
哪里卖(usq毕业证书)南昆士兰大学毕业证研究生文凭证书托福证书原版一模一样哪里卖(usq毕业证书)南昆士兰大学毕业证研究生文凭证书托福证书原版一模一样
哪里卖(usq毕业证书)南昆士兰大学毕业证研究生文凭证书托福证书原版一模一样
 
一比一原版(RUG毕业证)格罗宁根大学毕业证成绩单
一比一原版(RUG毕业证)格罗宁根大学毕业证成绩单一比一原版(RUG毕业证)格罗宁根大学毕业证成绩单
一比一原版(RUG毕业证)格罗宁根大学毕业证成绩单
 

County Profile Template Booklet

  • 1. Data SnapShot Series 1.0 October 2014 DATA SNAPSHOT Lake County
  • 4. 4 Purpose This document provides information and data about Lake County that can be used to guide local decision- making activities. The Data SnapShot showcases a variety of demographic, economic and labor market information that local leaders, community organizations and others can use to gain a better perspective on current conditions and opportunities in their county. To strengthen the value and usability of the information, we showcase the data using a variety of visual tools, such as charts, graphs and tables. In addition, we offer key points about the data as a way of assisting the user with the interpretation of the information presented. Finally, short takeaway messages are offered at the end of each section in order to highlight some of the more salient findings. Introduction section 01
  • 5. 5 About Lake County Introduction section 01 County Background Established 1837 County Seat Crown Point Area 627 sq. mi. Neighboring Counties Jasper, IN Newton, IN Porter, IN Cook, IL Kankakee, IL Will, IL
  • 7. 7 Population change Components of Population Change, 2000- 2012 Total Change 5,572 Natural Increase 26,367 International Migration 4,436 Domestic Migration -22,404 The total population is projected to increase by 3 percent between 2012 and 2020. Demography Sources: STATSIndiana, U.S. Census Bureau – 2000 Decennial Census, 2010 Decennial Census, 2012 Estimates, Estimates of the Components of Resident Population Change section 02 The total population increased by 2 percent between 2000 and 2012. The major contributor to that expansion was natural increase (births minus deaths over that span of time) with a net growth of nearly 26,000 persons. Data on domestic migration (the difference between the number of people moving out of the county versus moving in) shows that out-migration outpaced in- migration by nearly 22,000 people. On the other hand, international migration had a net increase of over 4,400, indicating that the county experienced an influx of new people from outside the U.S. 484,564 496,005 493,618 507,724 2020201220102000 Total population projections
  • 8. 8 6.6% 7.0% 6.2% 6.5% 6.7% 7.6% 5.3% 3.2% 2.5% 6.9% 7.3% 6.1% 6.1% 6.3% 7.1% 4.8% 2.4% 1.4% 9 6 3 0 3 6 9 0-9 10-19 20-29 30-39 40-49 50-59 60-69 70-79 80+ Percent of the PopulationAgeCohort Population pyramids Population pyramids are visual representations of the age distribution of the population by gender. While the male to female ratio of the population did not change dramatically between 2000 and 2012, the distribution of people across the various age categories did change over the two periods of time. Demography Source: U.S. Census Bureau – 2000 Decennial Census and 2012 Annual Population Estimates section 02 The percent of people under 50 years old has decreased for both males and females over the 2000 to 2012 period.Also, the number of 50 and over now stands at nearly 169,000 people (about 34 percent of the population, up from 28 percent in 2000). Male Female 2012 7.2% 7.3% 6.5% 7.2% 8.0% 5.8% 4.1% 3.6% 2.1% 7.5% 7.7% 6.2% 6.7% 7.5% 5.4% 3.5% 2.6% 1.1% 9 6 3 0 3 6 9 00-09 10-19 20-29 30-39 40-49 50-59 60-69 70-79 80+ Percent of the Population AgeCohort 2000 Male Female
  • 9. 9 Race The number of non-White residents in Lake County increased by 5 percentage points between 2000 and 2012. While every race other thanWhite experienced a numerical increase, the population of Asian, Other and Mixed Descent races gained the most people, expanding from 33 percent to 38 percent of the total population between 2000 and 2012. Demography Race Data Source: U.S. Census Bureau – 2000 Decennial Census and 2012 ACS section 02 White 67% Oth… 2000 Black Asian Native Other Mixed White 62% Other 38% 2012 Black Asian Native Other Mixed
  • 10. 10 Ethnicity Hispanics are individuals of any race whose ancestry is from Mexico, Puerto Rico, Cuba, Spain, the Dominican Republic or any other Spanish-speaking Central or South American country. There were 59,128 residing in Lake County in 2000.This figure expanded to 82,652 by 2012, a 39.7 percent increase. As a result, Hispanics now make up 17 percent of the overall population (versus 12 percent in 2000). Demography Source: U.S. Census Bureau – 2000 Decennial Census and 2012 ACS section 02 17% 12% Hispanics - 2000 Hispanics - 2012
  • 11. 11 Educational attainment Demography Source: U.S. Census Bureau – 2000 Decennial Census and 2012 ACS section 02 No High School 14% High School 36% Some College 32% College 18% 2012 No High School 20% High School 37% Some College 28% College 15% 2000Educational attainment for adults 18 years of age and older in Lake County is increasing. The proportion of adults (18 years of age and older) with a high school education or more improved from 80 percent in 2000 to 86 percent by 2012. The percentage with less than a high school education fell by 6 percent between 2000 and 2012 (from 20 percent to 14 percent). On the other hand, those with some college education grew from 28 percent to 32 percent. The number of adults with a bachelor’s degree or more was18 percent in 2012, a slight increase compared to 2000.
  • 12. 12 Takeaways The population of Lake County is expected to grow modestly over the next few years, and if past trends hold, that increase will be largely due to natural increase (more births than deaths). While Lake County’s population has been growing over the 2000 to 2012 period, it has also been aging. In addition, its population has declined by nearly 22,000 people due to domestic out-migration, suggesting that young individuals and those of prime working age (20-39 years of age) are moving out of the county at a faster pace than they are moving in. The educational level of the population has increased and the county has become more diverse by race and ethnicity since 2000. In order to achieve a balanced ratio of working-age individuals and dependents (minors and elderly), Lake County should explore what mix of services and amenities will retain and attract educated young adults. Demography section 02
  • 14. 14 Establishments Components of Change for Establishments Total Change (2000-11) 16,143 Natural Change (births minus deaths) 15,755 Net Migration 388 The number of establishments in Lake County doubled between 2000 and 2011. The rapid growth of establishments was largely due to natural change.That is, 35,600 establishments were launched in the county between 2000 and 2011, while 19,800 closed, resulting in a gain of 15,755 establishments. Economy Source: National Establishment Time Series (NETS) – 2011 Database section 03 An establishment is a physical business location. Branches, standalones and headquarters are all considered types of establishments. Definition of Company Stages 0 1 2 3 4 Self- employed 2-9 employees 10-99 employees 100-499 employees 500+ employees
  • 15. 15 Number of establishments by stage/employment category Economy Source: National Establishment Time Series (NETS) – 2011 Database section 03 2000 2011 Stage Establishments Proportion Establishments Proportion Stage 0 3,256 20% 10,058 30% Stage 1 9,314 57% 18,911 58% Stage 2 3,501 21% 3,260 10% Stage 3 257 1% 256 1% Stage 4 46 1% 32 1% Total 16,374 100% 32,517 100%
  • 16. 16 Number of jobs by stage/employment category Economy Source: National Establishment Time Series (NETS) – 2011 Database section 03 2000 2011 Stage Jobs Proportion Jobs Proportion Stage 0 3,256 1% 10,058 4% Stage 1 35,916 16% 56,994 25% Stage 2 87,716 39% 82,048 36% Stage 3 43,486 19% 42,370 19% Stage 4 56,055 25% 36,882 16% Total 226,429 100% 228,352 100%
  • 17. 17 Amount of sales by stage/employment category Economy Source: National Establishment Time Series (NETS) – 2011 Database section 03 2000 2011 Stage Sales Proportion Sales Proportion Stage 0 $319,631,826 1% $673,636,676 3% Stage 1 $4,008,852,759 15% $4,719,109,243 21% Stage 2 $9,024,364,231 34% $7,949,058,309 35% Stage 3 $5,158,581,200 20% $5,877,793,166 26% Stage 4 $7,734,249,838 29% $3,526,973,814 16% Total $26,245,679,854 100% $22,746,571,208 100%
  • 18. 18 Top five industries in 2012 55.6 percent of jobs are tied to one of the top five industries in Lake County Health Care & Social Assistance is the largest industry sector (34,824 jobs). Accommodation and Food Services is the smallest of the top industry sectors with 18,124 jobs. Economy Source: Economic Modeling Specialists International (EMSI) – Complete Employment section 03 Health Care & Social Assistance 14.4% Government 11.9% Retail Trade 11.3% Manufacturing 10.5% Accommodation & Food Services… All Other Industries 44.4%
  • 19. 19 Industry distribution and change NAICS Code Description Jobs 2012 % Change (2002-2012) Earnings 2013 11 Agriculture, Forestry, Fishing and Hunting 639 -10.9% $18,551 21 Mining, Quarrying and Oil and Gas Extraction 176 -27.9% $107,293 22 Utilities 1,730 1.7% $126,479 23 Construction 17,788 25.1% $85,919 31-33 Manufacturing 25,290 -11.7% $107,534 42 Wholesale Trade 6,076 -13.3% $66,946 44-45 Retail Trade 27,407 -4.9% $26,118 48-49 Transportation and Warehousing 10,842 20.7% $53,948 51 Information 1,935 -23.3% $43,244 52 Finance and Insurance 7,201 3.1% $42,461 53 Real Estate and Rental and Leasing 8,339 23.7% $23,385 54 Professional, Scientific and Technical Services 8,829 4.4% $46,116 55 Management of Companies and Enterprises 1,793 36.8% $99,665 56 Administrative and Waste Management 11,827 1.0% $27,577 61 Educational Services (Private) 4,541 56.9% $26,907 62 Health Care and Social Assistance 34,824 20.1% $48,699 71 Arts, Entertainment and Recreation 7,652 -17.1% $28,730 72 Accommodation and Food Services 18,134 17.4% $15,376 81 Other Services (except Public Administration) 18,049 25.9% $20,526 90 Government 28,830 -3.7% $48,730 99 Unclassified Industry <10 - $54,835 All Total 241,901 - $48,711 Economy Source: Economic Modeling Specialists International (EMSI) – 2013.2 Complete Employment section 03
  • 20. 20 Industry distribution and change The largest employment gains in Lake County occurred in:  Private Educational Services (+56.9 percent)  Management of Companies and Enterprises (+36.8 percent) The largest employment losses occurred in:  Mining,Quarrying and Oil andGas Extraction (-27.9 percent)  Information (-23.3 percent) Economy Source: Economic Modeling Specialists International (EMSI) – 2013.2 Complete Employment section 03 Employment Increase Employment Decrease Changes in the top five industry sectors (2002-2012): HealthCare & Social Assistance Accommodation & Food Services Government RetailTrade Manufacturing
  • 21. 21 Office & Administrative Support… Sales & Related 12% Food Preparation & Serving… Transportation & Material Moving 7% Production 7% All Other Occupations 53% Top five occupations in 2012 The top five occupations in Lake County represent 47.3 percent of all jobs. Office andAdministrative Support and Sales and Related are the occupations with the largest number of workers. Production occupations is the smallest of the top five occupations in the county (7 percent of jobs). Economy Source: Economic Modeling Specialists International (EMSI) – 2013.2 Complete Employment section 03
  • 22. 22 SOC Description Jobs 2012 % Change (2002-2012) Hourly Earnings 2013 11 Management 10,733 7.4% $33.50 13 Business and Financial Operations 7,811 12.3% $26.86 15 Computer and Mathematical 1,903 -2.0% $28.88 17 Architecture and Engineering 2,882 -3.4% $35.56 19 Life, Physical and Social Science 1,440 16.7% $28.99 21 Community and Social Service 3,070 9.1% $19.00 23 Legal 1,730 1.9% $45.03 25 Education, Training and Library 12,273 11.0% $20.72 27 Arts, Design, Entertainment, Sports and Media 4,752 7.3% $14.79 29 Health Care Practitioners and Technical 14,845 12.4% $32.61 31 Health Care Support 7,494 25.0% $12.47 33 Protective Service 5,396 -8.8% $17.47 35 Food Preparation and Serving Related 19,388 9.6% $9.68 37 Building and Grounds Cleaning Maintenance 8,978 11.4% $11.18 39 Personal Care and Service 15,346 42.0% $10.15 41 Sales and Related 30,286 -0.6% $14.22 43 Office and Administrative Support 30,468 -4.8% $15.13 45 Farming, Fishing and Forestry 224 -10.4% $11.51 47 Construction and Extraction 14,682 18.1% $25.89 49 Installation, Maintenance and Repair 11,186 3.1% $22.67 51 Production 15,967 -8.9% $20.78 53 Transportation and Material Moving 18,194 1.0% $18.01 55 Military 1,672 4.1% $19.39 99 Unclassified 1,181 25.5% $11.18 All Total 241,901 100% $18.91 Occupation distribution and change Economy Source: Economic Modeling Specialists International (EMSI) – 2013.2 Complete Employment section 03
  • 23. 23 Occupation distribution and change Economy Source: Economic Modeling Specialists International (EMSI) – 2013.2 Complete Employment section 03 The largest percentage gains in jobs in Lake County occurred in:  Personal Care & Service (+42.0 percent)  Health Care Support (+25.0 percent) The largest percentage loss in employment occurred in:  Farming, Fishing & Forestry (-10.4 percent)  Production (-8.9 percent) Changes in the top five occupations (2002- 2012): Food Preparation & Serving Transportation & Material Moving Sales & Related Office & Administrative Production Employment Increase Employment Decrease
  • 24. 24 Income and poverty 2000 2006 2012 Total Population in Poverty 11.1% 16.7% 19.6% Minors (up to age 17) in Poverty 15.6% 26.5% 31.3% Real Median Income (2012) $53,734 $52,327 $48,015 The median income in Lake County dipped by $5,700 between 2000 and 2012. Both the total population in poverty and the number of minors in poverty increased. The number of minors in poverty doubled between 2000 and 2012. Economy Source: U.S. Census Bureau – Small Area Income and Poverty Estimates (SAIPE) section 03
  • 25. 25 Income and poverty Median income in Lake County has decreased in recent years, while poverty has continued to increase. Economy Source: U.S. Census Bureau – Small Area Income and Poverty Estimates (SAIPE) section 03 0 5 10 15 20 25 30 35 25,000 30,000 35,000 40,000 45,000 50,000 55,000 60,000 PopulationinPoverty(percent) RealMedianIncomein2012(dollars) Median Income Minors in Poverty All Ages in Poverty
  • 26. 26 Takeaways All establishment growth in Lake County occurred in businesses having fewer than 10 employees. So, focusing on the needs of the self-employed (Stage 0) and start-ups (Stage 1) establishments may be worthwhile. The food industry, health care, management, education and transportation are employment growth areas for Lake County.These are industries and occupations that demand workers with varying educational levels. Median income has decreased and poverty has increased in Lake County since 2000. Lake County might focus on policies and programs that strengthen high-growth Stage 2 firms since they employ several people and capture sizable sales. Promoting job growth for occupations requiring educated workers could help retain adults with higher educational attainment and help increase median income. Services targeted to poverty-stricken individuals should be considered given the dramatic rise in poverty, especially among children under 18 years old. Economy section 03
  • 28. 28 Labor force and unemployment 2002 2012 Labor Force 227,989 220,793 Unemployment Rate 6.4% 9.2% The labor force in Lake County decreased by 3.1 percent between 2002 and 2012. This decrease is likely due to a rise in the number of individuals who are either officially unemployed or who have given up looking for a job. Labor market Source: U.S. Bureau of Labor Statistics – Local Area Unemployment Statistics section 04
  • 29. 29 Unemployment rate Between 2002 and 2012, the unemployment rate in Lake County peaked at 10.9 percent in 2010. Labor market Source: U.S. Bureau of Labor Statistics – Local Area Unemployment Statistics section 04 3.6% 6.4% 5.2% 10.9% 9.2% 0.0 2.0 4.0 6.0 8.0 10.0 12.0 UnemploymentRate(%) Year
  • 30. 30 Commuteshed A county’s commuteshed is the geographic area to which its work force travels to work. Forty-one percent of employed residents in Lake County commute to jobs located outside of Lake County. The top commuteshed counties for Lake County residents who work outside of the county are Cook County, Illinois, and Porter County, Indiana. Labor market Source: U.S. Census Bureau – Longitudinal Employer-Household Dynamics (LEHD) section 04 83,806 Out-Commuters 120,585 Same Work/ Home Commuters Proportion Cook, IL 39,960 19.6% Porter, IN 11,061 5.4% Marion, IN 5,295 2.6% Will, IL 3,341 1.6% DuPage, IL 3,156 1.5%
  • 31. 31 Laborshed Commuters Proportion Porter, IN 25,554 13.2% Cook, IL 14,026 7.2% La Porte, IN 4,685 2.4% Jasper, IN 3,131 1.6% Marion, IN 2,527 1.3% Labor market Source: U.S. Census Bureau – Longitudinal Employer-Household Dynamics (LEHD) section 04 72,982 In-Commuters 120,585 Same Work/ Home A county’s laborshed is the geographic area from which it draws employees. Thirty-eight percent of individuals working in Lake County commute from another county for work. Porter County, Indiana, and Cook County, Illinois, are the biggest sources of outside labor for Lake County. Sixty-four percent of in-commuters reside in counties adjacent to Lake County; however, the fifth largest laborshed county is the Indianapolis metropolitan area (Marion County, Indiana).
  • 32. 32 Commuteshed in 2011 Labor market section 04 Source: U.S. Census Bureau, OTM, LEHD, PCRD Eighty percent of Lake County’s working residents are employed either in Lake or Cook Counties. Another 5 percent commute to Porter, while an additional 5 percent travel to jobs in DuPage, Will, LaPorte or Marion Counties Collectively, these seven counties represent 90 percent of the commuteshed for Lake County.
  • 33. 33 Laborshed in 2011 Labor market section 04 Source: U.S. Census Bureau, OTM, LEHD, PCRD The bulk (80 percent) of Lake County’s workforce is drawn from Lake and Porter Counties. Another 5 percent is drawn from LaPorte County in Indiana and Cook County in Illinois. An additional 5 percent comes from Will County in Illinois and Saint Joseph, Jasper and Marion Counties in Indiana. Combined, the eight counties represent 90 percent of Lake County’s laborshed.
  • 34. 34 Takeaways Lake County’s unemployment rate has increased since 2002.The majority of this increase occurred during the period of the Great Recession (approximately 2009 to 2010). Despite population increases, the county’s labor force has decreased since 2002, indicating that there may be an increasing number of individuals who are unemployed or are discouraged workers (workers who have given up trying to find a job). Employees that work but do not live in Lake County tend to commute from surrounding counties. People who commute out of the county for work tend to travel to other metropolitan areas. Lake County should assess if a major workforce development training effort should be targeted to the growing number of working age adults struggling to find jobs. The laborshed and commuteshed data offer solid evidence of the value of pursuing economic and workforce development on a regional (multi- county) basis. Labor market section 04
  • 35. 35 . Report Contributors This report was prepared by the Purdue Center for Regional Development in partnership with Purdue University Extension. Labor market section 04 Data Analysis Indraneel Kumar, Ph.D. Ayoung Kim Report Authors Elizabeth Dobis Bo Beaulieu, Ph.D. Report Design Tyler Wright Adeline Jackson It is the policy of the Purdue University Cooperative Extension Service that all persons have equal opportunity and access to its educational programs, services, activities, and facilities without regard to race, religion, color, sex, age, national origin or ancestry, marital status, parental status, sexual orientation, disability or status as a veteran. Purdue University is an Affirmative Action institution. This material may be available in alternative formats.
  • 36. FOR MORE INFORMATION Purdue Center for Regional Development (PCRD) . . . seeks to pioneer new ideas and strategies that contribute to regional collaboration, innovation and prosperity. Purdue Extension Community Development (CD) . . . works to strengthen the capacity of local leaders, residents and organizations to work together to develop and sustain strong, vibrant communities. OR Please contact Janet Reed Extension Educator 219-755-3240 reedjm@purdue.edu