Download to read offline


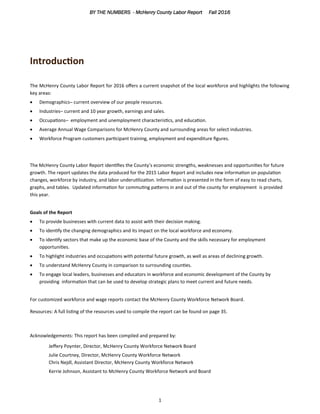
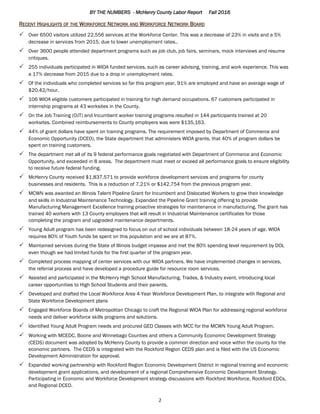
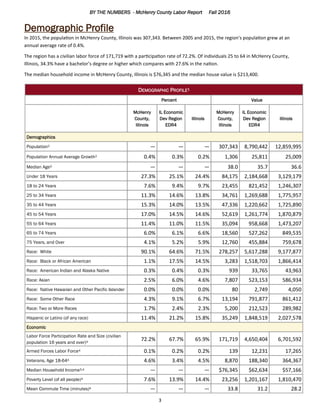
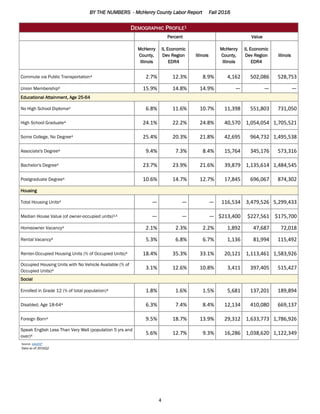

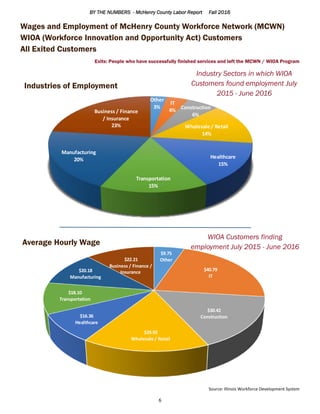
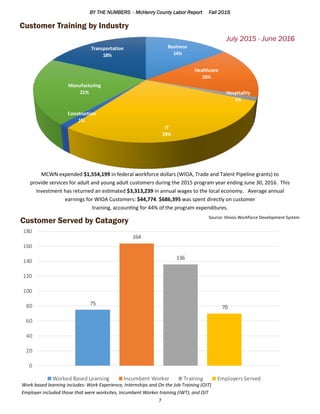


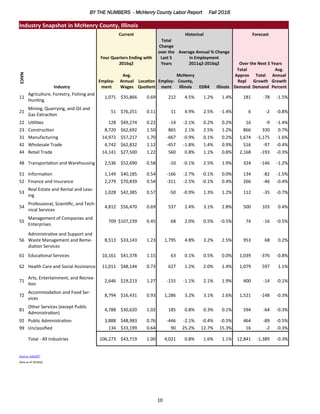


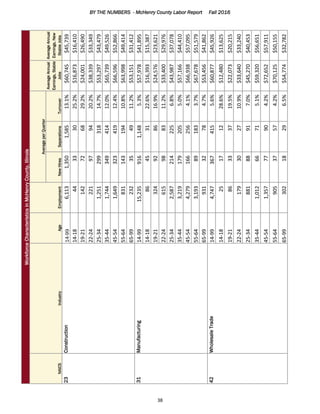


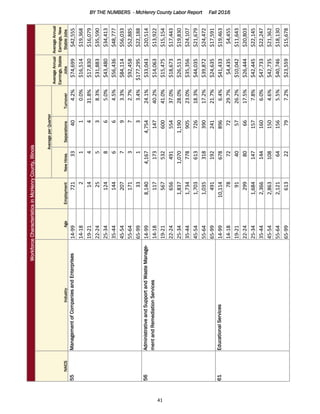


The document provides an overview of workforce and economic statistics for McHenry County, Illinois. It includes demographic data on population, age, race, income levels. Industry data covers employment levels, average wages, and growth trends over 10 years. Workforce data such as labor force participation rates, unemployment rates, commuting patterns, and educational attainment are analyzed. The report also highlights outcomes of the county's workforce programs and expenditures. Real estate activity and home prices in the county saw increases over the past year.


