NORMAL
DISTRIBUTION
The
Learning Objectives:
Illustrate a normal random variable and its properties;
Construct a normal curve; and
Identify regions under the normal curve corresponding
to different standard normal variables.
2
Normal
An 18th century
statistician, first developed
the normal distribution as
an approximation to the
binomial distribution.
3
Distribution
The
𝑨𝒃𝒓𝒂𝒉𝒂𝒎 𝒅𝒆 𝑴𝒐𝒊𝒗𝒓𝒆
Normal
He developed the concept
of the normal curve from
his study of errors of
repeated measurements of
objects.
4
Distribution
The
𝑲𝒂𝒓𝒍 𝑭𝒓𝒊𝒆𝒅𝒓𝒊𝒄𝒉 𝑮𝒂𝒖𝒔𝒔
Normal
The normal distribution, also
known as Gaussian Distribution, it
is the normal curve of errors and
has the following formula:
5
Distribution
The
𝑷 𝒙 =
𝟏
𝝈 𝟐𝝅
𝒆
−
𝒙−𝝁 𝟐
𝟐𝝈𝟐
Characteristics
6
The
A bell-shaped curve.
It is symmetrical, unimodal, and asymptotic to
the horizontal axis.
Areas = Probability
Total Areas = 1 or 100%
Center = mean, median, and mode.
Width = standard deviation.
Characteristics
Inflection Point
Curve changes shape at the inflection points: in other words,
the curve changes concavity.
A curve that is concave up looks like a u-shape.
A curve that is concave down looks like a n-shape.
The two inflection points occur ±1 standard deviation away
from the mean 𝜇 − 𝜎 𝑎𝑛𝑑 𝜇 + 𝜎 .
7
The
Standard
If the mean 𝝁 is zero and the standard
deviation 𝝈 is 𝟏, then the normal
distribution is a standard normal
distribution.
8
Distribution
The
Normal
𝑵𝒐𝒓𝒎𝒂𝒍 𝑪𝒖𝒓𝒗𝒆𝒔
The
Same Standard
Deviations but
Different Means
Same Means
but Different
Standard
Deviations Different Means and
Standard Deviations
Normal Distribution
𝒙
𝒇(𝒙)
𝝁
𝝈
Changing 𝝁 shifts the
distribution left or right.
Changing 𝝈 increases
or decreases the
spread.
The
Areas Under
Areas under the standard normal curve
can be found using the Areas under the
Standard Normal Curve table. These
areas are regions under the normal
curve. The table for the areas under the
normal curve gives areas from z = 0.
11
the Normal
Curve
𝟔𝟖%
𝟗𝟓%
𝟗𝟗. 𝟕%
𝟔𝟖 − 𝟗𝟓 − 𝟗𝟗. 𝟕 Rule
The
Normal Distribution
The
Areas Under
Example 1:
Find the area between 𝑧 = 0 and 𝑧 = 1.54.
14
the Normal
Curve
Sketch the normal curve. Locate the area for z =
1.54 from the table. Proceed down the column
marked z until you reach 1.5. Then proceed to the
right along this row until you reach the column
marked 0.04. The intersection of the row that
contains 1.5 and the column marked 0.04 is the
area.
1.54
Thus, the area is 0.4382 or 43.82%
(A = 0.4382)
Example 2:
Find the area between 𝑧 = 1.52 and 𝑧 = 2.5.
15
1.52 2.5
Find 𝐴1 and 𝐴2:
𝐴1 = 𝑏𝑒𝑡𝑤𝑒𝑒𝑛 0 𝑎𝑛𝑑 1.52 = 0.4357
𝐴2 = between 0 and 2.5 = 0.4938
𝐴 = 𝐴2 − 𝐴1
𝐴 = 0.4938 − 0.4357
𝑨 = 𝟎. 𝟎𝟓𝟖𝟏 𝒐𝒓 𝟓. 𝟖𝟏%
Example 3:
Find the area to the right of 𝑧 = 1.56
1.56
Find 𝐴1 and 𝐴2:
𝐴1 = 𝑏𝑒𝑡𝑤𝑒𝑒𝑛 0 𝑎𝑛𝑑 1.56 = 0.4406
𝐴2 = half of curve right side = 0.5
𝐴 = 𝐴2 − 𝐴1
𝐴 = 0.5 − 0.4406
𝑨 = 𝟎. 𝟎𝟓𝟗𝟒 𝒐𝒓 𝟓. 𝟗𝟒%
Example 4:
Find the area between 𝑧 = 0 and 𝑧 = −1.65.
16
Find the intersection of the row that
contains 1.6 and the column marked
0.05 is the area.
𝑨 = 𝟎. 𝟒𝟓𝟎𝟓 𝒐𝒓 𝟒𝟓. 𝟎𝟓%
Example 5:
Find the area between 𝑧 = −1.5 and 𝑧 = −2.5.
Find 𝐴1 and 𝐴2:
𝐴1 = 𝑏𝑒𝑡𝑤𝑒𝑒𝑛 0 𝑎𝑛𝑑 − 1.5 = 0.4332
𝐴2 = 𝑏𝑒𝑡𝑤𝑒𝑒𝑛 0 𝑎𝑛𝑑 − 2.5 = 0.4938
𝐴 = 𝐴2 − 𝐴1
𝐴 = 0.4938 − 0.4332
𝑨 = 𝟎. 𝟎𝟔𝟎𝟔 𝒐𝒓 𝟔. 𝟎𝟔%
−1.65
−1.5
−2.5
Example 6:
Find the area between 𝑧 = −1.35 and 𝑧 = 2.95.
17
Find 𝐴1 and 𝐴2:
𝐴1 = 𝑏𝑒𝑡𝑤𝑒𝑒𝑛 0 𝑎𝑛𝑑 − 1.35 = 0.4115
𝐴2 = 𝑏𝑒𝑡𝑤𝑒𝑒𝑛 0 𝑎𝑛𝑑 2.95 = 0.4984
𝐴 = 𝐴2 + 𝐴1
𝐴 = 0.4984 + 0.4115
𝑨 = 𝟎. 𝟗𝟎𝟗𝟗 𝒐𝒓 𝟗𝟎. 𝟗𝟗%
Example 7:
Find the area to the left of 𝑧 = 2.32.
Find 𝐴1 and 𝐴2:
𝐴1 = 𝑏𝑒𝑡𝑤𝑒𝑒𝑛 0 𝑎𝑛𝑑 2.32 = 0.4898
𝐴2 = half of curve left side = 0.5
𝐴 = 𝐴2 + 𝐴1
𝐴 = 0.5 + 0.4898
𝑨 = 𝟎. 𝟗𝟖𝟗𝟖 𝒐𝒓 𝟗𝟖. 𝟗𝟖%
−1.35
2.32
2.95
Example 8:
Find the area to the right of 𝑧 = −1.8.
18
Find 𝐴1 and 𝐴2:
𝐴1 = 𝑏𝑒𝑡𝑤𝑒𝑒𝑛 0 𝑎𝑛𝑑 − 1.8 = 0.4641
𝐴2 = half of curve left side = 0.5
𝐴 = 𝐴2 − 𝐴1
𝐴 = 0.5 − 0.4641
𝑨 = 𝟎. 𝟎𝟑𝟓𝟗 𝒐𝒓 𝟑. 𝟓𝟗%
Example 9:
Find the area to the left of 𝑧 = −1.52.
Find 𝐴1 and 𝐴2:
𝐴1 = 𝑏𝑒𝑡𝑤𝑒𝑒𝑛 0 𝑎𝑛𝑑 − 1.52 = 0.4357
𝐴2 = half of curve right side = 0.5
𝐴 = 𝐴2 + 𝐴1
𝐴 = 0.5 + 0.4357
𝑨 = 𝟎. 𝟗𝟑𝟓𝟕 𝒐𝒓 𝟗𝟑. 𝟓𝟕%
−1.8
−1.52
RULES
19
𝑧+ 𝑎𝑛𝑑 𝑧+ or 𝑧− 𝑎𝑛𝑑 𝑧−, subtract the areas.
𝑧+ 𝑎𝑛𝑑 𝑧− or vice versa, add the areas.
Left of 𝑧+, add 0.5 (50%) to the area.
Right of 𝑧+, subtract the area from 0.5 (50%).
Left of 𝑧−, subtract the area from 0.5 (50%).
Right of 𝑧−, add 0.5 (50%) to the area.
STANDARD
SCORES
Learning Objectives:
The learner will be able to:
Convert a normal random variable to a standard
normal variable and vice versa; and
Compute probabilities using the standard normal table.
21
The standard score or z-score measures how many standard
deviation a given value (𝑥) is above or below the mean.
The z-scores are useful in comparing observed values.
22
Standard Score (𝑧 − 𝑠𝑐𝑜𝑟𝑒)
The
A positive z-score indicates that the score or observed value is
above the mean, whereas a negative z-score indicates that the
score or observed value is below the mean.
The standard score or z-score (For Sample)
23
Standard Score (𝑧 − 𝑠𝑐𝑜𝑟𝑒)
The
𝑧 =
𝑥− ҧ
𝑥
𝑠
where:
𝑧: standard score
x: raw score or observed value
ҧ
𝑥: sample mean
𝑠: sample standard deviation
The standard score or z-score (For Population)
24
Standard Score (𝑧 − 𝑠𝑐𝑜𝑟𝑒)
The
𝑧 =
𝑥−𝜇
𝜎
where:
𝑧: standard score
x: raw score or observed value
𝜇: population mean
𝜎: population standard deviation
Example 1:
On a final examination in Biology, the mean was 75
and the standard deviation was 12. Determine the
standard score of a student who received a score of
60 assuming that the scores are normally
distributed.
25
Standard Score (𝑧 − 𝑠𝑐𝑜𝑟𝑒)
The
Solution:
Given:
ҧ
𝑥 = 75, 𝑠 = 12, 𝑥 = 60
▫ Convert 60 to standard score :
𝑧 =
𝑥 − ҧ
𝑥
𝑠
𝑧 =
60 − 75
12
= −
15
12
𝒛 = −𝟏. 𝟐𝟓
26
−𝟏. 𝟐𝟓
60 75
Thus, 60 is -1.25 standard deviation below the mean.
Example 2:
On the first periodic exam in Statistics, the
population mean was 70 and the population
standard deviation was 9. Determine the standard
score of a student who got a score of 88 assuming
that the scores are normally distributed.
27
Standard Score (𝑧 − 𝑠𝑐𝑜𝑟𝑒)
The
Solution:
Given:
𝜇 = 70, 𝑠 = 9, 𝑥 = 88
▫ Convert 88 to standard score :
𝑧 =
𝑥 − 𝜇
𝑠
𝑧 =
88 − 70
9
=
18
9
𝒛 = 𝟐
28
88
70
Hence, 88 is 2 standard deviation above the mean.
Example 3:
Luz scored 90 in an English test and 70 in a Physics test.
Scores in the English test have a mean of 80 and a
standard deviation of 10. Scores in the Physics test have
a mean of 60 and a standard deviation of 8. In which
subject was her standing better assuming that the scores
in her English and Physics class are normally distributed? 29
Standard Score (𝑧 − 𝑠𝑐𝑜𝑟𝑒)
The
Solution
▫ English
ҧ
𝑥 = 80, 𝑠 = 10, 𝑥 = 90
▫ Convert 90 to standard
score :
𝑧 =
𝑥 − ҧ
𝑥
𝑠
𝑧 =
90 − 80
10
=
10
10
𝒛 = 𝟏
▫ Physics
ҧ
𝑥 = 60, 𝑠 = 8, 𝑥 = 70
▫ Convert 70 to standard
score :
𝑧 =
𝑥 − ҧ
𝑥
𝑠
𝑧 =
70 − 60
8
=
10
8
𝒛 = 𝟏. 𝟐𝟓
30
Therefore, Luz performed better in the Physics subject.
Example 4:
In a Science test, the mean score is 42 and the standard
deviation is 5 . Assuming that the scores are normally
distributed, what percent of the score is
greater than 48?
less than 50?
between 30 and 48? 31
Standard Score (𝑧 − 𝑠𝑐𝑜𝑟𝑒)
The
Solution:
▫ greater than 48?
ҧ
𝑥 = 42, 𝑠 = 5, 𝑥 = 48
▫ Convert 48 to standard
score:
𝑧 =
𝑥 − ҧ
𝑥
𝑠
𝑧 =
48 − 42
5
=
6
5
𝒛 = 𝟏. 𝟐
Find 𝐴1 and 𝐴2:
𝐴1 = 𝑏𝑒𝑡𝑤𝑒𝑒𝑛 0 𝑎𝑛𝑑 1.2 = 0.3849
𝐴2 = half of curve right side = 0.5
𝐴 = 𝐴2 − 𝐴1
𝐴 = 0.5 − 0.3849 = 0.1151
𝑨 = 𝟏𝟏. 𝟓𝟏%
32
𝟏. 𝟐
Hence, 11.51% of the scores are greater than 48.
Solution:
▫ less than 50?
ҧ
𝑥 = 42, 𝑠 = 5, 𝑥 = 50
▫ Convert 50 to standard
score:
𝑧 =
𝑥 − ҧ
𝑥
𝑠
𝑧 =
50 − 42
5
=
8
5
𝒛 = 𝟏. 𝟔
Find 𝐴1 and 𝐴2:
𝐴1 = 𝑏𝑒𝑡𝑤𝑒𝑒𝑛 0 𝑎𝑛𝑑 1.6 = 0.4452
𝐴2 = half of curve left side = 0.5
𝐴 = 𝐴2 + 𝐴1
𝐴 = 0.5 + 0.4452 = 0.9452
𝑨 = 𝟗𝟒. 𝟓𝟐%
33
𝟏. 𝟔
Hence, 94.52% of the scores are less than 50.
Solution:
▫ between 30 and 48?
ҧ
𝑥 = 42, 𝑠 = 5, 𝑥 = 30 and 48
▫ Convert 30 and 48 to
standard scores:
𝑧 =
30 − 42
5
=
−12
5
𝒛 = −𝟐. 𝟒
𝑧 =
48 − 42
5
=
6
5
𝒛 = 𝟏. 𝟐
Find 𝐴1 and 𝐴2:
𝐴1 = 𝑏𝑒𝑡𝑤𝑒𝑒𝑛 0 𝑎𝑛𝑑 − 2.4 = 0.4918
𝐴2 = 𝑏𝑒𝑡𝑤𝑒𝑒𝑛 0 𝑎𝑛𝑑 1.2 = 0.3849
𝐴 = 𝐴2 + 𝐴1
𝐴 = 0.3849 + 0.4918 = 0.8767
𝑨 = 𝟗𝟒. 𝟓𝟐%
34
𝟏. 𝟐
Hence, 87.67% of the scores are between 30 and 48.
−𝟐. 𝟒
Example 5:
The mean height of grade nine students at a certain
high school is 164 centimeters and the standard
deviation is 10 centimeters. Assuming that the
heights are normally distributed, what percent of the
heights is greater than 168 centimeters?
35
Standard Score (𝑧 − 𝑠𝑐𝑜𝑟𝑒)
The
Example 6:
In a Math test, the mean score is 45 and the standard deviation
is 4. Assuming normality, what is the probability that a score
picked at random will lie
above score 50?
below score 38?
36
Standard Score (𝑧 − 𝑠𝑐𝑜𝑟𝑒)
The

NORMAL DISTRIBUTIONS CHAPTER 2 WALLACE AN

  • 1.
  • 2.
    Learning Objectives: Illustrate anormal random variable and its properties; Construct a normal curve; and Identify regions under the normal curve corresponding to different standard normal variables. 2
  • 3.
    Normal An 18th century statistician,first developed the normal distribution as an approximation to the binomial distribution. 3 Distribution The 𝑨𝒃𝒓𝒂𝒉𝒂𝒎 𝒅𝒆 𝑴𝒐𝒊𝒗𝒓𝒆
  • 4.
    Normal He developed theconcept of the normal curve from his study of errors of repeated measurements of objects. 4 Distribution The 𝑲𝒂𝒓𝒍 𝑭𝒓𝒊𝒆𝒅𝒓𝒊𝒄𝒉 𝑮𝒂𝒖𝒔𝒔
  • 5.
    Normal The normal distribution,also known as Gaussian Distribution, it is the normal curve of errors and has the following formula: 5 Distribution The 𝑷 𝒙 = 𝟏 𝝈 𝟐𝝅 𝒆 − 𝒙−𝝁 𝟐 𝟐𝝈𝟐
  • 6.
    Characteristics 6 The A bell-shaped curve. Itis symmetrical, unimodal, and asymptotic to the horizontal axis. Areas = Probability Total Areas = 1 or 100% Center = mean, median, and mode. Width = standard deviation.
  • 7.
    Characteristics Inflection Point Curve changesshape at the inflection points: in other words, the curve changes concavity. A curve that is concave up looks like a u-shape. A curve that is concave down looks like a n-shape. The two inflection points occur ±1 standard deviation away from the mean 𝜇 − 𝜎 𝑎𝑛𝑑 𝜇 + 𝜎 . 7 The
  • 8.
    Standard If the mean𝝁 is zero and the standard deviation 𝝈 is 𝟏, then the normal distribution is a standard normal distribution. 8 Distribution The Normal
  • 9.
    𝑵𝒐𝒓𝒎𝒂𝒍 𝑪𝒖𝒓𝒗𝒆𝒔 The Same Standard Deviationsbut Different Means Same Means but Different Standard Deviations Different Means and Standard Deviations
  • 10.
    Normal Distribution 𝒙 𝒇(𝒙) 𝝁 𝝈 Changing 𝝁shifts the distribution left or right. Changing 𝝈 increases or decreases the spread. The
  • 11.
    Areas Under Areas underthe standard normal curve can be found using the Areas under the Standard Normal Curve table. These areas are regions under the normal curve. The table for the areas under the normal curve gives areas from z = 0. 11 the Normal Curve
  • 12.
    𝟔𝟖% 𝟗𝟓% 𝟗𝟗. 𝟕% 𝟔𝟖 −𝟗𝟓 − 𝟗𝟗. 𝟕 Rule The
  • 13.
  • 14.
    Areas Under Example 1: Findthe area between 𝑧 = 0 and 𝑧 = 1.54. 14 the Normal Curve Sketch the normal curve. Locate the area for z = 1.54 from the table. Proceed down the column marked z until you reach 1.5. Then proceed to the right along this row until you reach the column marked 0.04. The intersection of the row that contains 1.5 and the column marked 0.04 is the area. 1.54 Thus, the area is 0.4382 or 43.82% (A = 0.4382)
  • 15.
    Example 2: Find thearea between 𝑧 = 1.52 and 𝑧 = 2.5. 15 1.52 2.5 Find 𝐴1 and 𝐴2: 𝐴1 = 𝑏𝑒𝑡𝑤𝑒𝑒𝑛 0 𝑎𝑛𝑑 1.52 = 0.4357 𝐴2 = between 0 and 2.5 = 0.4938 𝐴 = 𝐴2 − 𝐴1 𝐴 = 0.4938 − 0.4357 𝑨 = 𝟎. 𝟎𝟓𝟖𝟏 𝒐𝒓 𝟓. 𝟖𝟏% Example 3: Find the area to the right of 𝑧 = 1.56 1.56 Find 𝐴1 and 𝐴2: 𝐴1 = 𝑏𝑒𝑡𝑤𝑒𝑒𝑛 0 𝑎𝑛𝑑 1.56 = 0.4406 𝐴2 = half of curve right side = 0.5 𝐴 = 𝐴2 − 𝐴1 𝐴 = 0.5 − 0.4406 𝑨 = 𝟎. 𝟎𝟓𝟗𝟒 𝒐𝒓 𝟓. 𝟗𝟒%
  • 16.
    Example 4: Find thearea between 𝑧 = 0 and 𝑧 = −1.65. 16 Find the intersection of the row that contains 1.6 and the column marked 0.05 is the area. 𝑨 = 𝟎. 𝟒𝟓𝟎𝟓 𝒐𝒓 𝟒𝟓. 𝟎𝟓% Example 5: Find the area between 𝑧 = −1.5 and 𝑧 = −2.5. Find 𝐴1 and 𝐴2: 𝐴1 = 𝑏𝑒𝑡𝑤𝑒𝑒𝑛 0 𝑎𝑛𝑑 − 1.5 = 0.4332 𝐴2 = 𝑏𝑒𝑡𝑤𝑒𝑒𝑛 0 𝑎𝑛𝑑 − 2.5 = 0.4938 𝐴 = 𝐴2 − 𝐴1 𝐴 = 0.4938 − 0.4332 𝑨 = 𝟎. 𝟎𝟔𝟎𝟔 𝒐𝒓 𝟔. 𝟎𝟔% −1.65 −1.5 −2.5
  • 17.
    Example 6: Find thearea between 𝑧 = −1.35 and 𝑧 = 2.95. 17 Find 𝐴1 and 𝐴2: 𝐴1 = 𝑏𝑒𝑡𝑤𝑒𝑒𝑛 0 𝑎𝑛𝑑 − 1.35 = 0.4115 𝐴2 = 𝑏𝑒𝑡𝑤𝑒𝑒𝑛 0 𝑎𝑛𝑑 2.95 = 0.4984 𝐴 = 𝐴2 + 𝐴1 𝐴 = 0.4984 + 0.4115 𝑨 = 𝟎. 𝟗𝟎𝟗𝟗 𝒐𝒓 𝟗𝟎. 𝟗𝟗% Example 7: Find the area to the left of 𝑧 = 2.32. Find 𝐴1 and 𝐴2: 𝐴1 = 𝑏𝑒𝑡𝑤𝑒𝑒𝑛 0 𝑎𝑛𝑑 2.32 = 0.4898 𝐴2 = half of curve left side = 0.5 𝐴 = 𝐴2 + 𝐴1 𝐴 = 0.5 + 0.4898 𝑨 = 𝟎. 𝟗𝟖𝟗𝟖 𝒐𝒓 𝟗𝟖. 𝟗𝟖% −1.35 2.32 2.95
  • 18.
    Example 8: Find thearea to the right of 𝑧 = −1.8. 18 Find 𝐴1 and 𝐴2: 𝐴1 = 𝑏𝑒𝑡𝑤𝑒𝑒𝑛 0 𝑎𝑛𝑑 − 1.8 = 0.4641 𝐴2 = half of curve left side = 0.5 𝐴 = 𝐴2 − 𝐴1 𝐴 = 0.5 − 0.4641 𝑨 = 𝟎. 𝟎𝟑𝟓𝟗 𝒐𝒓 𝟑. 𝟓𝟗% Example 9: Find the area to the left of 𝑧 = −1.52. Find 𝐴1 and 𝐴2: 𝐴1 = 𝑏𝑒𝑡𝑤𝑒𝑒𝑛 0 𝑎𝑛𝑑 − 1.52 = 0.4357 𝐴2 = half of curve right side = 0.5 𝐴 = 𝐴2 + 𝐴1 𝐴 = 0.5 + 0.4357 𝑨 = 𝟎. 𝟗𝟑𝟓𝟕 𝒐𝒓 𝟗𝟑. 𝟓𝟕% −1.8 −1.52
  • 19.
    RULES 19 𝑧+ 𝑎𝑛𝑑 𝑧+or 𝑧− 𝑎𝑛𝑑 𝑧−, subtract the areas. 𝑧+ 𝑎𝑛𝑑 𝑧− or vice versa, add the areas. Left of 𝑧+, add 0.5 (50%) to the area. Right of 𝑧+, subtract the area from 0.5 (50%). Left of 𝑧−, subtract the area from 0.5 (50%). Right of 𝑧−, add 0.5 (50%) to the area.
  • 20.
  • 21.
    Learning Objectives: The learnerwill be able to: Convert a normal random variable to a standard normal variable and vice versa; and Compute probabilities using the standard normal table. 21
  • 22.
    The standard scoreor z-score measures how many standard deviation a given value (𝑥) is above or below the mean. The z-scores are useful in comparing observed values. 22 Standard Score (𝑧 − 𝑠𝑐𝑜𝑟𝑒) The A positive z-score indicates that the score or observed value is above the mean, whereas a negative z-score indicates that the score or observed value is below the mean.
  • 23.
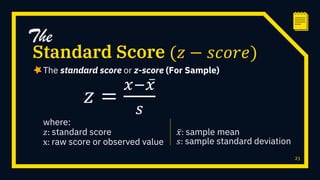
    The standard scoreor z-score (For Sample) 23 Standard Score (𝑧 − 𝑠𝑐𝑜𝑟𝑒) The 𝑧 = 𝑥− ҧ 𝑥 𝑠 where: 𝑧: standard score x: raw score or observed value ҧ 𝑥: sample mean 𝑠: sample standard deviation
  • 24.
    The standard scoreor z-score (For Population) 24 Standard Score (𝑧 − 𝑠𝑐𝑜𝑟𝑒) The 𝑧 = 𝑥−𝜇 𝜎 where: 𝑧: standard score x: raw score or observed value 𝜇: population mean 𝜎: population standard deviation
  • 25.
    Example 1: On afinal examination in Biology, the mean was 75 and the standard deviation was 12. Determine the standard score of a student who received a score of 60 assuming that the scores are normally distributed. 25 Standard Score (𝑧 − 𝑠𝑐𝑜𝑟𝑒) The
  • 26.
    Solution: Given: ҧ 𝑥 = 75,𝑠 = 12, 𝑥 = 60 ▫ Convert 60 to standard score : 𝑧 = 𝑥 − ҧ 𝑥 𝑠 𝑧 = 60 − 75 12 = − 15 12 𝒛 = −𝟏. 𝟐𝟓 26 −𝟏. 𝟐𝟓 60 75 Thus, 60 is -1.25 standard deviation below the mean.
  • 27.
    Example 2: On thefirst periodic exam in Statistics, the population mean was 70 and the population standard deviation was 9. Determine the standard score of a student who got a score of 88 assuming that the scores are normally distributed. 27 Standard Score (𝑧 − 𝑠𝑐𝑜𝑟𝑒) The
  • 28.
    Solution: Given: 𝜇 = 70,𝑠 = 9, 𝑥 = 88 ▫ Convert 88 to standard score : 𝑧 = 𝑥 − 𝜇 𝑠 𝑧 = 88 − 70 9 = 18 9 𝒛 = 𝟐 28 88 70 Hence, 88 is 2 standard deviation above the mean.
  • 29.
    Example 3: Luz scored90 in an English test and 70 in a Physics test. Scores in the English test have a mean of 80 and a standard deviation of 10. Scores in the Physics test have a mean of 60 and a standard deviation of 8. In which subject was her standing better assuming that the scores in her English and Physics class are normally distributed? 29 Standard Score (𝑧 − 𝑠𝑐𝑜𝑟𝑒) The
  • 30.
    Solution ▫ English ҧ 𝑥 =80, 𝑠 = 10, 𝑥 = 90 ▫ Convert 90 to standard score : 𝑧 = 𝑥 − ҧ 𝑥 𝑠 𝑧 = 90 − 80 10 = 10 10 𝒛 = 𝟏 ▫ Physics ҧ 𝑥 = 60, 𝑠 = 8, 𝑥 = 70 ▫ Convert 70 to standard score : 𝑧 = 𝑥 − ҧ 𝑥 𝑠 𝑧 = 70 − 60 8 = 10 8 𝒛 = 𝟏. 𝟐𝟓 30 Therefore, Luz performed better in the Physics subject.
  • 31.
    Example 4: In aScience test, the mean score is 42 and the standard deviation is 5 . Assuming that the scores are normally distributed, what percent of the score is greater than 48? less than 50? between 30 and 48? 31 Standard Score (𝑧 − 𝑠𝑐𝑜𝑟𝑒) The
  • 32.
    Solution: ▫ greater than48? ҧ 𝑥 = 42, 𝑠 = 5, 𝑥 = 48 ▫ Convert 48 to standard score: 𝑧 = 𝑥 − ҧ 𝑥 𝑠 𝑧 = 48 − 42 5 = 6 5 𝒛 = 𝟏. 𝟐 Find 𝐴1 and 𝐴2: 𝐴1 = 𝑏𝑒𝑡𝑤𝑒𝑒𝑛 0 𝑎𝑛𝑑 1.2 = 0.3849 𝐴2 = half of curve right side = 0.5 𝐴 = 𝐴2 − 𝐴1 𝐴 = 0.5 − 0.3849 = 0.1151 𝑨 = 𝟏𝟏. 𝟓𝟏% 32 𝟏. 𝟐 Hence, 11.51% of the scores are greater than 48.
  • 33.
    Solution: ▫ less than50? ҧ 𝑥 = 42, 𝑠 = 5, 𝑥 = 50 ▫ Convert 50 to standard score: 𝑧 = 𝑥 − ҧ 𝑥 𝑠 𝑧 = 50 − 42 5 = 8 5 𝒛 = 𝟏. 𝟔 Find 𝐴1 and 𝐴2: 𝐴1 = 𝑏𝑒𝑡𝑤𝑒𝑒𝑛 0 𝑎𝑛𝑑 1.6 = 0.4452 𝐴2 = half of curve left side = 0.5 𝐴 = 𝐴2 + 𝐴1 𝐴 = 0.5 + 0.4452 = 0.9452 𝑨 = 𝟗𝟒. 𝟓𝟐% 33 𝟏. 𝟔 Hence, 94.52% of the scores are less than 50.
  • 34.
    Solution: ▫ between 30and 48? ҧ 𝑥 = 42, 𝑠 = 5, 𝑥 = 30 and 48 ▫ Convert 30 and 48 to standard scores: 𝑧 = 30 − 42 5 = −12 5 𝒛 = −𝟐. 𝟒 𝑧 = 48 − 42 5 = 6 5 𝒛 = 𝟏. 𝟐 Find 𝐴1 and 𝐴2: 𝐴1 = 𝑏𝑒𝑡𝑤𝑒𝑒𝑛 0 𝑎𝑛𝑑 − 2.4 = 0.4918 𝐴2 = 𝑏𝑒𝑡𝑤𝑒𝑒𝑛 0 𝑎𝑛𝑑 1.2 = 0.3849 𝐴 = 𝐴2 + 𝐴1 𝐴 = 0.3849 + 0.4918 = 0.8767 𝑨 = 𝟗𝟒. 𝟓𝟐% 34 𝟏. 𝟐 Hence, 87.67% of the scores are between 30 and 48. −𝟐. 𝟒
  • 35.
    Example 5: The meanheight of grade nine students at a certain high school is 164 centimeters and the standard deviation is 10 centimeters. Assuming that the heights are normally distributed, what percent of the heights is greater than 168 centimeters? 35 Standard Score (𝑧 − 𝑠𝑐𝑜𝑟𝑒) The
  • 36.
    Example 6: In aMath test, the mean score is 45 and the standard deviation is 4. Assuming normality, what is the probability that a score picked at random will lie above score 50? below score 38? 36 Standard Score (𝑧 − 𝑠𝑐𝑜𝑟𝑒) The