Downloaded 87 times

![VTK has an extensive information visualization framework, has a suite of 3D interaction
widgets, supports parallel processing, and integrates with various databases on GUI toolkits such as
Qt and Tk.
VTK is cross-platform and runs on Linux, Windows, Mac and Unix platforms.
All VTK classes are wrapped with a Pythonic API supporting Traits.
• Classes are generated at install time on the installed platform.
• Elementary pickle support.
• Handles Numeric/numarray/scipy arrays/Python lists transparently.
• Support for a pipeline browser, ivtk and a high-level mlab like module.
• Envisage plugins for a tvtk scene and the pipeline browser.
• tvtk is free software with a BSD style license.
Demonstration of contour lines formation :
The demonstration will show the dynamic changes of contour values and its views.
We are going to generate the contour lines from varying heat values , dynamically.
Process :
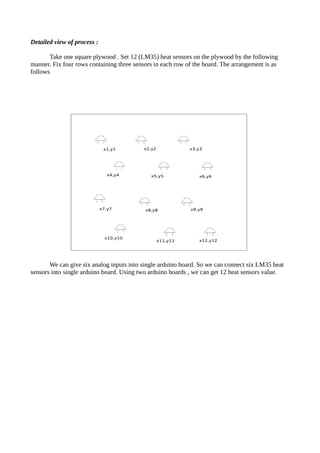
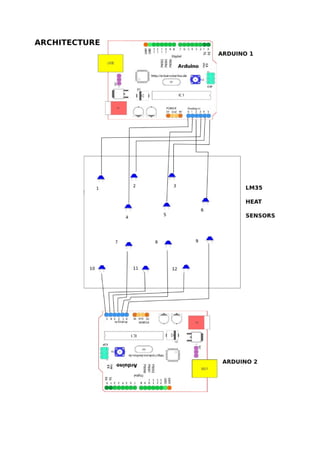
Arranging many heat sensors in particular manner. Connect all the sensors into Arduino
board to getting dynamic heat values of sensors.
And arrange few moving Heat emitting object [say LED] which will generate the heat and
is absorbed by the sensors and are converted into values using Arduino.
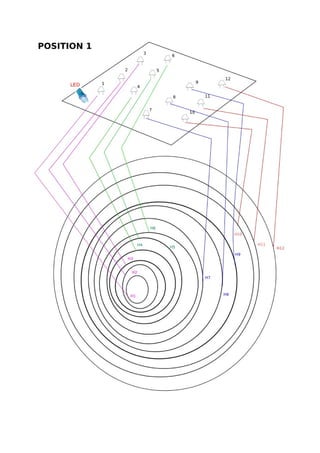
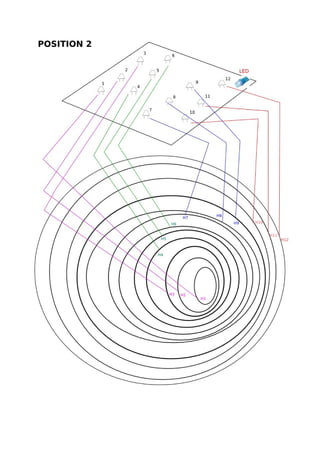
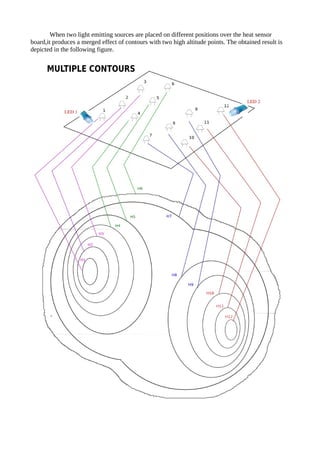
The converted heat values are plotted dynamically and contours are generated.
The variation in the distance between the Heat emitting source and each sensors will
produce variations in heat values. This variation is considered as the altitude of the contour.
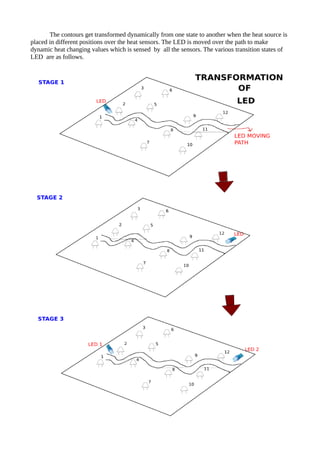
Now, we have the values for latitude, longitude and altitude for the contour. When the Heat
emitting source is moved dynamically between the sensors, the altitude values of each sensor will
vary dynamically resulting in a dynamic contour.
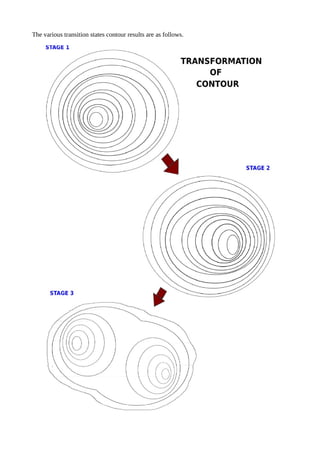
By this way, we can get the heat contour values dynamically and plotting those contour lines
into computerised view.
So we are going to view the dynamic changes of the contour values.](https://image.slidesharecdn.com/contouranalysisandvisualization-document-100115124814-phpapp02/85/contour-analysis-and-visulaization-documetation-1-8-320.jpg)
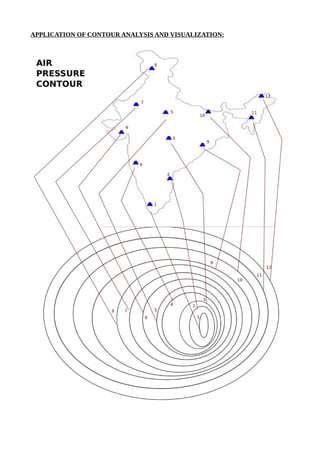

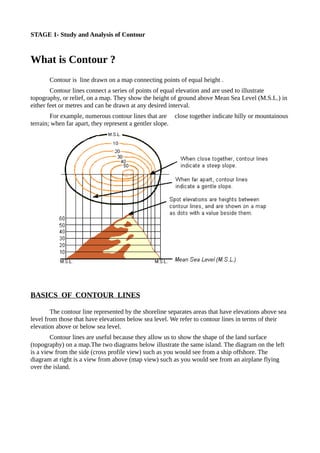
This document discusses the objectives and applications of contour analysis and visualization, detailing how contour lines are used to study topography and analyze environmental factors like air pressure. It explains the process of visualizing these contours in 3D using tools like Mayavi and VTK, and demonstrates a dynamic system for generating contour lines based on varying heat readings from sensors. Key applications include analyzing mountain slopes for agriculture and understanding climatic changes through geographical data collection.