Download to read offline


![1) Correcting the Pakistan part , which belongs to India
2) Correcting the part of the land which is occupied by the
Chinese in the state of jammu and kashmir
While asking help from Mr.Charles Doutriaux [ CDAT
Developer ] regarding edit map in cdat, he gave the source
data of cdat world map in .shp binary file.](https://image.slidesharecdn.com/contour-ilugc-demo-presentation-100325141534-phpapp01/85/Contour-Ilugc-Demo-Presentation-20-320.jpg)
![#make_world_coordinates.py
import vcsaddons
v = vcs.init()
world_continents = vcsaddons.continents.Guc(x=v)
data = world_continents.load_shapefile('/home/arul/Desktop/WORLD_COUNTRIES.shp')
#wrting the data into out.txt file
fileiter=open("/home/arul/Desktop/out.txt","w")
print >> fileiter, data[:]
fileiter.close()](https://image.slidesharecdn.com/contour-ilugc-demo-presentation-100325141534-phpapp01/85/Contour-Ilugc-Demo-Presentation-21-320.jpg)
![out.txt
200 1 59.790276 83.623596 72.830238 12.204896
60.238045 43.123886
60.174297 43.109169
60.110275 43.086662
60.082497 43.124443
60.019024 43.140419
59.989437 43.193470
59.992493 43.238892 There are more than one lakh lines like this.
60.023605 43.331116
59.972763 43.358894 These are x,y coordinate points.
59.928326 43.395832
59.903320 43.501945 Simply says, these are Latitude and
59.954636 43.488258
Longitude values of the whole [real] world.
59.914711 43.572777
59.947212 43.724716
59.877213 43.653885
59.804436 43.849724
59.790276 43.902222
59.811661 44.006950
59.800545 44.061943
59.813538 44.109722](https://image.slidesharecdn.com/contour-ilugc-demo-presentation-100325141534-phpapp01/85/Contour-Ilugc-Demo-Presentation-22-320.jpg)


![levels = [10,20,30]](https://image.slidesharecdn.com/contour-ilugc-demo-presentation-100325141534-phpapp01/85/Contour-Ilugc-Demo-Presentation-51-320.jpg)


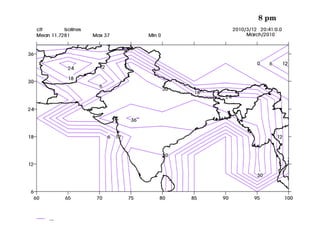


This document describes a student project to analyze contour lines and visualize them using the Climate Data Analysis Tool (CDAT). The project is conducted by Arulalan.T, a final year student at Saveetha Engg College, under the guidance of Mr. Thyagarajan Shanmugham. It thanks Mr. Charles Doutriaux of CDAT and Dr. Krishna AchutaRao of IIT Delhi for their support. The document provides instructions on installing CDAT, describes sample programs to create contour plots of cloud data over world and India maps, and explains how to edit the CDAT map and add custom contour lines by modifying netcdf files. It demonstrates creating isotherm lines over India at