Download as PDF, PPTX


![1D – Y(x) vs x
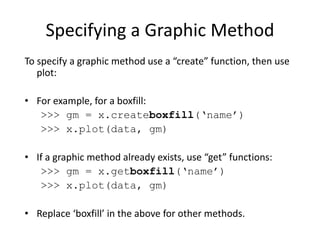
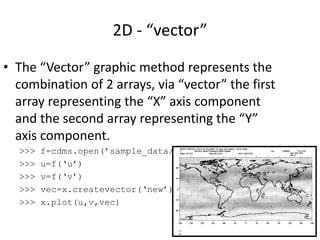
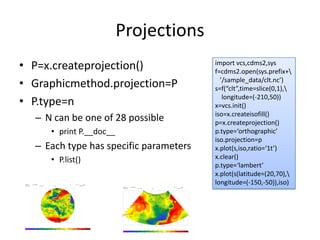
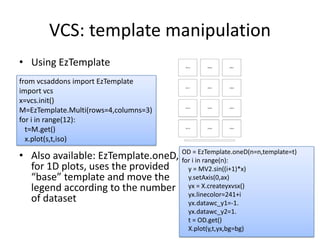
• All 1D plots in VCS basically work the same way.
There are 4 types of 1D graphic method, we’ll
start with the basic: Yxvsx, which stands for Y(x)
vs x
• This graphic method draws a 1D array (Y) as a
function of its 1D axis (x)
• Example zonal mean of the first time point of our
data array
>>> zm=MV.average(data[0],1) # Zm.shape is (46,)
>>> x.plot(zm) # knows to plot 1D with yxvsx
>>> yx=x.createyxvsx(‘new’)
>>> x.plot(zm,yx) # same](https://image.slidesharecdn.com/lesson4graphics-200405083432/85/CDAT-graphics-vcs-xmgrace-Introduction-13-320.jpg)
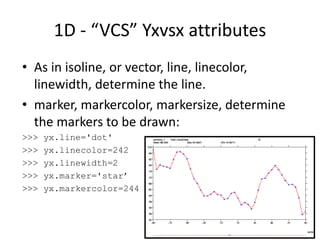
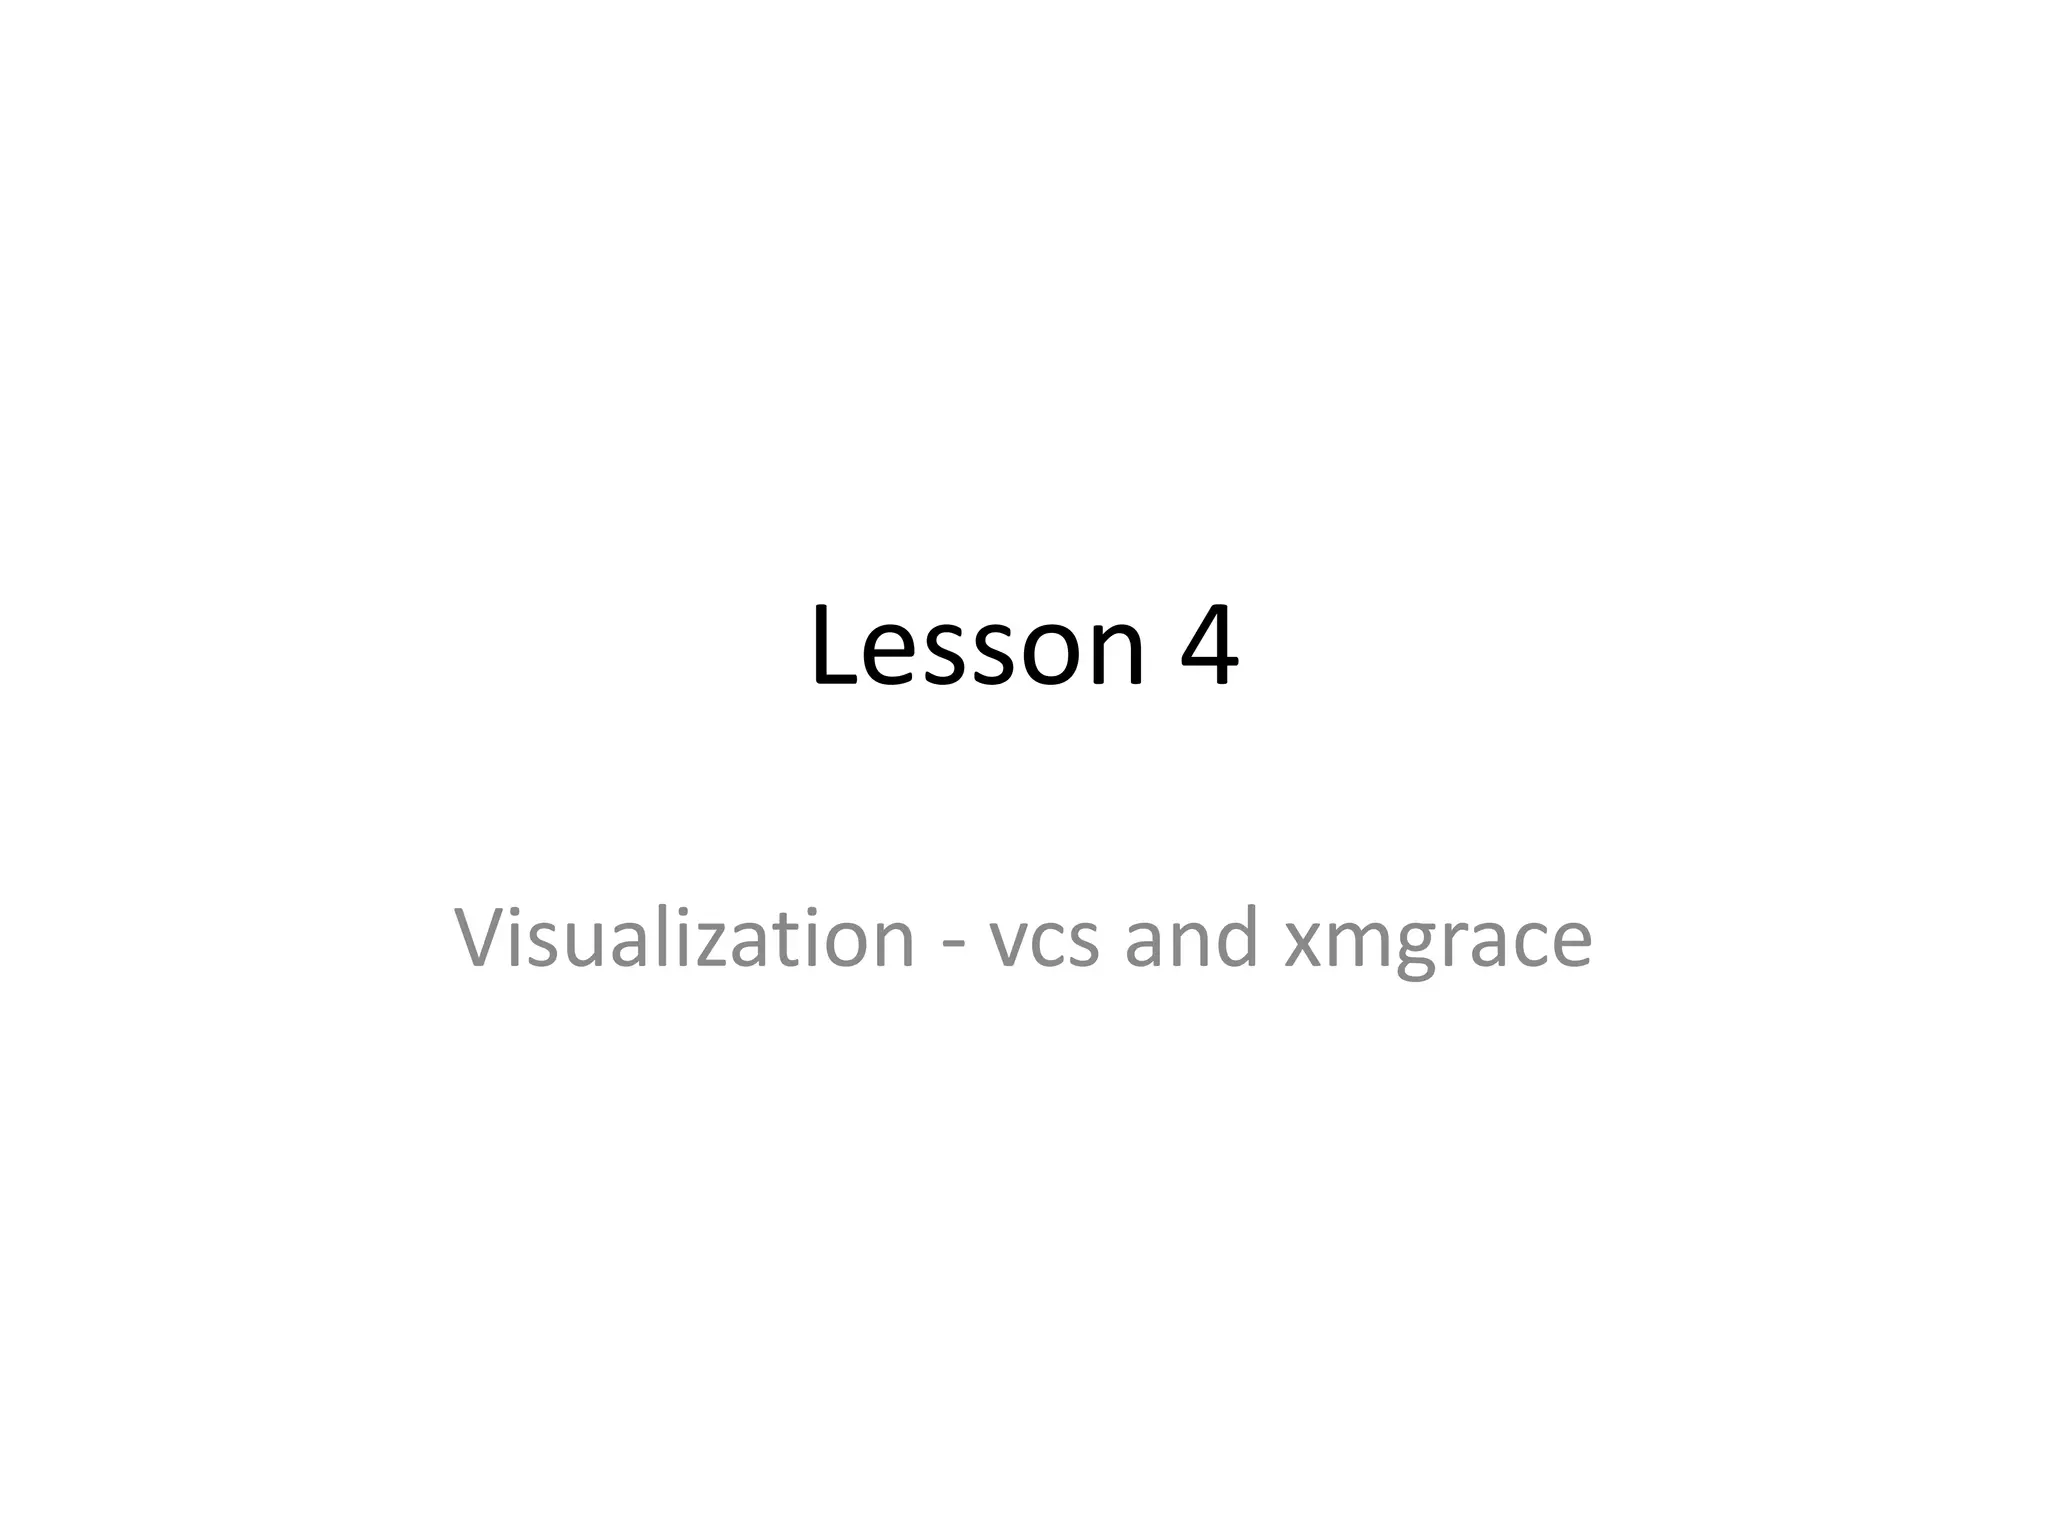
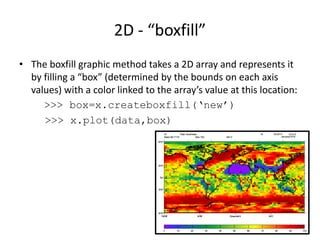
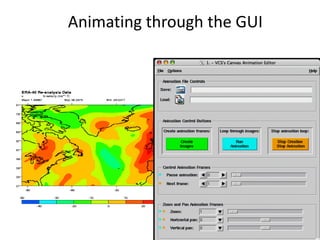
![vcs: text primitives
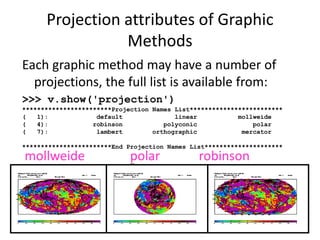
• text=x.createtext()
‐‐‐‐‐‐‐‐‐‐Text Table (Tt) member (attribute) listings ‐‐‐‐‐‐‐‐‐‐
Tt_name = new
font = 1
spacing = 2
expansion = 100
color = 1
priority = 1
string = None
viewport = [0, 1, 0, 1]
worldcoordinate = [0, 1, 0, 1]
x = None
y = None
projection = default
‐‐‐‐‐‐‐‐‐‐Text Orientation (To) member (attribute) listings ‐‐‐‐‐‐‐‐‐‐
To_name = new
height = 14
angle = 0
path = right
halign = left
valign = half
• Font_name = x.addfont(path_to_ttf_font)
• Font = x.getfont(Font_name) # usable in template
• Available fonts by default: ['Adelon', 'Arabic', 'AvantGarde', 'Chinese', 'Clarendon', 'Courier',
'Greek', 'Hebrew', 'Helvetica', 'Maths1', 'Maths2', 'Maths3', 'Maths4', 'Russian', 'Times',
'default']](https://image.slidesharecdn.com/lesson4graphics-200405083432/85/CDAT-graphics-vcs-xmgrace-Introduction-22-320.jpg)
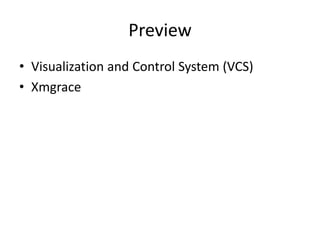
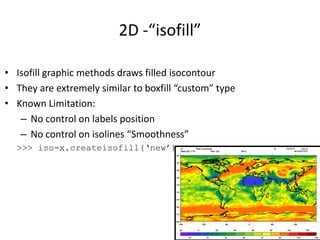
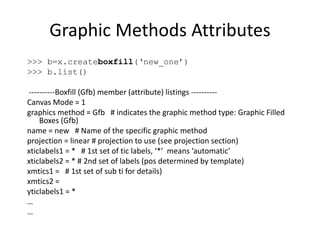
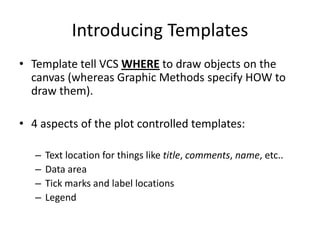
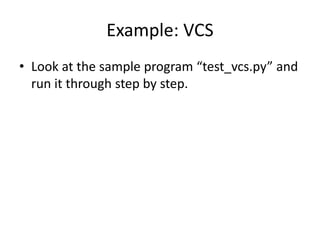
![vcs: other primitives
• fa=x.createfillarea(‘new’)
• l=x.createline(‘new’)
• m=x.createmarker(‘new’)
• Each primitive has the 2 following attributes:
– Prim.viewport=[xv1,xv2,yv1,yv2] # default: [0,1,0,1]
• In % of page, area of the primitive extends
– Prim.worldcoordinates = [x1,x2,y1,y2] # defalut [0,1,0,1]
• Coordinates corresponding to xv1,xv2,yv1,yv2
• Primitive units are in the worldcoordinate system
– Example
• text.viewport=[.25,.75,.25,.75] # define smaller zone on page
• text.worldcoordinate=[‐180, ‐90, 180, 90] # Define the coordinate system
• text.x=[‐122.4428 ]
• text.y=[37.7709 ]
• text.string=[‘San Francisco, CA, 94117’]
• For overlay with an existing graphic method
– Prim.viewport # set to your template.data
– Prim.worldcoordinates # set to your graphic method.data.wc](https://image.slidesharecdn.com/lesson4graphics-200405083432/85/CDAT-graphics-vcs-xmgrace-Introduction-23-320.jpg)

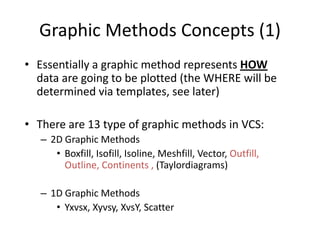
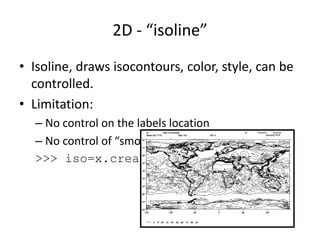
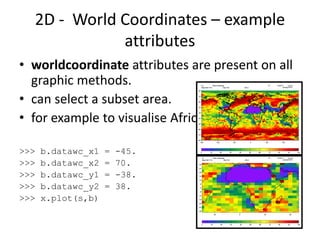
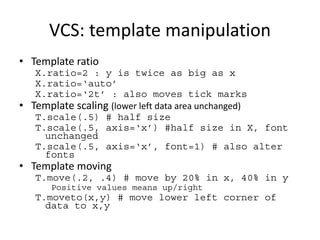
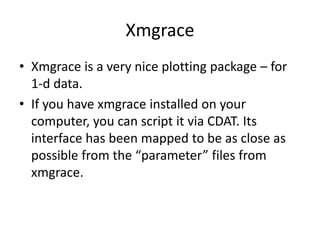
![vcsaddons
• GIS capability. You can read and plot gis/shapefiles.
import vcs,vcsaddons
import cdms2,sys
x=vcs.init()
import vcs.test.support
bg=0
c=vcsaddons.createusercontinents(x=x)
lon1=‐125
lon2=‐75.
lat1=20.
lat2=55.
c.types = ['shapefile','shapefile']
c.sources = ['../Data/co1990p020','../Data/fe_2007_06_county',]
c.colors = [246,241,244,241]
c.widths=[1,1,1]
c.lines=['solid','solid','solid','dot']
f=cdms2.open(sys.prefix+’/sample_data/clt.nc’)
s=f("clt",latitude=(lat1,lat2),longitude=(lon1,lon2),time=slice(0,1
))
t=x.createtemplate()
iso=x.createisofill()
x.plot(s,t,iso,continents=0,ratio='autot',bg=bg)
x.plot(s,c,t,ratio='autot',bg=bg)
x.png('uscounties')
import vcsaddons._gis
sources =
['../Data/fe_2007_06_county.dbf','../Dat
a/co1990p020.dbf’]
for s in sources:
D = vcsaddons._gis.readdbffile(s)
print D.keys()
try:
print D['NAME']
except:
print D['COUNTY']](https://image.slidesharecdn.com/lesson4graphics-200405083432/85/CDAT-graphics-vcs-xmgrace-Introduction-27-320.jpg)


The document provides an overview of the Visualization and Control System (VCS) and its functionalities, including the use of graphic methods, templates, and primitives for rendering data plots. It discusses different 2D and 1D graphic methods available in VCS, how to create and manipulate canvases, and the process for plotting data. Additionally, it mentions the capability to incorporate GIS data and references related plotting packages like xmgrace.