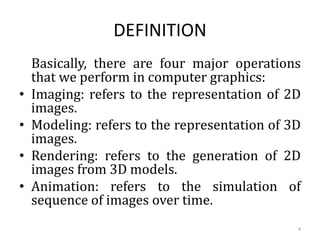
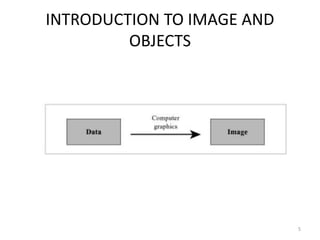
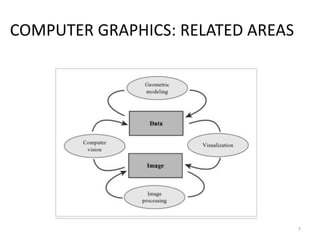
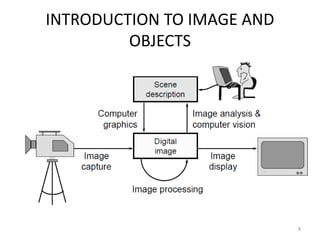
Computer graphics involves the creation and manipulation of images through programming. There are four major operations in computer graphics: imaging, modeling, rendering, and animation. Computer graphics is used in many applications including computer-aided design, presentation graphics, computer art, entertainment, education and training, visualization, image processing, and graphical user interfaces.
A collection of static images joined together and shown consecutively so that they appear to move.
Animation is about storytelling by bringing things to life (making them move).
Devices that output hard copy
An external hardware device responsible for taking computer data and generating a hard copy of that data. Printers are one of the most commonly used peripherals and they print text and still images on the paper.
Impact printers use a device to strike an inked ribbon, pressing ink from the ribbon onto the paper.
Non-impact printers use different methods to place ink (or another substance) on the page.
(1) DPI:
It is a measurement of printer’s resolution indicating how many ink dots can be placed by the printer in one square inch. The higher the DPI, the sharper is image. Image quality – Measured in dots per inch (dpi). Most printers produce 300 – 1200 dpi.
(2) Type of printer:
Each type of printer has its own capabilities of printing. Some types of printers produce high quality print while other produce low quality print.
(3) Print Mode:
The printing mode may also affect the quality. For example the draft mode increases the print rate but quality is reduced.
(4) Toner:
The quality and amount of toner also affects print quality.
Presentation By daroko blog-where IT learners apply Skills in real business environment.
-------------------------------------------------------------------------------------
This presentation will introduce you to color representation in computer graphics.
-----------------------------------------------------------------
Do Not just learn computer graphics an close your computer tab and go away..
APPLY them in real business,
Visit Daroko blog for real IT skills applications,androind, Computer graphics,Networking,Programming,IT jobs Types, IT news and applications,blogging,Builing a website, IT companies and how you can form yours, Technology news and very many More IT related subject.
-simply google:Daroko blog(professionalbloggertricks.com)
-------------------------------------------------------------------
• Daroko blog (www.professionalbloggertricks.com)
• Presentation by Daroko blog, to see More tutorials more than this one here, Daroko blog has all tutorials related with IT course, simply visit the site by simply Entering the phrase Daroko blog (www.professionalbloggertricks.com) to search engines such as Google or yahoo!, learn some Blogging, affiliate marketing ,and ways of making Money with the computer graphic Applications(it is useless to learn all these tutorials when you can apply them as a student you know),also learn where you can apply all IT skills in a real Business Environment after learning Graphics another computer realate courses.ly
• Be practically real, not just academic reader
Color based image processing , tracking and automation using matlabKamal Pradhan
Image processing is a form of signal processing in which the input is an image, such as a photograph or video frame. The output of image processing may be either an image or, a set of characteristics or parameters related to the image. Most image-processing techniques involve treating the image as a two-dimensional signal and applying standard signal-processing techniques to it. This project aims at processing the real time images captured by a Webcam for motion detection and Color Recognition and system automation using MATLAB programming.
In color based image processing we work with colors instead of object. Color provides powerful information for object recognition. A simple and effective recognition scheme is to represent and match images on the basis of color histograms.
Tracking refers to detection of the path of the color once the color based processing is done the color becomes the object to be tracked this can be very helpful in security purposes.
Automation refers to an automated system is any system that does not require human intervention. In this project I’ve automated the mouse that work with our gesture and do the desired tasks.
Low power architecture of logic gates using adiabatic techniquesnooriasukmaningtyas
The growing significance of portable systems to limit power consumption in ultra-large-scale-integration chips of very high density, has recently led to rapid and inventive progresses in low-power design. The most effective technique is adiabatic logic circuit design in energy-efficient hardware. This paper presents two adiabatic approaches for the design of low power circuits, modified positive feedback adiabatic logic (modified PFAL) and the other is direct current diode based positive feedback adiabatic logic (DC-DB PFAL). Logic gates are the preliminary components in any digital circuit design. By improving the performance of basic gates, one can improvise the whole system performance. In this paper proposed circuit design of the low power architecture of OR/NOR, AND/NAND, and XOR/XNOR gates are presented using the said approaches and their results are analyzed for powerdissipation, delay, power-delay-product and rise time and compared with the other adiabatic techniques along with the conventional complementary metal oxide semiconductor (CMOS) designs reported in the literature. It has been found that the designs with DC-DB PFAL technique outperform with the percentage improvement of 65% for NOR gate and 7% for NAND gate and 34% for XNOR gate over the modified PFAL techniques at 10 MHz respectively.
A review on techniques and modelling methodologies used for checking electrom...nooriasukmaningtyas
The proper function of the integrated circuit (IC) in an inhibiting electromagnetic environment has always been a serious concern throughout the decades of revolution in the world of electronics, from disjunct devices to today’s integrated circuit technology, where billions of transistors are combined on a single chip. The automotive industry and smart vehicles in particular, are confronting design issues such as being prone to electromagnetic interference (EMI). Electronic control devices calculate incorrect outputs because of EMI and sensors give misleading values which can prove fatal in case of automotives. In this paper, the authors have non exhaustively tried to review research work concerned with the investigation of EMI in ICs and prediction of this EMI using various modelling methodologies and measurement setups.
Literature Review Basics and Understanding Reference Management.pptxDr Ramhari Poudyal
Three-day training on academic research focuses on analytical tools at United Technical College, supported by the University Grant Commission, Nepal. 24-26 May 2024
6th International Conference on Machine Learning & Applications (CMLA 2024)ClaraZara1
6th International Conference on Machine Learning & Applications (CMLA 2024) will provide an excellent international forum for sharing knowledge and results in theory, methodology and applications of on Machine Learning & Applications.
Water billing management system project report.pdfKamal Acharya
Our project entitled “Water Billing Management System” aims is to generate Water bill with all the charges and penalty. Manual system that is employed is extremely laborious and quite inadequate. It only makes the process more difficult and hard.
The aim of our project is to develop a system that is meant to partially computerize the work performed in the Water Board like generating monthly Water bill, record of consuming unit of water, store record of the customer and previous unpaid record.
We used HTML/PHP as front end and MYSQL as back end for developing our project. HTML is primarily a visual design environment. We can create a android application by designing the form and that make up the user interface. Adding android application code to the form and the objects such as buttons and text boxes on them and adding any required support code in additional modular.
MySQL is free open source database that facilitates the effective management of the databases by connecting them to the software. It is a stable ,reliable and the powerful solution with the advanced features and advantages which are as follows: Data Security.MySQL is free open source database that facilitates the effective management of the databases by connecting them to the software.
Understanding Inductive Bias in Machine LearningSUTEJAS
This presentation explores the concept of inductive bias in machine learning. It explains how algorithms come with built-in assumptions and preferences that guide the learning process. You'll learn about the different types of inductive bias and how they can impact the performance and generalizability of machine learning models.
The presentation also covers the positive and negative aspects of inductive bias, along with strategies for mitigating potential drawbacks. We'll explore examples of how bias manifests in algorithms like neural networks and decision trees.
By understanding inductive bias, you can gain valuable insights into how machine learning models work and make informed decisions when building and deploying them.
We have compiled the most important slides from each speaker's presentation. This year’s compilation, available for free, captures the key insights and contributions shared during the DfMAy 2024 conference.
2. DEFINITION
Computer graphics is an art of drawing
pictures on computer screens with the help
of programming. It involves computations,
creation, and manipulation of data. In other
words, we can say that computer graphics is
a rendering tool for the generation and
manipulation of images.
2
3. • Computer graphics involves display,
manipulation and storage of pictures and
experimental data for proper visualization
using a computer. It provides methods for
producing images and animations
(sequence of images).
• It deals with the hardware as well as
software support for generating images.
DEFINITION
3
4. Basically, there are four major operations
that we perform in computer graphics:
• Imaging: refers to the representation of 2D
images.
• Modeling: refers to the representation of 3D
images.
• Rendering: refers to the generation of 2D
images from 3D models.
• Animation: refers to the simulation of
sequence of images over time.
DEFINITION
4
9. INTRODUCTION TO IMAGE AND
OBJECTS
• An image is basically representation of a
real world object on a computer. It can be an
actual picture display, a stored page in a
video memory, or a source code generated
by a program. Mathematically, an image is a
two - dimensional array of data with
intensity or a color value at each element of
the array.
9
10. INTRODUCTION TO IMAGE AND
OBJECTS
• Objects are real world entities defined in
three – dimensional world coordinates. In
computer graphics we deal with both 2D
and 3D descriptions of an object. We also
study the algorithms and procedures for
generation and manipulation of objects and
images in computer graphics.
10
11. IMAGE REPRESENTATION
• Image representation is the approximations
of the real world displayed in a computer. A
picture in computer graphics is represented
as a collection of discrete picture elements
termed as pixels. A pixel is the smallest
element of picture or object that can be
represented on the screen of a device like
computer.
11
13. GRAPHICS PIPELINE
• In computer graphics, the graphics pipeline
refers to a series of interconnected stages
through which data and commands related
to a scene go through during rendering
process.
• It takes us from the mathematical
description of an object to its representation
on the device..
13
17. GRAPHICS PIPELINE
The real world objects are represented in
world coordinate system. It is then projected
onto a view plane. The projection is done from
the viewpoint of the position of a camera or
eye.
There is an associated camera coordinate
system whose z axis specifies the view
direction when viewed from the viewpoint.
The infinite volume swept by the rays emerging
from the viewpoint and passing through the
window is called as view volume or view
pyramid. Clipping planes (near and far) are
used to limit the output of the object. 17
18. GRAPHICS PIPELINE
The mapping of an object to a graphic device requires the
transformation of view plane coordinates to physical device
coordinates. There are two steps involved in this process.
(i) The window to a viewport transformation. The viewport is
basically a sub – rectangle of a fixed rectangle known a logical
screen.
(ii) The transformation of logical screen coordinates to physical
device coordinates.
18
22. GRAPHICS - APPLICATION
Computer-Aided Design:
In engineering and architectural systems, the products are
modeled using computer graphics commonly referred as
CAD (Computer Aided Design).
In many design applications like automobiles, aircraft,
spacecraft, etc., objects are modeled in a wireframe outline
that helps the designer to observe the overall shape and
internal features of the objects. CAD applications are also
used in computer animations. The motion of an object can
be simulated using CAD.
22
23. GRAPHICS - APPLICATION
Presentation graphics:
In applications like summarizing of data of financial,
statistical, mathematical, scientific and economic research
reports, presentation graphics are used. It increases the
understanding using visual tools like bar charts,line
graphs, pie charts and other displays.
23
24. GRAPHICS - APPLICATION
Computer Art:
A variety of computer methods are available for artists for
designing and specifying motions of an object. The object
can be painted electronically on a graphic tablet using
stylus with different brush strokes, brush widths and
colors. The artists can also use combination of 3D modeling
packages, texture mapping, drawing programs and CAD
software to paintand visualize any object.
24
25. GRAPHICS - APPLICATION
Entertainment:
In making motion pictures, music videos and television
shows, computer graphics methods are widely used.
Graphics objects can be combined with live actions or can
be used with image processing techniques to transform
one object to another (morphing)
25
26. GRAPHICS - APPLICATION
Education and training:
Computer graphics can make us understand the
functioning of a system in a better way. In physical systems,
biological systems, population trends, etc., models makes it
easier to understand. In some training systems, graphical
models with simulations help a trainee to train in virtual
reality environment. For example, practice session or
training of ship captains, aircraft pilots, air traffic control
personnel.
26
27. GRAPHICS - APPLICATION
Visualization:
For analyzing scientific, engineering, medical and business
data or behavior where we have to deal with large amount
of information, it is very tedious and ineffective process to
determine trends and relationships among them. But if it is
converted into visual form, it becomes easier to
understand. This process is termed as visualization.
27
28. GRAPHICS - APPLICATION
Image processing:
Image processing provides us techniques to modify or
interpret existing images. One can improve picture quality
through image processing techniques and can also be used
for machine perception of visual information in robotics. In
medical applications, image processing techniques can be
applied for image enhancements and is been widely used
for CT (Computer X-ray Tomography) and PET (Position
Emission Tomography) images.
28
29. GRAPHICS - APPLICATION
Graphical User Interface:
GUI commonly used these days to make a software package
more interactive. There are multiple window system, icons,
menus, which allows a computer setup to be utilized more
efficiently.
29