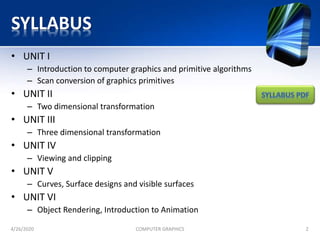
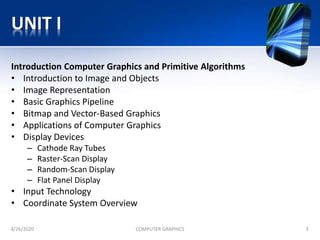
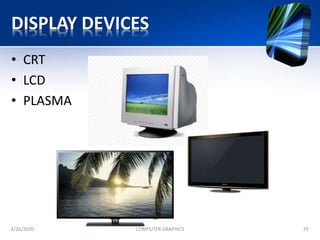
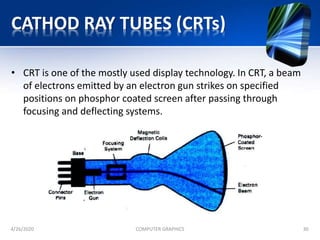
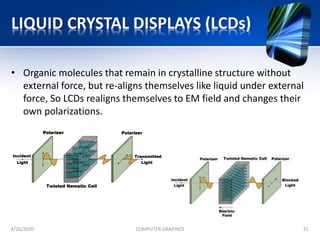
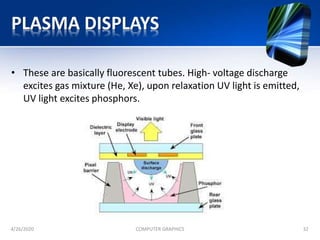
COMPUTER
GRAPHICS
S.Y.B.Sc IT
SEMISTER – III
PAPER – II
-BY MS. ARTI GAVAS
SYLLABUS
• UNIT I
– Introduction to computer graphics and primitive algorithms
– Scan conversion of graphics primitives
• UNIT II
– Two dimensional transformation
• UNIT III
– Three dimensional transformation
• UNIT IV
– Viewing and clipping
• UNIT V
– Curves, Surface designs and visible surfaces
• UNIT VI
– Object Rendering, Introduction to Animation
4/26/2020 COMPUTER GRAPHICS 2
UNIT I
Introduction Computer Graphics and Primitive Algorithms
• Introduction to Image and Objects
• Image Representation
• Basic Graphics Pipeline
• Bitmap and Vector-Based Graphics
• Applications of Computer Graphics
• Display Devices
– Cathode Ray Tubes
– Raster-Scan Display
– Random-Scan Display
– Flat Panel Display
• Input Technology
• Coordinate System Overview
4/26/2020 COMPUTER GRAPHICS 3
DEFINITION COMPUTER GRAPHICS
4/26/2020 COMPUTER GRAPHICS 4
Computer graphics involves display, manipulation and
storage of pictures and experimental data for proper
visualization using a computer.
It provides methods for producing images and animations (sequence of images).
It deals with the hardware as well as software support for generating images.
IMAGES AND OBJECTS
• An image is basically representation of a real
world object on a computer.
– It can be an actual picture display, a stored page in a video
memory
– Mathematically, an image is a two dimensional array of data
with intensity or a color value at each element of the array
• Objects are real world entities defined in three-
dimensional world coordinates.
4/26/2020 COMPUTER GRAPHICS 5
IMAGE REPRESENTATION
• Image representation is the approximations of the real world
displayed in a computer.
• A picture in computer graphics is represented as a collection of
discrete picture elements termed as pixels.
• A pixel is the smallest element of picture or object that can be
represented on the screen of a device like computer.
4/26/2020 COMPUTER GRAPHICS 6
BASIC GRAPHIC PIPELINE
• In computer graphics, the graphics pipeline refers to a series of
interconnected stages through which data and commands related
to a scene go through during rendering process.
4/26/2020 COMPUTER GRAPHICS 7
BASIC GRAPHIC PIPELINE CONTINUED…
• Sequence of transformation in viewing pipeline
– The mapping of an object to a graphic device requires the
transformation of view plane coordinates to physical device
coordinates.
– There are two steps involved in this process:
1. The window to a viewport transformation. The viewport is basically a
sub–rectangle of a fixed rectangle known as logical screen.
2. The transformation of logical screen coordinates to physical device
coordinates.
4/26/2020 COMPUTER GRAPHICS 8
BITMAP AND VECTOR BASED GRAPHICS
• BITMAP (RASTER) GRAPHICS
– It is pixel based graphics.
– The position and color
information about the image
are stored in pixels arranged in
grid pattern.
– The Image size is determined on
the basis of image resolution.
– These images cannot be scaled
easily.
– Bitmap images are used to
represent photorealistic images
which involve complex color
variations.
4/26/2020 COMPUTER GRAPHICS 9
• VECTOR GRAPHICS
– The images in vector graphics
are basically mathematically
based images.
– Vector based images have
smooth edges and therefore
used to create curves and
shapes.
– These images are appropriate
for precise illustrations but not
good for photorealistic images.
– These images are easily scalable
due to their mathematical
structure
BITMAP AND VECTOR BASED GRAPHICS
4/26/2020 COMPUTER GRAPHICS 10
BITMAP AND VECTOR BASED GRAPHICS
4/26/2020 COMPUTER GRAPHICS 11
APPLICATIONS OF COMPUTER GRAPHICS
• Computer Aided Design(CAD)
• Presentation graphics
• Computer Art
• Entertainment
• Education and training
• Visualization
• Image Processing
• Graphical User Interface
4/26/2020 COMPUTER GRAPHICS 12
COMPUTER AIDED DESIGN (CAD)
• In many design applications like automobiles, aircraft, spacecraft,
etc., objects are modeled in a wireframe outline that helps the
designer to observe the overall shape and internal features of the
objects.
• CAD applications are also used in computer animations. The
motion of an object can be simulated using CAD.
4/26/2020 COMPUTER GRAPHICS 13
CAD CONTINUED…
4/26/2020 COMPUTER GRAPHICS 14
PRESENTATON GRAPHICS
• In applications like summarizing of data of financial, statistical,
mathematical, scientific and economic research reports,
presentation graphics are used. It increases the understanding
using visual tools like bar charts, line graphs, pie charts and other
displays.
4/26/2020 COMPUTER GRAPHICS 15
PRESENTATON GRAPHICS CONTINUED…
4/26/2020 COMPUTER GRAPHICS 16
COMPUTER ART
• A variety of computer methods are available for artists for
designing and specifying motions of an object. The object can be
painted electronically on a graphic tablet using stylus with
different brush strokes, brush widths and colors.
• The artists can also use combination of 3D modeling packages,
texture mapping, drawing programs and CAD software to paint
and visualize any object.
4/26/2020 COMPUTER GRAPHICS 17
COMPUTER ART CONTINUED…
4/26/2020 COMPUTER GRAPHICS 18
ENTERTAINMENT
• In making motion pictures, music videos and television shows,
computer graphics methods are widely used. Graphics objects can
be combined with live actions or can be used with image
processing techniques to transform one object to another
(morphing).
4/26/2020 COMPUTER GRAPHICS 19
ENTERTAINMENT CONTINUED…
4/26/2020 COMPUTER GRAPHICS 20
EDUCATION AND TRAINING
• Computer graphics can make us understand the functioning of a
system in a better way. In physical systems, biological systems,
population trends, etc., models makes it easier to understand. In
some training systems, graphical models with simulations help a
trainee to train in virtual reality environment. For example,
practice session or training of ship captains, aircraft pilots, air
traffic control personnel.
4/26/2020 COMPUTER GRAPHICS 21
EDUCATION AND TRAINING CONTINUED…
4/26/2020 COMPUTER GRAPHICS 22
VISUALIZATION
• For analyzing scientific, engineering, medical and business data or
behavior where we have to deal with large amount of
information, it is very tedious and ineffective process to
determine trends and relationships among them. But if it is
converted into visual form, it becomes easier to understand.
4/26/2020 COMPUTER GRAPHICS 23
VISUALIZATION CONTINUED…
4/26/2020 COMPUTER GRAPHICS 24
IMAGE PROCESSING
• Image processing provides us techniques to modify or interpret
existing images. One can improve picture quality through image
processing techniques and can also be used for machine
perception of visual information in robotics. In medical
applications, image processing techniques can be applied for
image enhancements and is been widely used for CT (Computer
X-ray Tomography) and PET (Position Emission Tomography)
images.
4/26/2020 COMPUTER GRAPHICS 25
IMAGE PROCESSING
4/26/2020 COMPUTER GRAPHICS 26
GRAPHICAL USER INTERFACE
• GUI commonly used these days to make a software package more
interactive. There are multiple window system, icons, menus,
which allows a computer setup to be utilized more efficiently.
4/26/2020 COMPUTER GRAPHICS 27
GRAPHICAL USER INTERFACE
4/26/2020 COMPUTER GRAPHICS 28
DISPLAY DEVICES
• CRT
• LCD
• PLASMA
4/26/2020 COMPUTER GRAPHICS 29
CATHOD RAY TUBES (CRTs)
• CRT is one of the mostly used display technology. In CRT, a beam
of electrons emitted by an electron gun strikes on specified
positions on phosphor coated screen after passing through
focusing and deflecting systems.
4/26/2020 COMPUTER GRAPHICS 30
LIQUID CRYSTAL DISPLAYS (LCDs)
• Organic molecules that remain in crystalline structure without
external force, but re-aligns themselves like liquid under external
force, So LCDs realigns themselves to EM field and changes their
own polarizations.
4/26/2020 COMPUTER GRAPHICS 31
PLASMA DISPLAYS
• These are basically fluorescent tubes. High- voltage discharge
excites gas mixture (He, Xe), upon relaxation UV light is emitted,
UV light excites phosphors.
4/26/2020 COMPUTER GRAPHICS 32
CRT DISPLAY TYPES
• Raster Scan Displays
– A rectangular array of points or dots. In a raster scan system,
the electron beam is swept across the screen, one row at a
time from top to bottom. As the electron beam moves across
each row, the beam intensity is turned on and off to create a
pattern of illuminated spots.
• Random Scan Displays
– Random scan display is the use of geometrical primitives such
as points, lines, curves, and polygons, which are all based
upon mathematical equation. In a random scan display, a CRT
has the electron beam directed only to the parts of the screen
where a picture is to be drawn. Random scan monitors draw a
picture one line at a time.
4/26/2020 COMPUTER GRAPHICS 33
CRT DISPLAY TYPES CONTINUED…
4/26/2020 COMPUTER GRAPHICS 34
RELATED TERMINOLOGY
• Persistence
• Resolution
• Aspect ratio
• Frame buffer
• Pixel
• Bitmap or Pixmap
4/26/2020 COMPUTER GRAPHICS 35
INPUT TECHNOLOGIES
• Touch Screens
• Light pen
• Graphic Tablets
4/26/2020 COMPUTER GRAPHICS 36
COORDINTE SYSTEM
• Cartesian coordinate system
– It is also known as rectangular coordinate system and can be
of two or three dimensions. A point in Cartesian coordinate
system can be defined by specifying two numbers, called as x –
coordinate and the y – coordinate of that point.
4/26/2020 COMPUTER GRAPHICS 37
COORDINTE SYSTEM
• Polar coordinate system
– In polar coordinate system, the position of a point is defined
by specifying the distance (radius) from a fixed point called as
origin and the angle between the line joining the point and the
origin and the polar axis (horizontal line passing through the
origin).
4/26/2020 COMPUTER GRAPHICS 38

Computer graphics

  • 1.
    COMPUTER GRAPHICS S.Y.B.Sc IT SEMISTER –III PAPER – II -BY MS. ARTI GAVAS
  • 2.
    SYLLABUS • UNIT I –Introduction to computer graphics and primitive algorithms – Scan conversion of graphics primitives • UNIT II – Two dimensional transformation • UNIT III – Three dimensional transformation • UNIT IV – Viewing and clipping • UNIT V – Curves, Surface designs and visible surfaces • UNIT VI – Object Rendering, Introduction to Animation 4/26/2020 COMPUTER GRAPHICS 2
  • 3.
    UNIT I Introduction ComputerGraphics and Primitive Algorithms • Introduction to Image and Objects • Image Representation • Basic Graphics Pipeline • Bitmap and Vector-Based Graphics • Applications of Computer Graphics • Display Devices – Cathode Ray Tubes – Raster-Scan Display – Random-Scan Display – Flat Panel Display • Input Technology • Coordinate System Overview 4/26/2020 COMPUTER GRAPHICS 3
  • 4.
    DEFINITION COMPUTER GRAPHICS 4/26/2020COMPUTER GRAPHICS 4 Computer graphics involves display, manipulation and storage of pictures and experimental data for proper visualization using a computer. It provides methods for producing images and animations (sequence of images). It deals with the hardware as well as software support for generating images.
  • 5.
    IMAGES AND OBJECTS •An image is basically representation of a real world object on a computer. – It can be an actual picture display, a stored page in a video memory – Mathematically, an image is a two dimensional array of data with intensity or a color value at each element of the array • Objects are real world entities defined in three- dimensional world coordinates. 4/26/2020 COMPUTER GRAPHICS 5
  • 6.
    IMAGE REPRESENTATION • Imagerepresentation is the approximations of the real world displayed in a computer. • A picture in computer graphics is represented as a collection of discrete picture elements termed as pixels. • A pixel is the smallest element of picture or object that can be represented on the screen of a device like computer. 4/26/2020 COMPUTER GRAPHICS 6
  • 7.
    BASIC GRAPHIC PIPELINE •In computer graphics, the graphics pipeline refers to a series of interconnected stages through which data and commands related to a scene go through during rendering process. 4/26/2020 COMPUTER GRAPHICS 7
  • 8.
    BASIC GRAPHIC PIPELINECONTINUED… • Sequence of transformation in viewing pipeline – The mapping of an object to a graphic device requires the transformation of view plane coordinates to physical device coordinates. – There are two steps involved in this process: 1. The window to a viewport transformation. The viewport is basically a sub–rectangle of a fixed rectangle known as logical screen. 2. The transformation of logical screen coordinates to physical device coordinates. 4/26/2020 COMPUTER GRAPHICS 8
  • 9.
    BITMAP AND VECTORBASED GRAPHICS • BITMAP (RASTER) GRAPHICS – It is pixel based graphics. – The position and color information about the image are stored in pixels arranged in grid pattern. – The Image size is determined on the basis of image resolution. – These images cannot be scaled easily. – Bitmap images are used to represent photorealistic images which involve complex color variations. 4/26/2020 COMPUTER GRAPHICS 9 • VECTOR GRAPHICS – The images in vector graphics are basically mathematically based images. – Vector based images have smooth edges and therefore used to create curves and shapes. – These images are appropriate for precise illustrations but not good for photorealistic images. – These images are easily scalable due to their mathematical structure
  • 10.
    BITMAP AND VECTORBASED GRAPHICS 4/26/2020 COMPUTER GRAPHICS 10
  • 11.
    BITMAP AND VECTORBASED GRAPHICS 4/26/2020 COMPUTER GRAPHICS 11
  • 12.
    APPLICATIONS OF COMPUTERGRAPHICS • Computer Aided Design(CAD) • Presentation graphics • Computer Art • Entertainment • Education and training • Visualization • Image Processing • Graphical User Interface 4/26/2020 COMPUTER GRAPHICS 12
  • 13.
    COMPUTER AIDED DESIGN(CAD) • In many design applications like automobiles, aircraft, spacecraft, etc., objects are modeled in a wireframe outline that helps the designer to observe the overall shape and internal features of the objects. • CAD applications are also used in computer animations. The motion of an object can be simulated using CAD. 4/26/2020 COMPUTER GRAPHICS 13
  • 14.
  • 15.
    PRESENTATON GRAPHICS • Inapplications like summarizing of data of financial, statistical, mathematical, scientific and economic research reports, presentation graphics are used. It increases the understanding using visual tools like bar charts, line graphs, pie charts and other displays. 4/26/2020 COMPUTER GRAPHICS 15
  • 16.
  • 17.
    COMPUTER ART • Avariety of computer methods are available for artists for designing and specifying motions of an object. The object can be painted electronically on a graphic tablet using stylus with different brush strokes, brush widths and colors. • The artists can also use combination of 3D modeling packages, texture mapping, drawing programs and CAD software to paint and visualize any object. 4/26/2020 COMPUTER GRAPHICS 17
  • 18.
  • 19.
    ENTERTAINMENT • In makingmotion pictures, music videos and television shows, computer graphics methods are widely used. Graphics objects can be combined with live actions or can be used with image processing techniques to transform one object to another (morphing). 4/26/2020 COMPUTER GRAPHICS 19
  • 20.
  • 21.
    EDUCATION AND TRAINING •Computer graphics can make us understand the functioning of a system in a better way. In physical systems, biological systems, population trends, etc., models makes it easier to understand. In some training systems, graphical models with simulations help a trainee to train in virtual reality environment. For example, practice session or training of ship captains, aircraft pilots, air traffic control personnel. 4/26/2020 COMPUTER GRAPHICS 21
  • 22.
    EDUCATION AND TRAININGCONTINUED… 4/26/2020 COMPUTER GRAPHICS 22
  • 23.
    VISUALIZATION • For analyzingscientific, engineering, medical and business data or behavior where we have to deal with large amount of information, it is very tedious and ineffective process to determine trends and relationships among them. But if it is converted into visual form, it becomes easier to understand. 4/26/2020 COMPUTER GRAPHICS 23
  • 24.
  • 25.
    IMAGE PROCESSING • Imageprocessing provides us techniques to modify or interpret existing images. One can improve picture quality through image processing techniques and can also be used for machine perception of visual information in robotics. In medical applications, image processing techniques can be applied for image enhancements and is been widely used for CT (Computer X-ray Tomography) and PET (Position Emission Tomography) images. 4/26/2020 COMPUTER GRAPHICS 25
  • 26.
  • 27.
    GRAPHICAL USER INTERFACE •GUI commonly used these days to make a software package more interactive. There are multiple window system, icons, menus, which allows a computer setup to be utilized more efficiently. 4/26/2020 COMPUTER GRAPHICS 27
  • 28.
  • 29.
    DISPLAY DEVICES • CRT •LCD • PLASMA 4/26/2020 COMPUTER GRAPHICS 29
  • 30.
    CATHOD RAY TUBES(CRTs) • CRT is one of the mostly used display technology. In CRT, a beam of electrons emitted by an electron gun strikes on specified positions on phosphor coated screen after passing through focusing and deflecting systems. 4/26/2020 COMPUTER GRAPHICS 30
  • 31.
    LIQUID CRYSTAL DISPLAYS(LCDs) • Organic molecules that remain in crystalline structure without external force, but re-aligns themselves like liquid under external force, So LCDs realigns themselves to EM field and changes their own polarizations. 4/26/2020 COMPUTER GRAPHICS 31
  • 32.
    PLASMA DISPLAYS • Theseare basically fluorescent tubes. High- voltage discharge excites gas mixture (He, Xe), upon relaxation UV light is emitted, UV light excites phosphors. 4/26/2020 COMPUTER GRAPHICS 32
  • 33.
    CRT DISPLAY TYPES •Raster Scan Displays – A rectangular array of points or dots. In a raster scan system, the electron beam is swept across the screen, one row at a time from top to bottom. As the electron beam moves across each row, the beam intensity is turned on and off to create a pattern of illuminated spots. • Random Scan Displays – Random scan display is the use of geometrical primitives such as points, lines, curves, and polygons, which are all based upon mathematical equation. In a random scan display, a CRT has the electron beam directed only to the parts of the screen where a picture is to be drawn. Random scan monitors draw a picture one line at a time. 4/26/2020 COMPUTER GRAPHICS 33
  • 34.
    CRT DISPLAY TYPESCONTINUED… 4/26/2020 COMPUTER GRAPHICS 34
  • 35.
    RELATED TERMINOLOGY • Persistence •Resolution • Aspect ratio • Frame buffer • Pixel • Bitmap or Pixmap 4/26/2020 COMPUTER GRAPHICS 35
  • 36.
    INPUT TECHNOLOGIES • TouchScreens • Light pen • Graphic Tablets 4/26/2020 COMPUTER GRAPHICS 36
  • 37.
    COORDINTE SYSTEM • Cartesiancoordinate system – It is also known as rectangular coordinate system and can be of two or three dimensions. A point in Cartesian coordinate system can be defined by specifying two numbers, called as x – coordinate and the y – coordinate of that point. 4/26/2020 COMPUTER GRAPHICS 37
  • 38.
    COORDINTE SYSTEM • Polarcoordinate system – In polar coordinate system, the position of a point is defined by specifying the distance (radius) from a fixed point called as origin and the angle between the line joining the point and the origin and the polar axis (horizontal line passing through the origin). 4/26/2020 COMPUTER GRAPHICS 38