Downloaded 47 times

![Related Works
• Template matching methods
– Genetic Algorithm Template Matching [10]
– 3D Template Matching [11]
• Model based methods
– Patient-specific models [5]
– Surface normal overlap model [7]
• Machine learning techniques
– Neural network [6]
– Fuzzy c-means clustering [9]
• Digital filtering
– Quantized convergence index filter [8]
– Iris filter [13]
• Statistical analysis [12]
4](https://image.slidesharecdn.com/computer-aideddetectionofpulmonarynodulesusinggeneticprogramming-141002001000-phpapp02/75/Computer-aided-detection-of-pulmonary-nodules-using-genetic-programming-4-2048.jpg)
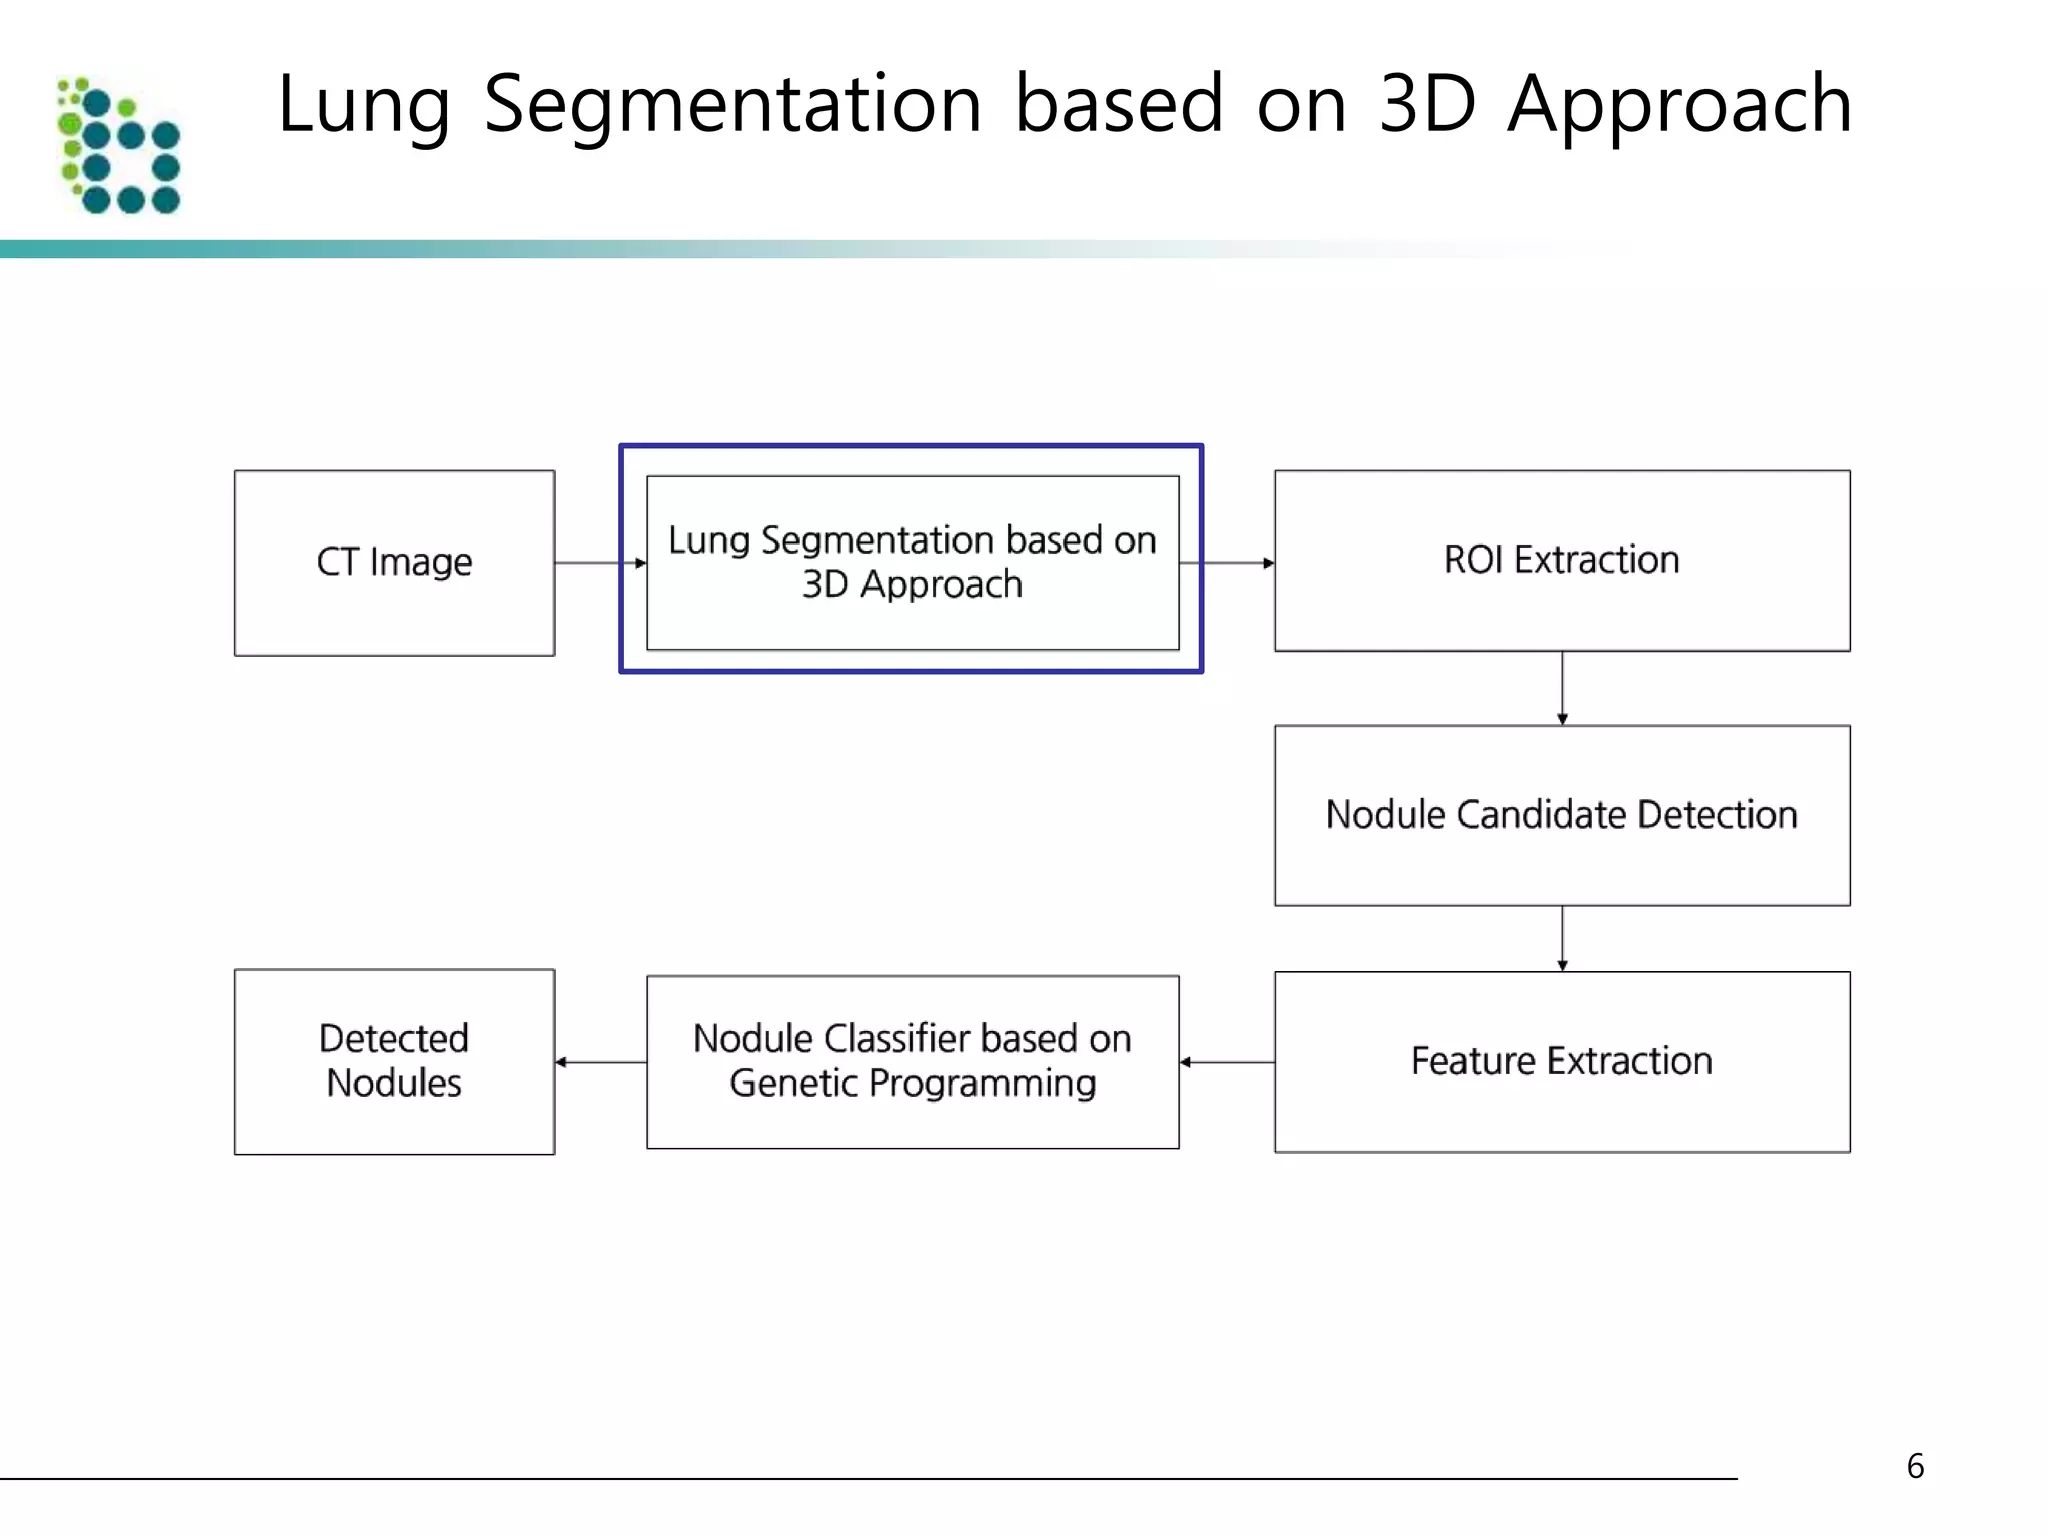
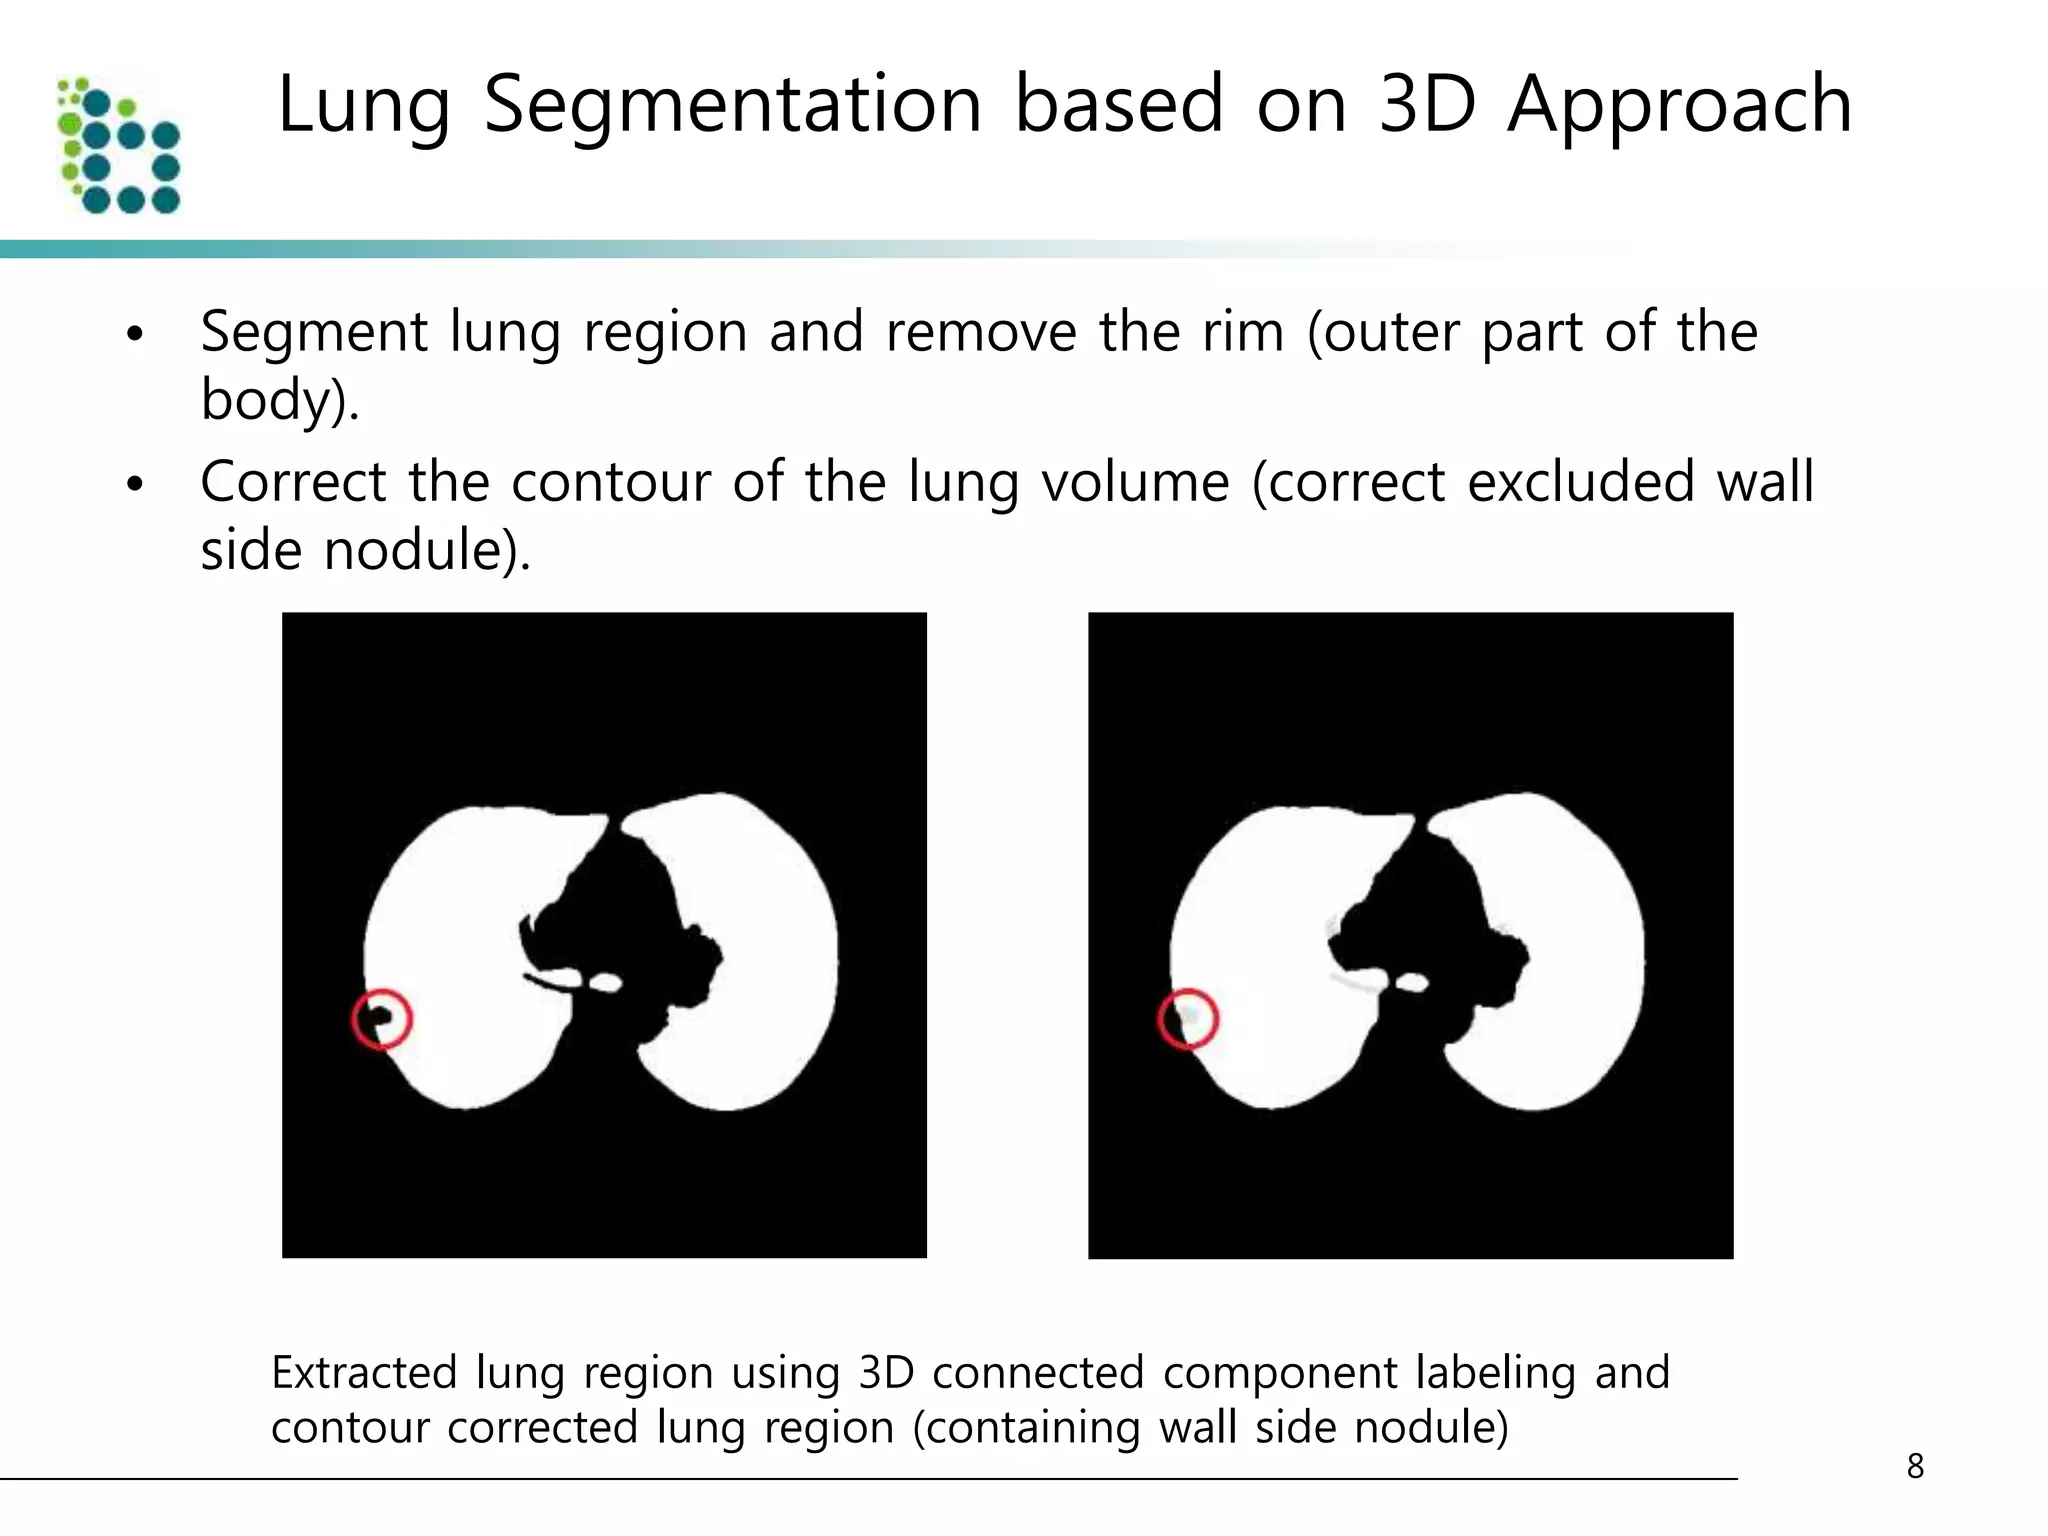
![Lung Segmentation based on 3D Approach
• Select adaptive threshold value at every slice in the CT image
sequence using diagonal intensity histogram [4].
• The CT images are divided into background area(body) and
foreground area(air or lung) as shown below.
7
Original CT image and converted CT image with threshold](https://image.slidesharecdn.com/computer-aideddetectionofpulmonarynodulesusinggeneticprogramming-141002001000-phpapp02/75/Computer-aided-detection-of-pulmonary-nodules-using-genetic-programming-7-2048.jpg)
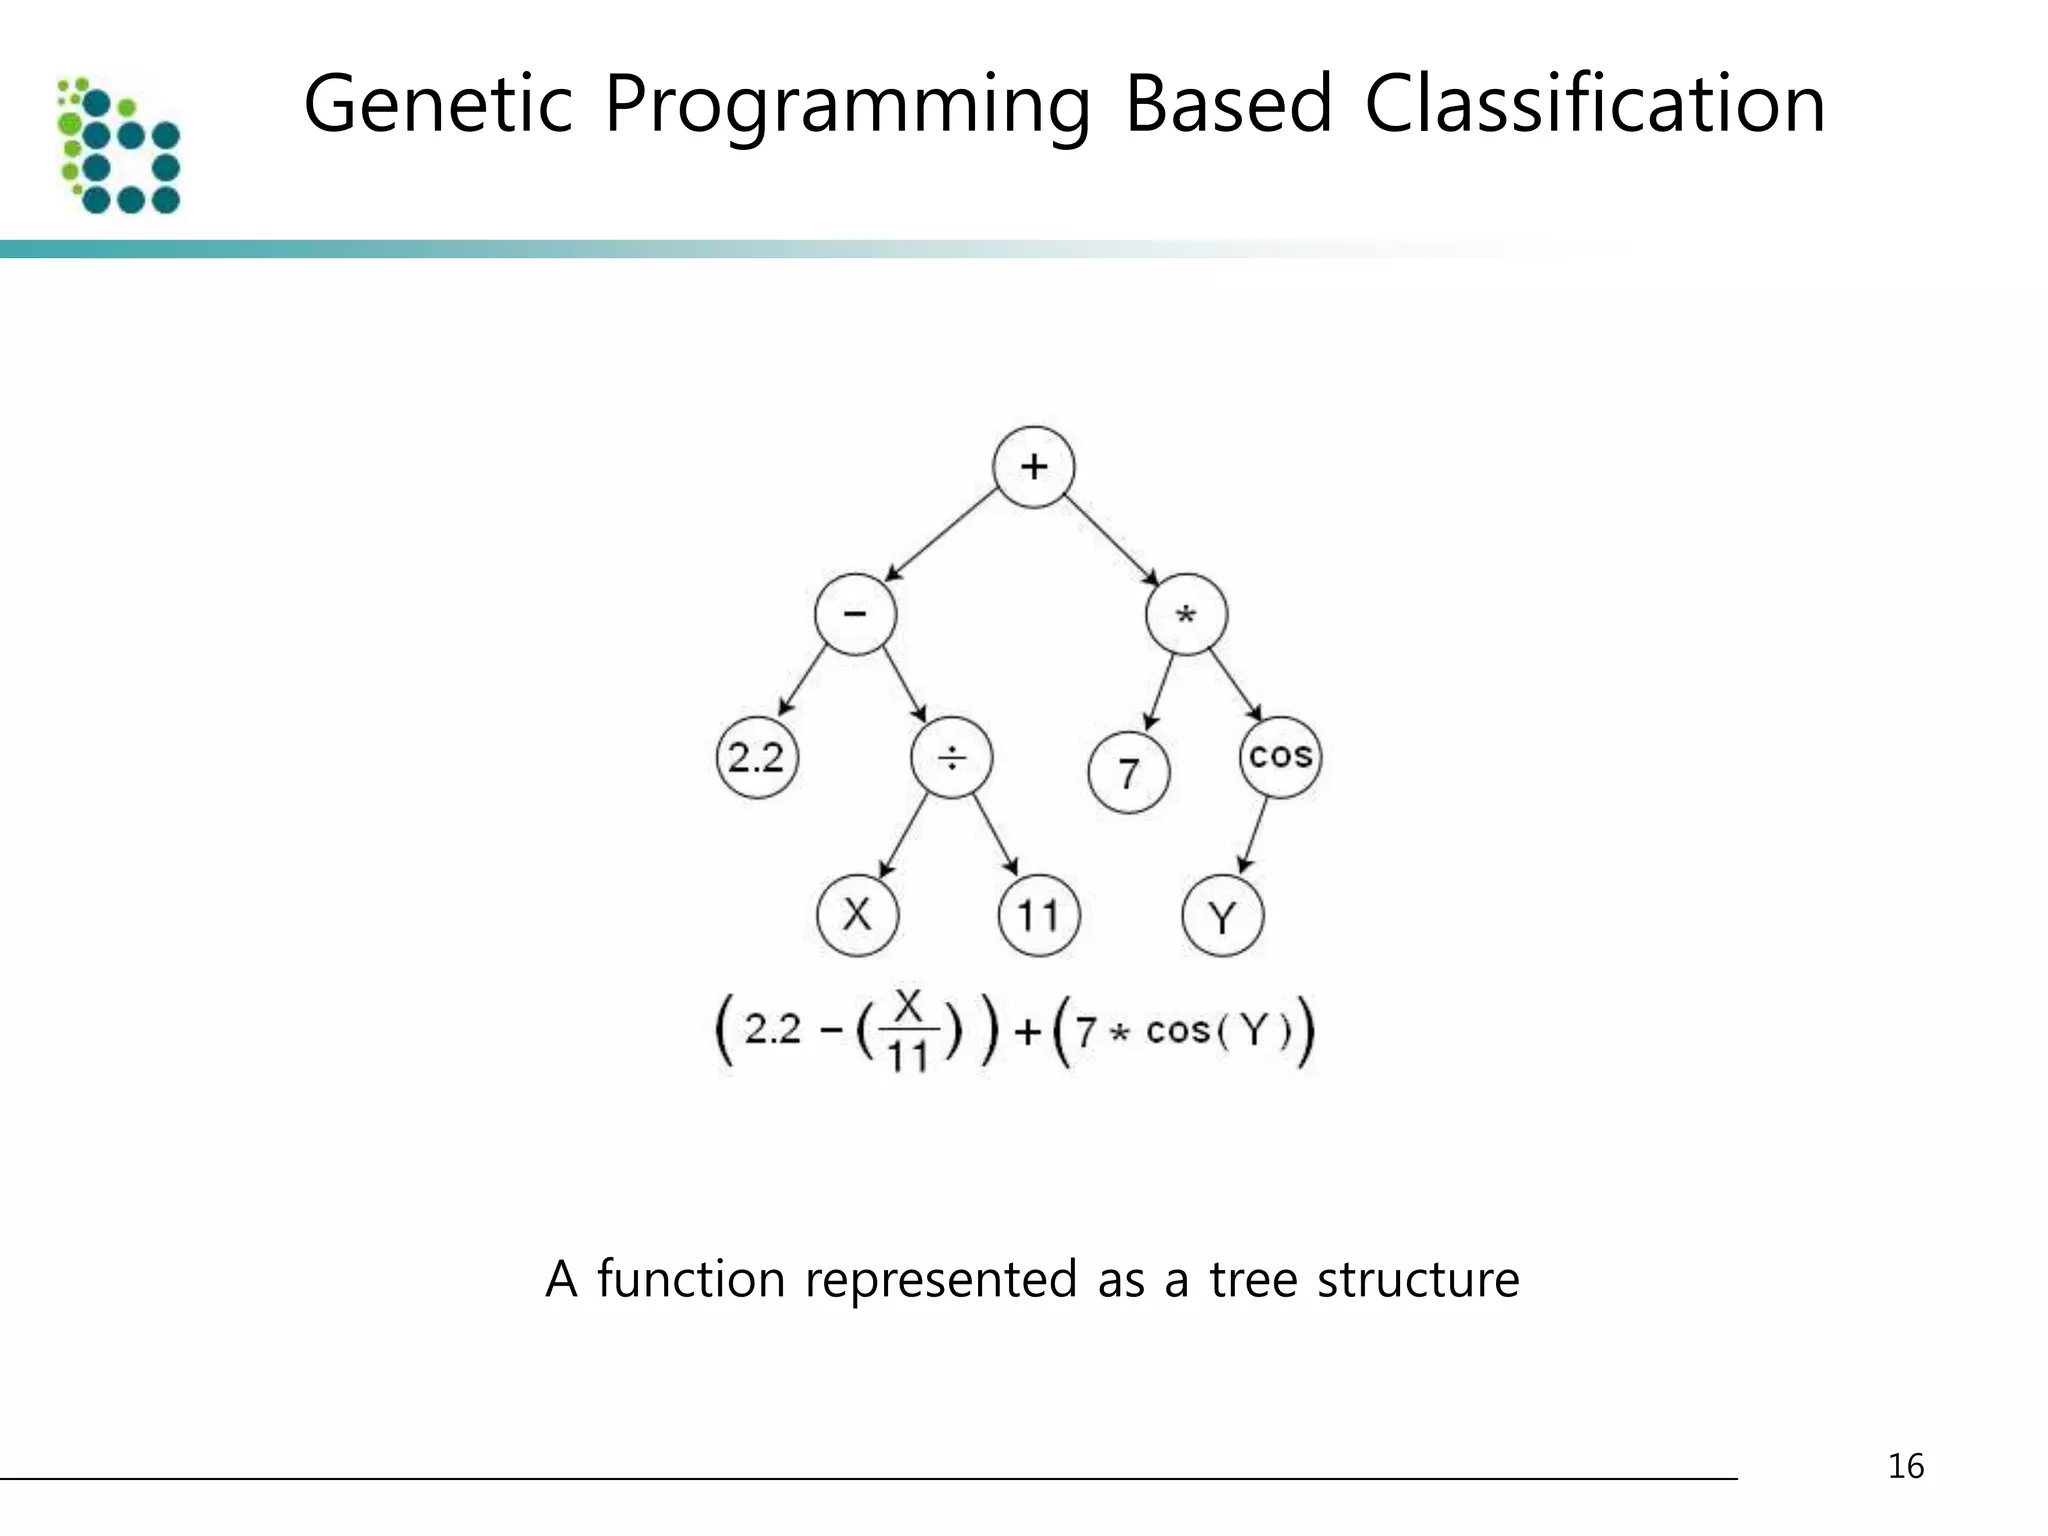
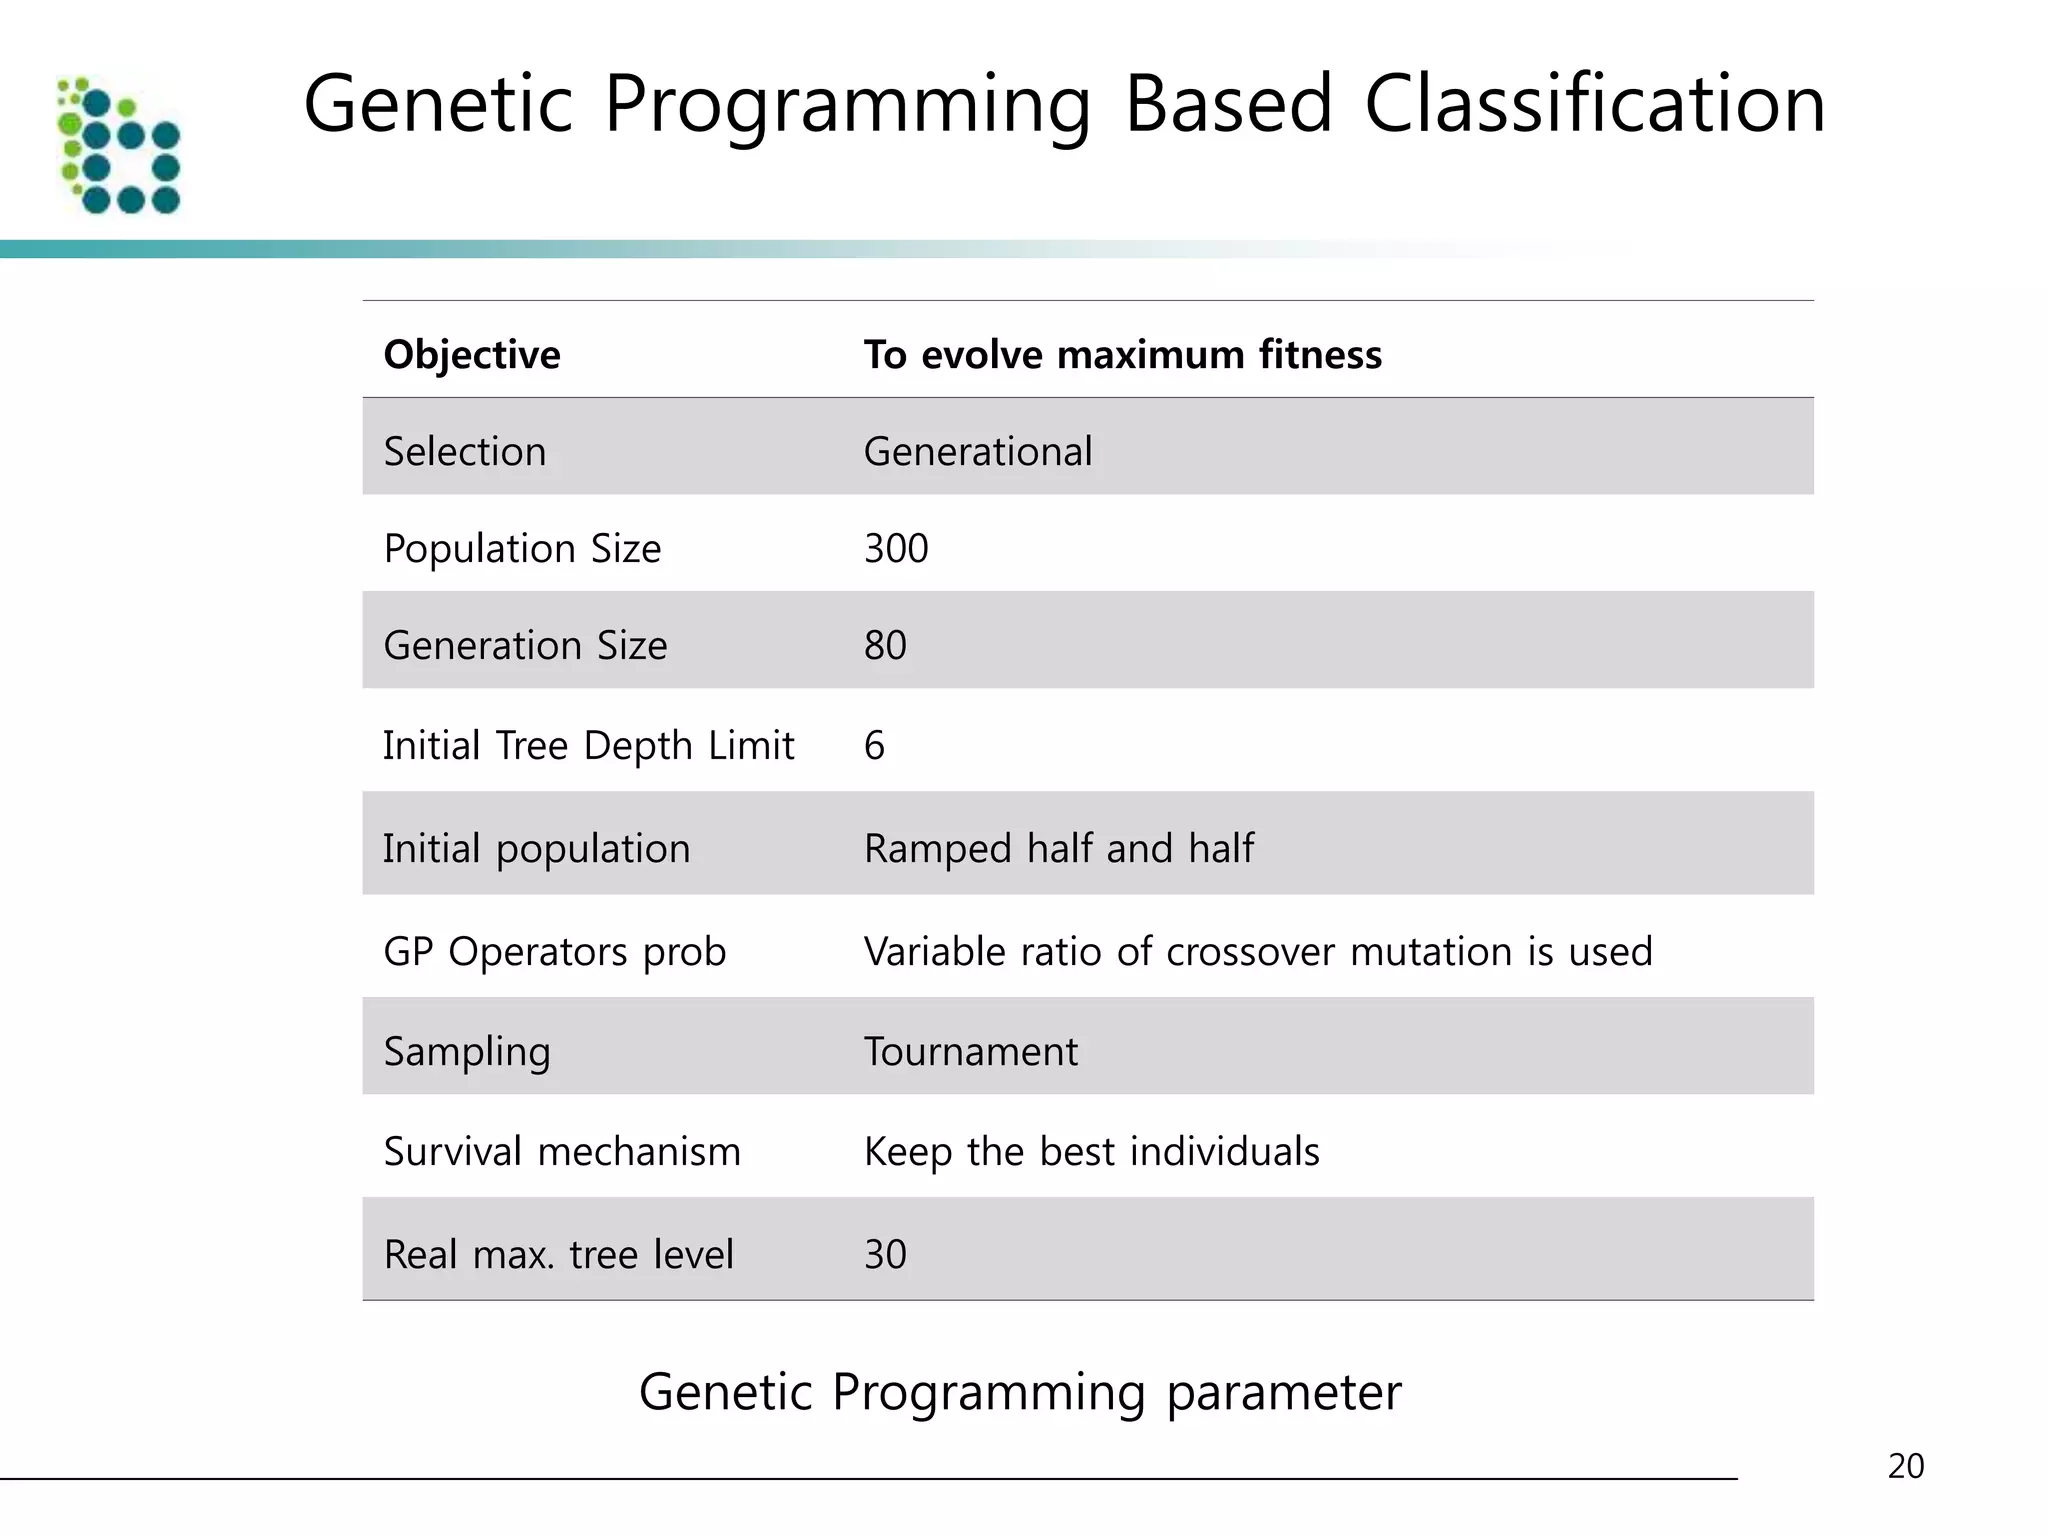
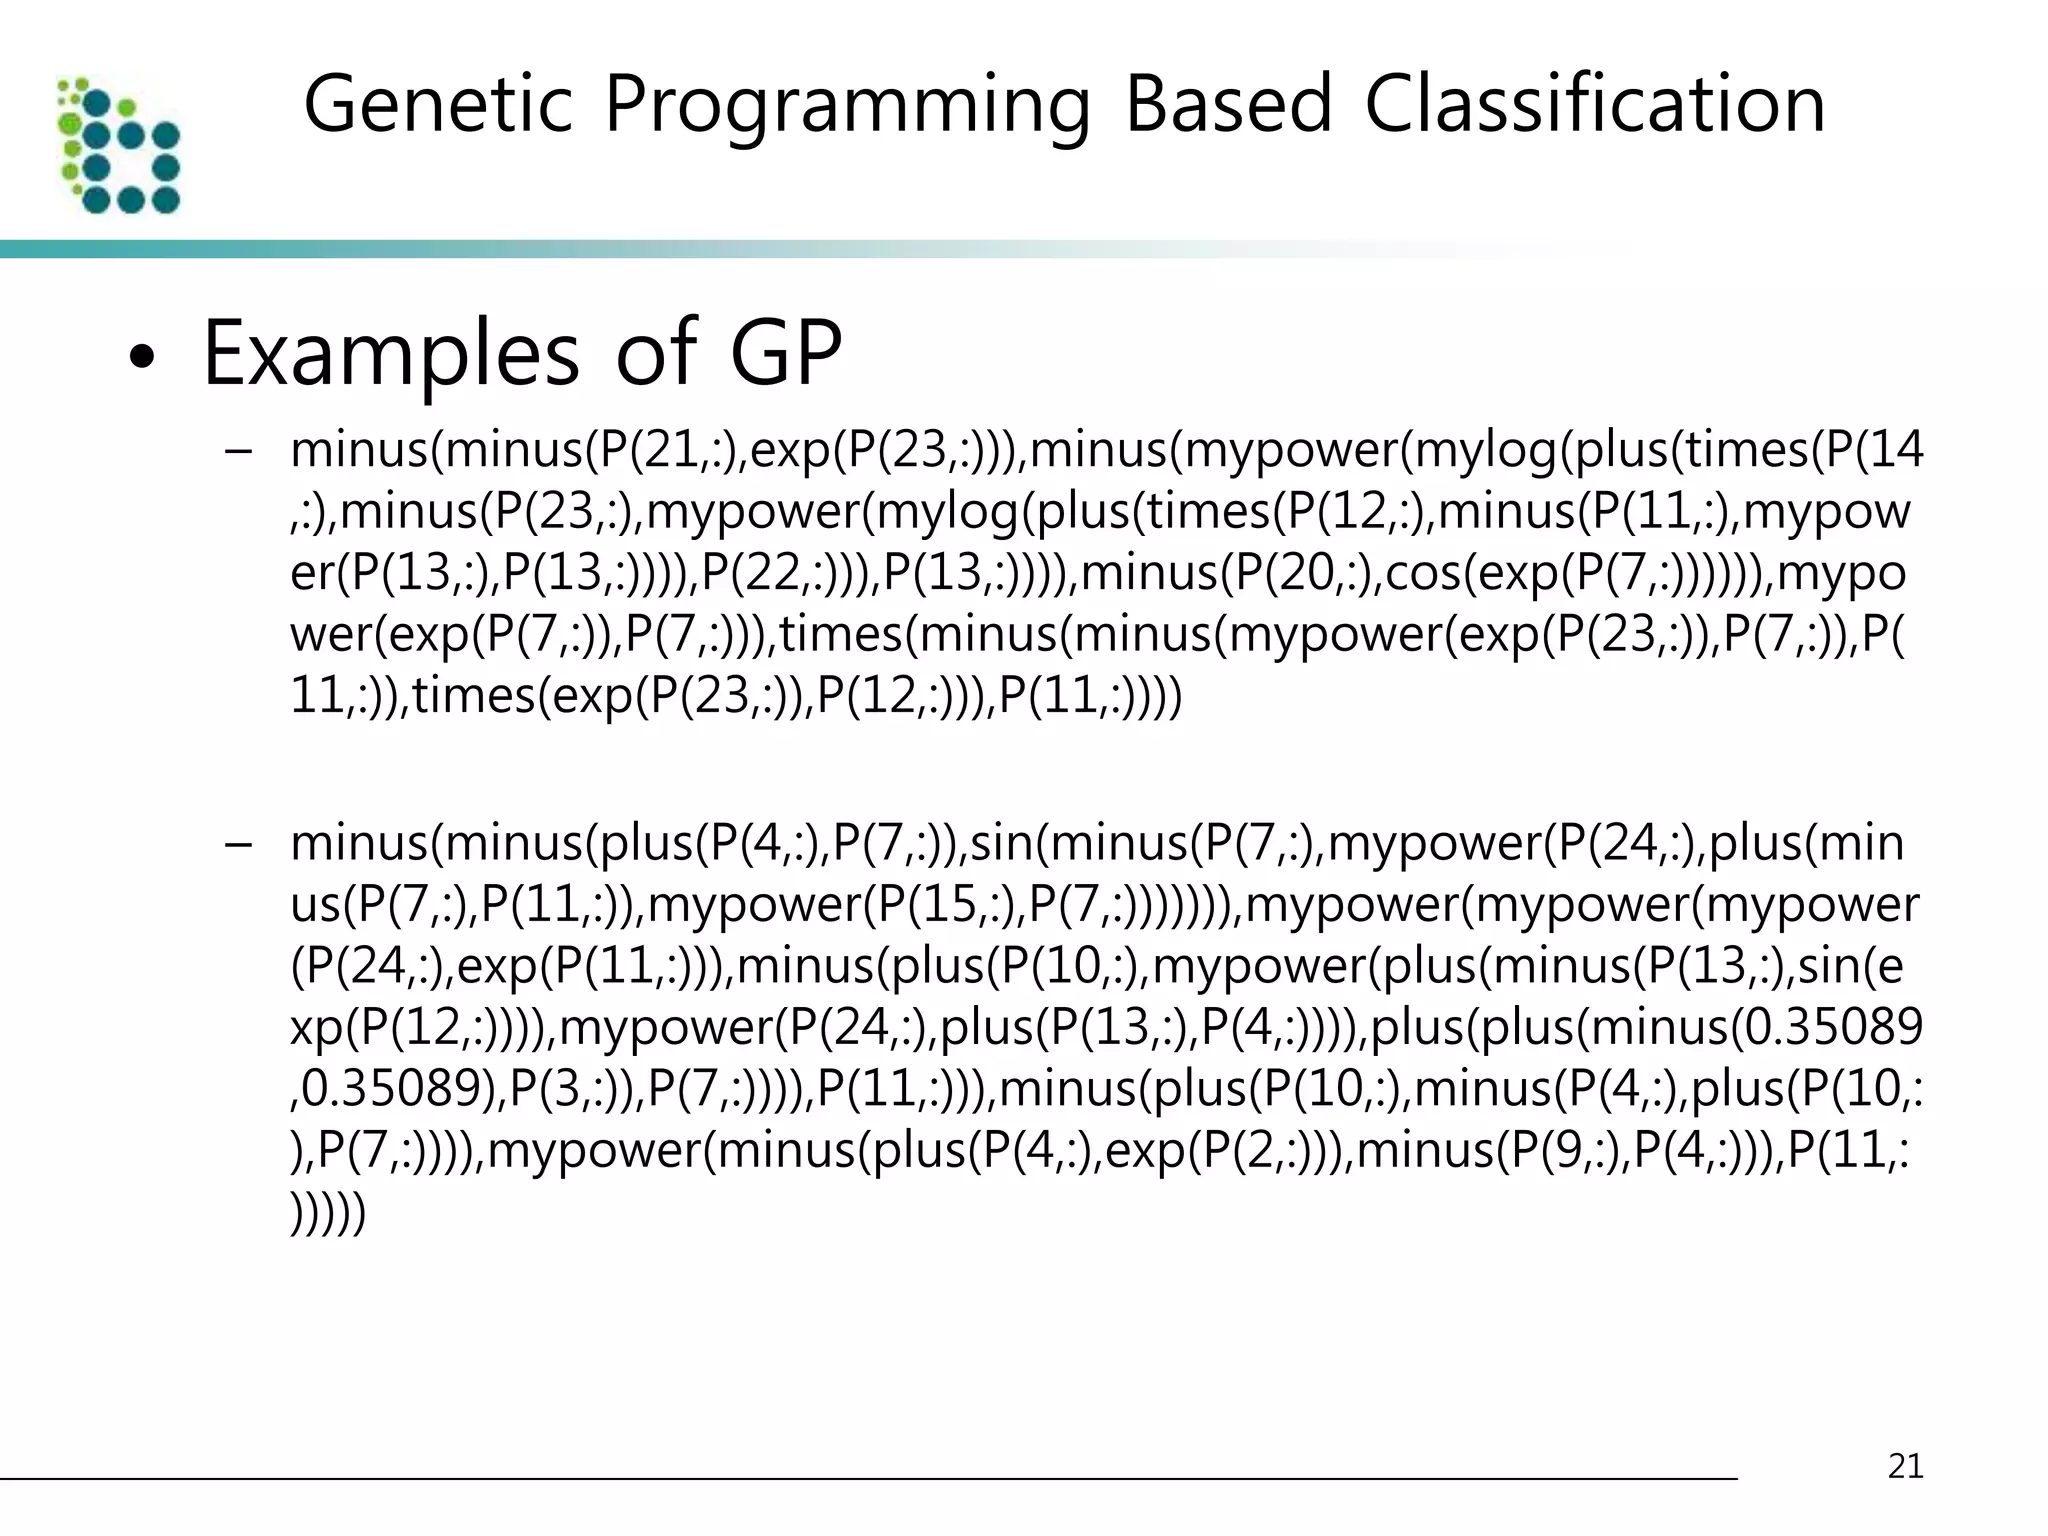
![Genetic Programming Based Classification
• Genetic Programming (GP)
– an evolutionary optimization technique [14].
• The basic structure of GP is very similar to
Genetic Algorithm(GA).
• The chromosome
– GA : variable (binary digit)
– GP : program (tree or graph)
15](https://image.slidesharecdn.com/computer-aideddetectionofpulmonarynodulesusinggeneticprogramming-141002001000-phpapp02/75/Computer-aided-detection-of-pulmonary-nodules-using-genetic-programming-15-2048.jpg)
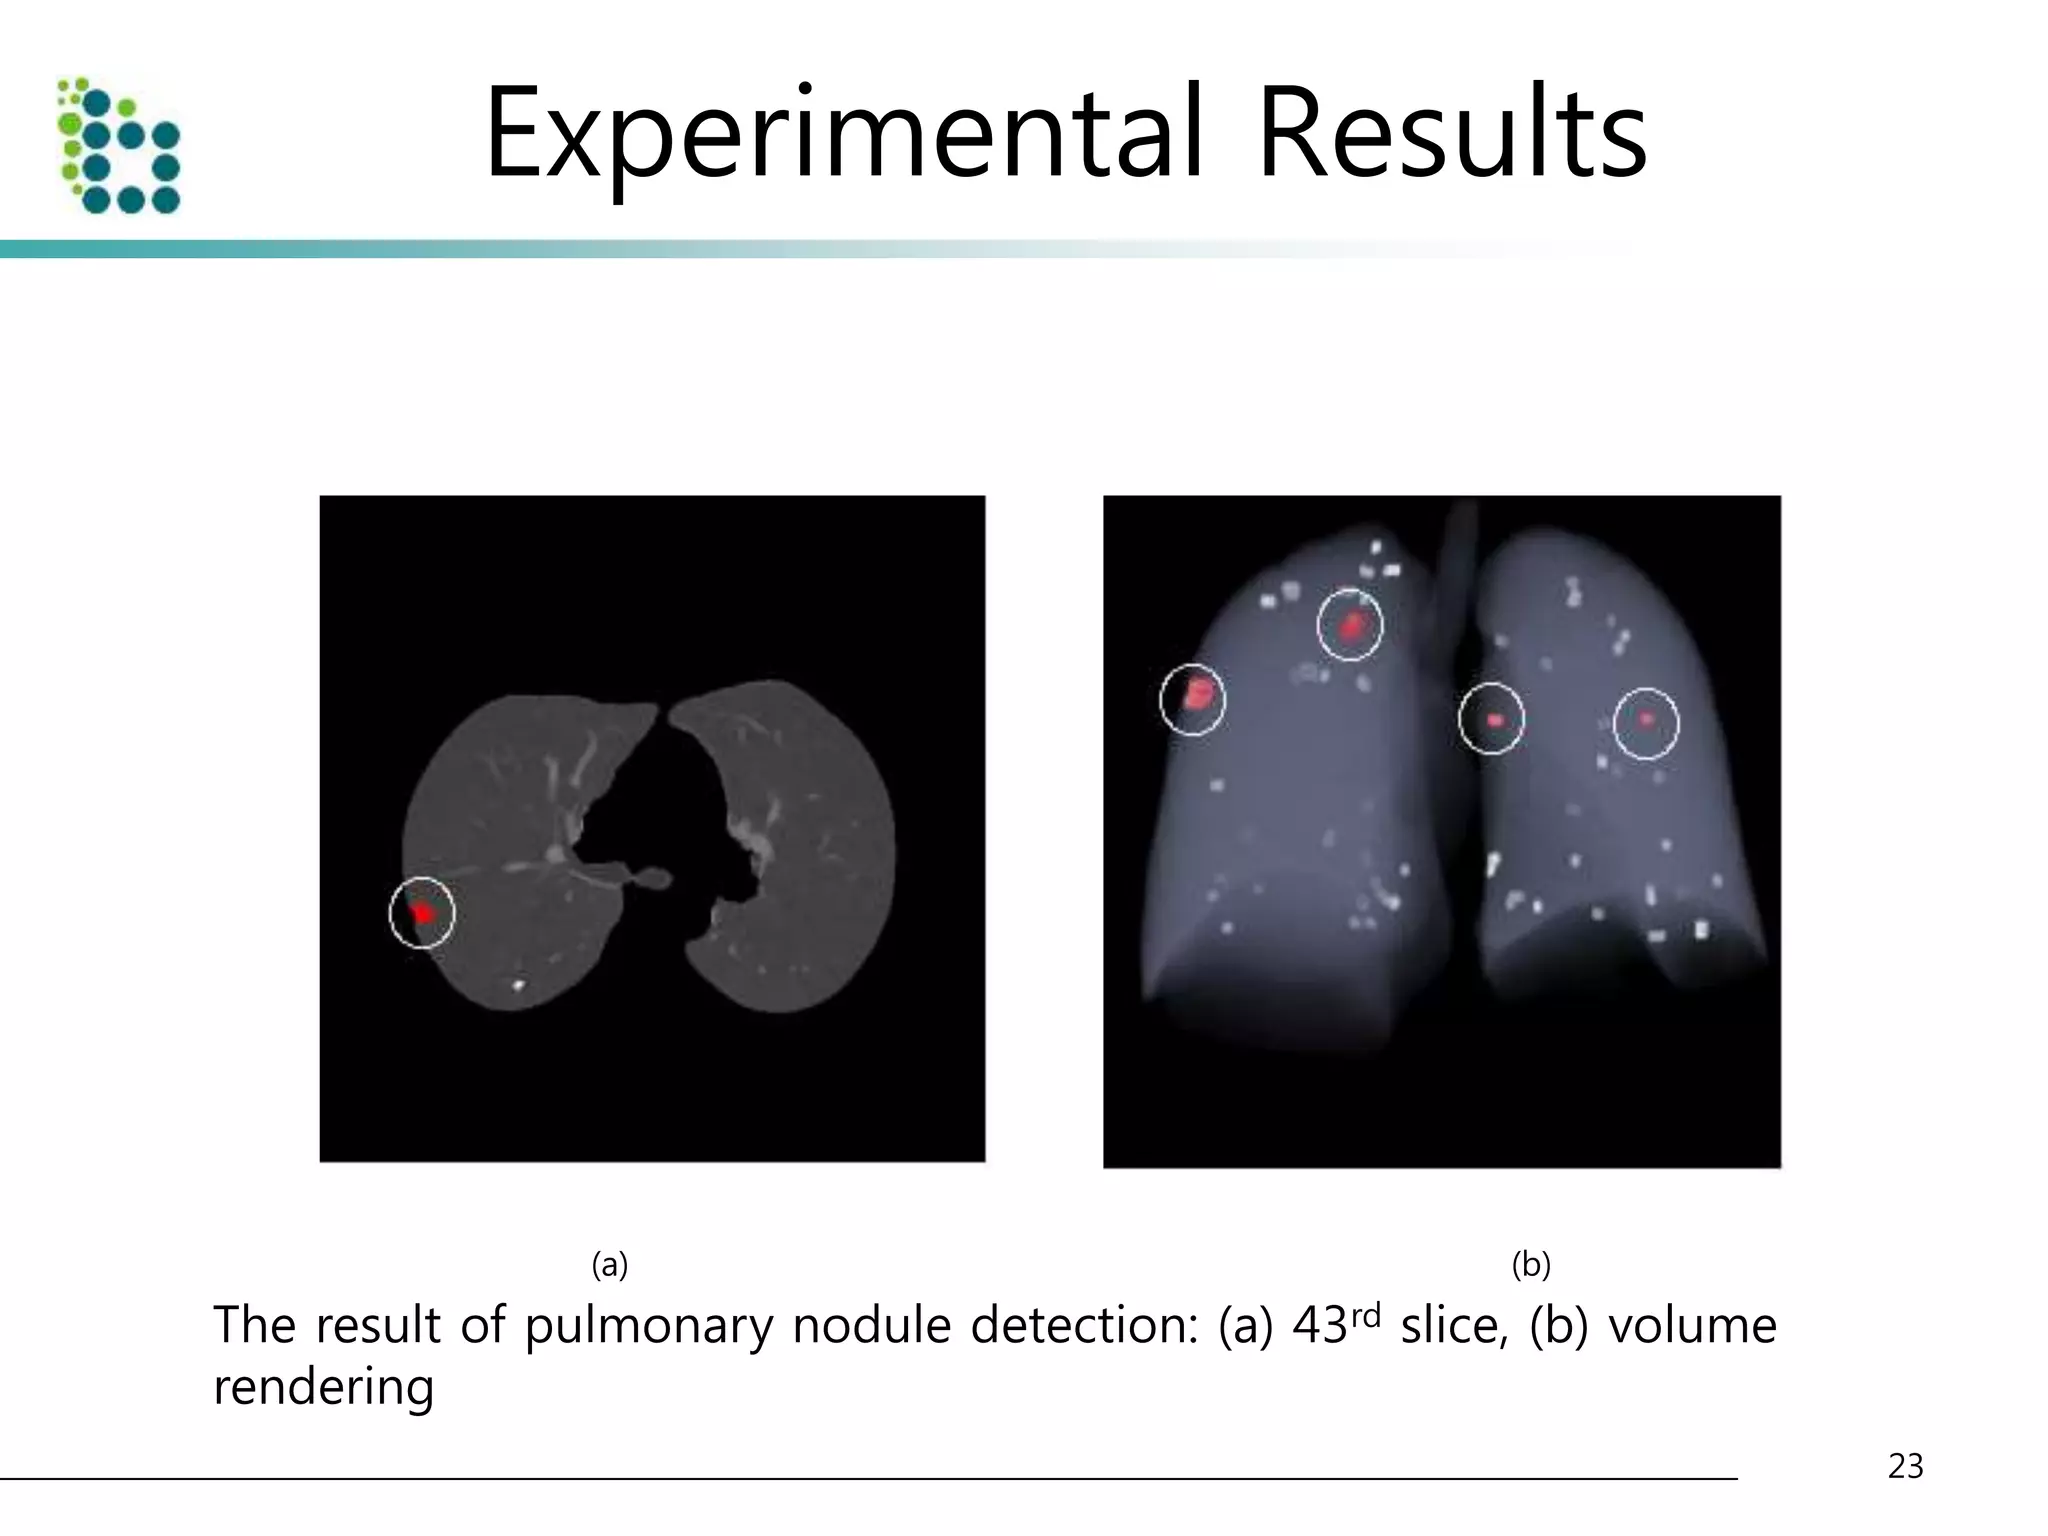
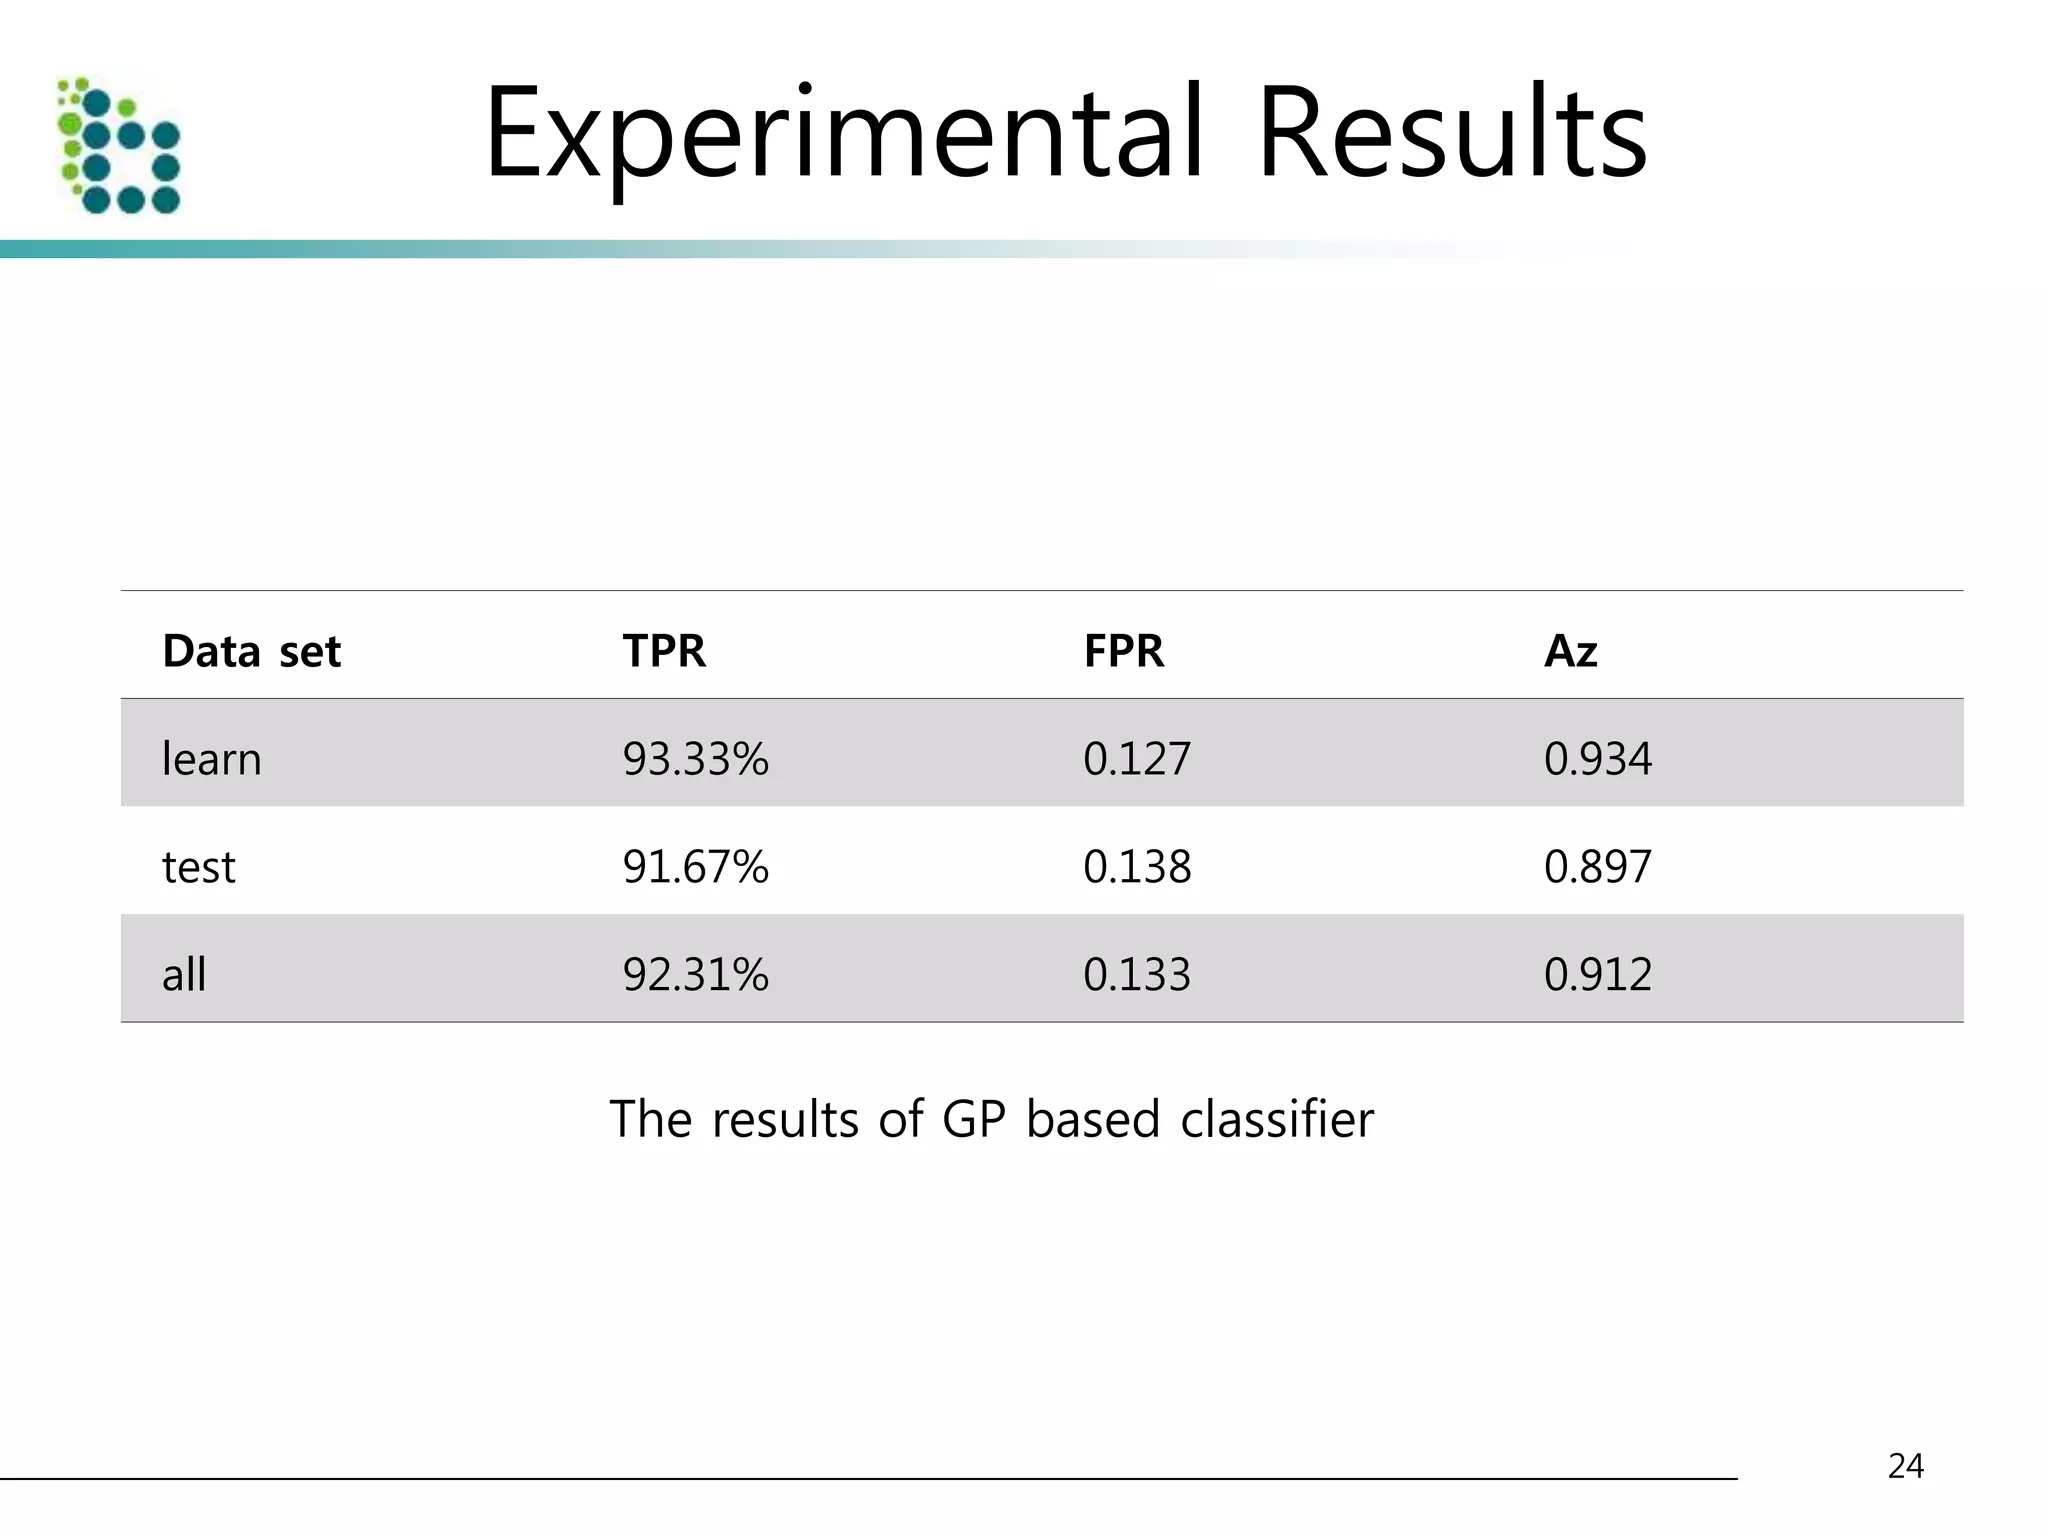
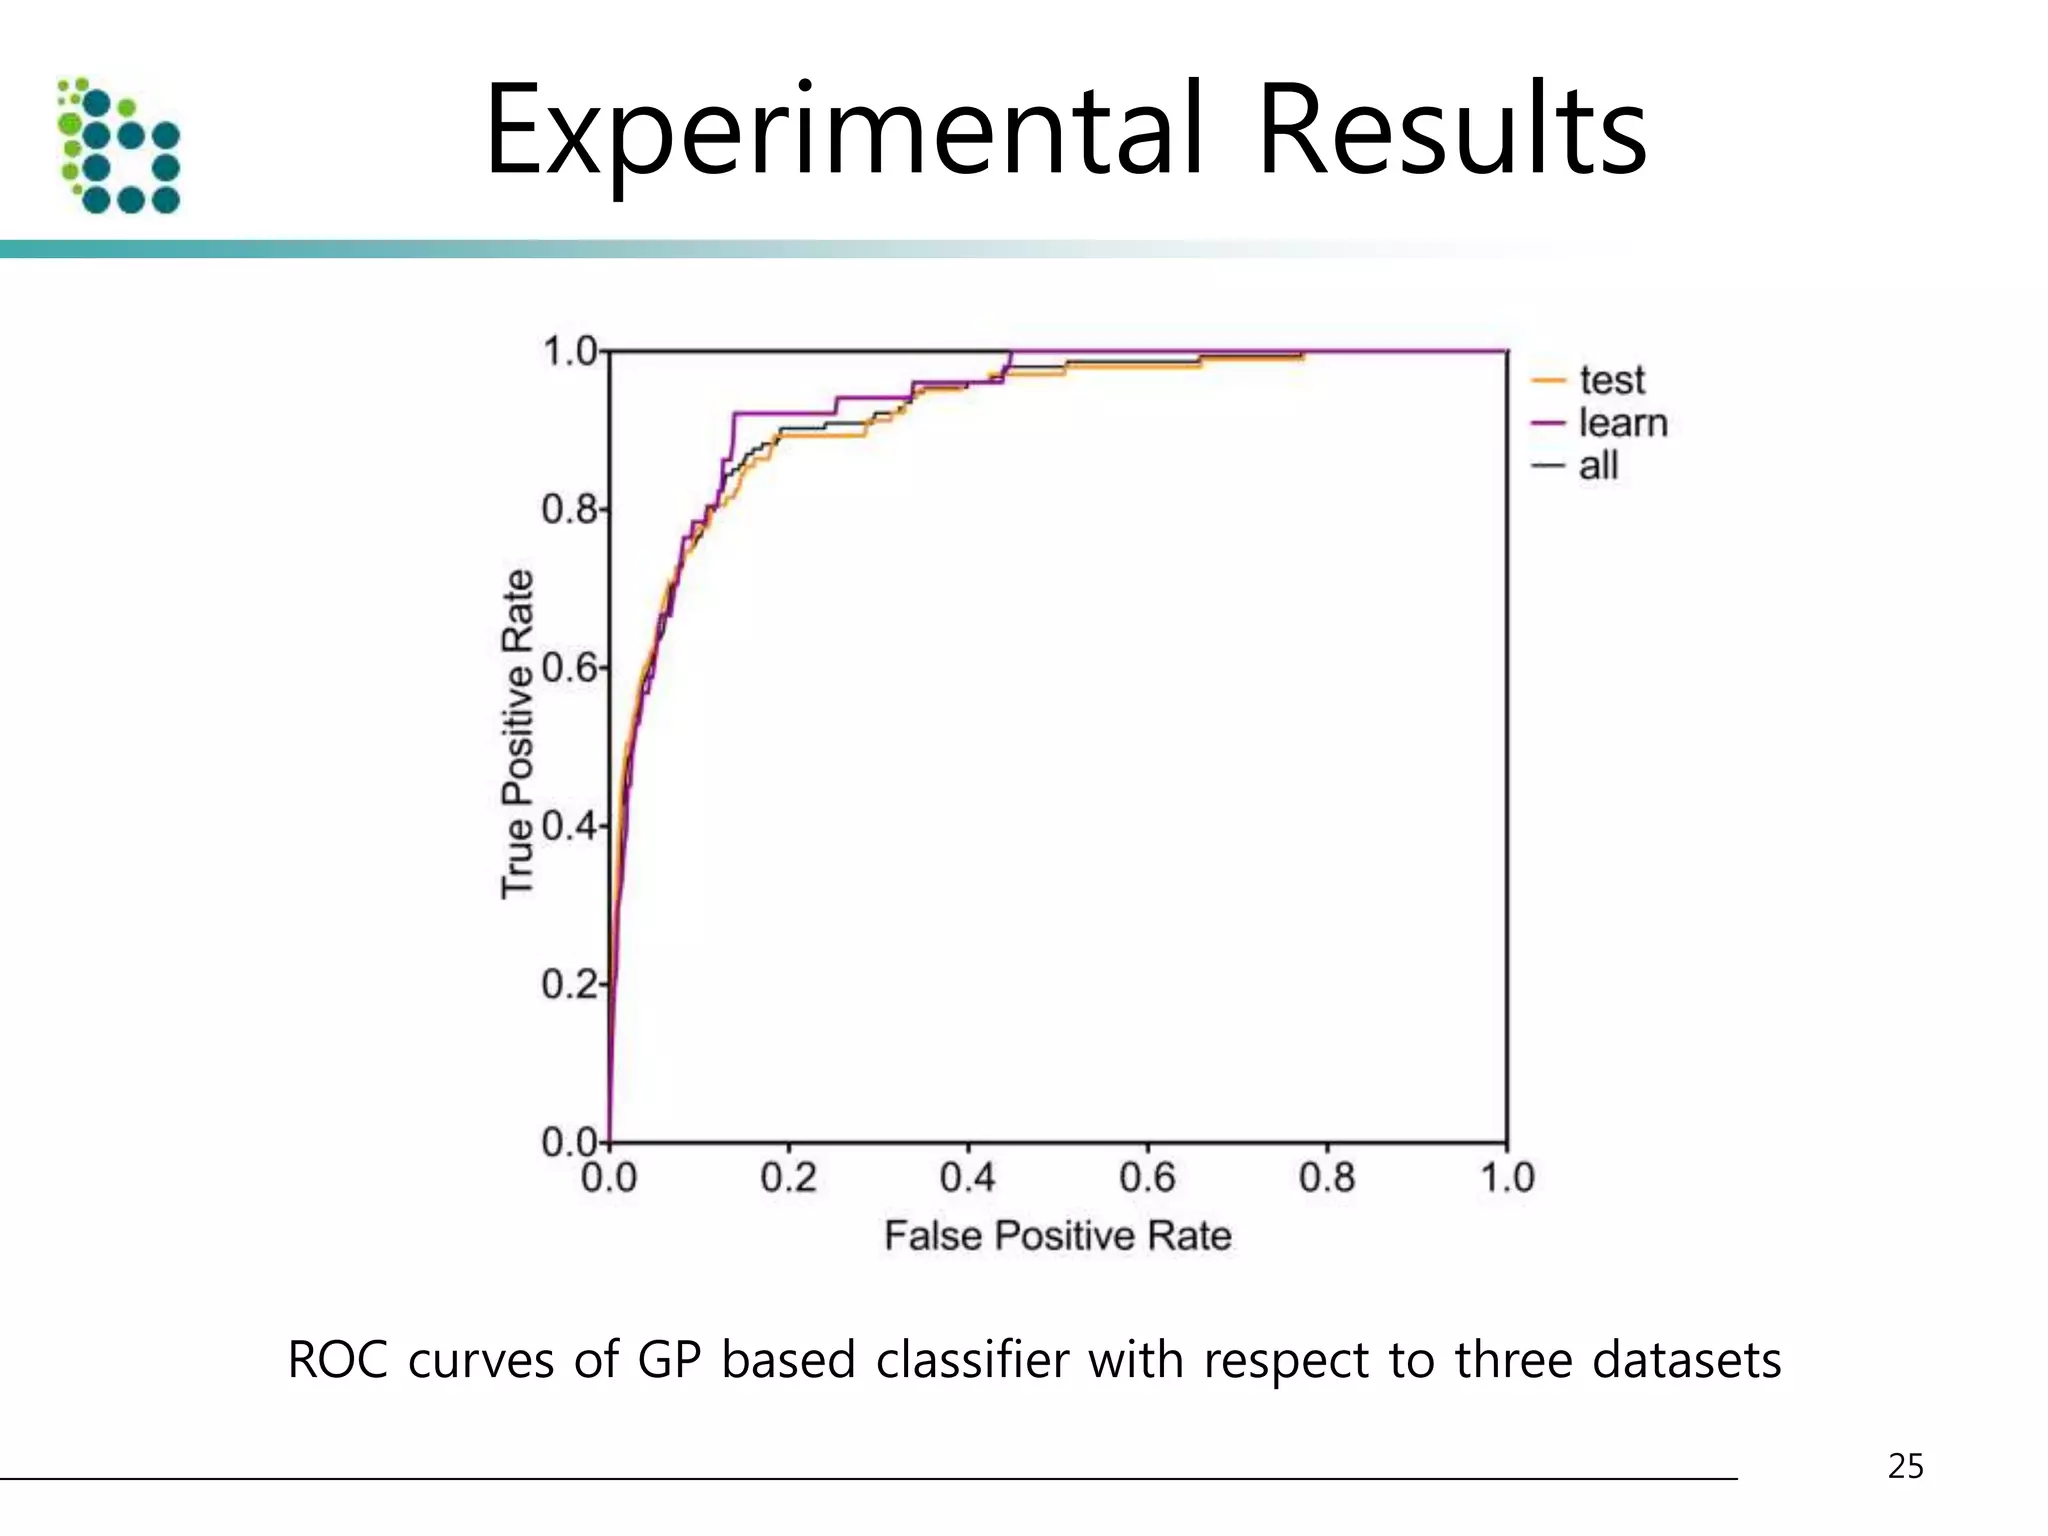
![Experimental Results
• Lung Image Database Consortium (LIDC) database [15]
– to evaluate the performance of the proposed method.
– The LIDC is developing a publicly available database of thoracic computed
tomography (CT) scans as a medical imaging research resource to promote
the development of computer-aided detection or characterization of
pulmonary Nodules.
– The database is separated into 84 cases, each containing around 100-400
Digital Imaging and Communication (DICOM) images and an XML data file
containing the physician annotations
• We applied our method to 32 scans consisting of 153 nodules
and 7528 slices. The pixel size in the database ranged from 0.65
to 0.75 mm and the reconstruction interval ranged.
• The half of dataset(16 scans) is used for training and another half
of dataset(another 16 scans) is used for testing the classifier.
22](https://image.slidesharecdn.com/computer-aideddetectionofpulmonarynodulesusinggeneticprogramming-141002001000-phpapp02/75/Computer-aided-detection-of-pulmonary-nodules-using-genetic-programming-22-2048.jpg)
![References
• [1] Ahmedin Jemal, Rebecca Siegel, ElizabethWard, Yongping Hao, Jiaquan Xu, and Michael J
Thun, “Cancerstatistics, 2009,” CA Cancer J Clin, vol. 59, no. 4, pp. 225–49, Jan 2009.
• [2] K-W Jung, Y-J Won, S Park, H-J Kong, J Sung, H-R Shin, E-Cl Park, and J S Lee, “Cancer
statistics in korea: incidence, mortality and survival in 2005,” J Korean Med Sci, vol. 24, no. 6,
pp. 995–1003, Dec 2009.
• [3] Qiang Li, “Recent progress in computer-aided diagnosis of lung nodules on thin-section
ct.,” Comput Med Imaging Graph, vol. 31, no. 4-5, pp. 248–257, 2007.
• [4] S G Armato, M L Giger, C J Moran, J T Blackburn, K Doi, and H MacMahon, “Computerized
detection of pulmonary nodules on ct scans,” Radiographics, vol. 19, no. 5, pp. 1303–11, Jan
1999.
• [5] M Brown, M McNitt-Gray, J Goldin, R Suh, J Sayre, and D Aberle, “Patient-specific models
for lung nodule detection and surveillance in ct images,” IEEE TMI, vol. 20, no. 12, pp. 1242 –
1250, Dec 2001.
• [6] K Suzuki, SG Armato III, F Li, S Sone, and K Doi, “Massive training artificial neural network
(mtann) for reduction of false positives in computerized detection of lung nodules in low-dose
computed tomography,” Medical physics, vol. 30, pp. 1602, 2003.
• [7] D Paik, C Beaulieu, G Rubin, B Acar, R Jeffrey, J Yee, J Dey, and S Napel, “Surface normal
overlap: a computer-aided detection algorithm with application to colonic polyps and lung
nodules in helical ct,” IEEE TMI, vol. 23, no. 6, pp. 661 – 675, Jun 2004.
• [8] Sumiaki Matsumoto, Harold L Kundel, James C Gee, Warren B Gefter, and Hiroto Hatabu,
“Pulmonary nodule detection in ct images with quantized convergence index filter.,” Med
Image Anal, vol. 10, no. 3, pp. 343–352, Jun 2006.
27](https://image.slidesharecdn.com/computer-aideddetectionofpulmonarynodulesusinggeneticprogramming-141002001000-phpapp02/75/Computer-aided-detection-of-pulmonary-nodules-using-genetic-programming-27-2048.jpg)
![References
• [9] N Memarian, J Alirezaie, and P Babyn, “Computerized detection of lung nodules with an
enhanced false positive reduction scheme,” IEEE ICIP 2006, pp. 1921 –1924, Sep 2006.
• [10] Jamshid Dehmeshki, Xujiong Ye, Xinyu Lin, Manlio Valdivieso, and Hamdan Amin,
“Automated detection of lung nodules in ct images using shape-based genetic algorithm.,”
Comput Med Imaging Graph, vol. 31, no. 6, pp. 408–417, Sep 2007.
• [11] Onur Osman, Serhat Ozekes, and Osman N Ucan, “Lung nodule diagnosis using 3d
template matching.,” Comput Biol Med, vol. 37, no. 8, pp. 1167–1172, Aug 2007.
• [12] A El-Baz, G Gimel’farb, R Falk, and M Abo El-Ghar, “Automatic analysis of 3d low dose ct
images for early diagnosis of lung cancer,” Pattern Recognition, vol. 42, no. 6, pp. 1041–1051,
Jan 2009.
• [13] JJ Su´arez-Cuenca, PG Tahoces, M Souto, MJ Lado, M Remy-Jardin, J Remy, and J Jos´e
Vidal, “Application of the iris filter for automatic detection of pulmonary nodules on
computed tomography images,” Computers in Biology and Medicine, 2009.
• [14] J Koza, “Genetic programming: On the programming of computers by means of natural
selection,” The MIT Press, Jan 1992.
• [15] S G Armato, G McLennan, M F McNitt-Gray, C R Meyer, D Yankelevitz, D R Aberle, C I
Henschke, E A Hoffman, E A Kazerooni, H MacMahon, A P Reeves, B Y Croft, L P Clarke, and
Lung Image Database Consortium Research Group, “Lung image database consortium:
developing a resource for the medical imaging research community.,” Radiology, vol. 232, no.
3, pp. 739–748, Sep 2004.
28](https://image.slidesharecdn.com/computer-aideddetectionofpulmonarynodulesusinggeneticprogramming-141002001000-phpapp02/75/Computer-aided-detection-of-pulmonary-nodules-using-genetic-programming-28-2048.jpg)


This document describes a method for detecting pulmonary nodules in CT scans using genetic programming. It first segments the lung regions from CT images and extracts nodule candidates. Features are then extracted from the candidates. Genetic programming is used to classify candidates as nodules or non-nodules by optimizing combinations of features. The method was tested on a publicly available lung image database, achieving a true positive rate of over 90% and low false positive rate.