Individually Optimized Contrast-Enhanced 4D-CT for Radiotherapy Simulation in Pancreatic Adenocarcinoma

Purpose/Objectives: To develop an individually optimized contrast-enhanced (CE) 4D-CT for radiotherapy simulation in pancreatic adenocarcinoma (PDA). Materials/Methods: Ten PDA patients were enrolled and underwent three CT scans: a 4D-CT immediately following a CE 3D-CT, and an individually optimized CE 4D-CT using a test injection to estimate the peak contrast enhancement time and to optimize the delay time. Three physicians contoured the tumor and pancreatic tissues. We compared image quality scores, tumor volume, motion, image noise, tumor-to-pancreas contrast, and contrast-to- noise ratio (CNR) in the three CTs. We also evaluated inter-observer variations in contouring the tumor using simultaneous truth and performance level estimation (STAPLE). Results: The average image quality scores for CE 3D-CT and CE 4D-CT were comparable (4.0 and 3.8, p=0.47), and both were significantly better than that for 4D-CT (2.6, p<0.001). The tumor-to- pancreas contrast in CE 3D-CT and CE 4D-CT were comparable (15.5 and 16.7 HU, p=0.71), and the later was significantly higher than that in 4D-CT (9.2 HU, p=0.03). Image noise in CE 3D-CT (12.5 HU) was significantly lower than that in CE 4D-CT (22.1 HU, p<0.001) and 4D-CT (19.4 HU, p=0.005). The CNR in CE 3D-CT and CE 4D-CT were comparable (1.4 and 0.8, p=0.23), and the former was significantly better than that in 4D-CT (0.6, p=0.04). The average tumor volume was smaller in CE 3D-CT (29.8 cm 3 ) and CE 4D-CT (22.8 cm 3 ) than in 4D-CT (42.0 cm 3 ), though the differences were not statistically significant. The tumor motion was comparable in 4D-CT and CE 4D-CT (7.2 and 6.2 mm, p=0.23). The inter-observer variations were comparable in CE 3D-CT and CE 4D-CT (Jaccard index 66.0% and 61.9%), and the former was significantly smaller than that of 4D-CT (55.6%, p=0.047). Conclusions: The CE 4D-CT demonstrated largely comparable characteristics to the CE 3D-CT. It has high potential for simultaneously delineating the tumor and quantifying the tumor motion with a single scan.
Recommended

Recommended
More Related Content
What's hot
What's hot (20)
Similar to Individually Optimized Contrast-Enhanced 4D-CT for Radiotherapy Simulation in Pancreatic Adenocarcinoma
Similar to Individually Optimized Contrast-Enhanced 4D-CT for Radiotherapy Simulation in Pancreatic Adenocarcinoma (20)
More from Wookjin Choi
More from Wookjin Choi (20)
Recently uploaded
Recently uploaded (20)
Individually Optimized Contrast-Enhanced 4D-CT for Radiotherapy Simulation in Pancreatic Adenocarcinoma
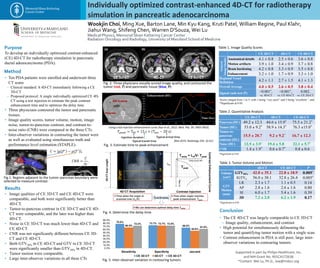
- 1. Individually optimized contrast-enhanced 4D-CT for radiotherapy simulation in pancreatic adenocarcinoma Wookjin Choi, Ming Xue, Barton Lane, Min Kyu Kang, Kruti Patel, William Regine, Paul Klahr, Jiahui Wang, Shifeng Chen, Warren D'Souza, Wei Lu Medical Physics, Memorial Sloan Kettering Cancer Center Radiation Oncology and Radiology, University of Maryland School of Medicine Purpose Results Method To develop an individually optimized contrast-enhanced (CE) 4D-CT for radiotherapy simulation in pancreatic ductal adenocarcinoma (PDA). • Ten PDA patients were enrolled and underwent three CT scans – Clinical standard: A 4D-CT immediately following a CE 3D-CT – Proposed protocol: A single individually optimized CE 4D- CT using a test injection to estimate the peak contrast enhancement time and to optimize the delay time. • Three physicians contoured the tumor and pancreatic tissues. • Image quality scores, tumor volume, motion, image noise, tumor-to-pancreas contrast, and contrast-to- noise ratio (CNR) were compared in the three CTs. • Inter-observer variations in contouring the tumor were as well as evaluated using simultaneous truth and performance level estimation (STAPLE). • The CE 4D-CT was largely comparable to CE 3D-CT – Image quality, enhancement, and contrast • High potential for simultaneously delineating the tumor and quantifying tumor motion with a single scan. • Contrast enhancement in PDA is still poor, large inter- observer variations in contouring tumors. • Image qualities of CE 3D-CT and CE 4D-CT were comparable, and both were significantly better than 4D-CT. • Tumor-to-pancreas contrast in CE 3D-CT and CE 4D- CT were comparable, and the later was higher than 4D-CT. • Noise in CE 3D-CT was much lower than 4D-CT and CE 4D-CT. • CNR was not significantly different between CE 3D- CT and CE 4D-CT. • Both GTV50% in CE 4D-CT and GTV in CE 3D-CT were significantly smaller than GTV50% in 4D-CT. • Tumor motion were comparable. • Large inter-observer variations in all three CTs CE 3D-CT CE 4D-CT4D-CT Fig. 2. Three physicians visually scored image quality, and contoured the tumor (red, T) and pancreatic tissue (blue, P). 𝐶𝑁𝑅 = 𝐶 𝜎𝑓 ,T P Conclusion CE 3D-CT 4D-CT CE 4D-CT Pancreas (HU) 49.2 ± 12.3 44.6 ± 15.9* 75.5 ± 21.2* Tumor(HU) 53.0 ± 9.2* 58.9 ± 14.3* 76.3 ±15.0* Tumor-to- pancreas contrast (HU) 15.5 ± 20.7 9.2 ± 9.2* 16.7 ± 12.3 Noise (HU) 12.5 ± 3.9* 19.4 ± 5.8 22.1 ± 5.7* CNR 1.4 ± 1.9* 0.6 ± 0.7* 0.8 ± 0.6 CE 3D-CT 4D-CT CE 4D-CT General ImageQuality Anatomical details 4.1 ± 0.8 2.5 ± 0.6 3.6 ± 0.8 Motion artifacts 3.9 ± 1.0 3.4 ± 0.9 3.7 ± 0.8 Beam hardening 4.2 ± 0.8 3.3 ± 0.9 3.5 ± 0.8 Enhancement 3.2 ± 1.0 1.7 ± 0.9 3.3 ± 1.0 Regional Vessel Definition 4.2 ± 1.1 2.7 ± 1.5 4.1 ± 1.3 Overall Average 4.0 ± 0.5 2.6 ± 0.5 3.8 ± 0.4 Signed rank test (P) <0.001*, vs. 4D-CT <0.001*, vs. CE 4D-CT 0.082, vs. CE 3D-CT 4D-CT CE 4D-CT P Volume (cm3) GTV50% 42.0 ± 35.1 22.8 ± 18.9 0.005* IGTV4 56.0 ± 38.1 32.8 ± 26.4 0.005* GTV Motion (mm) LR 2.3 ± 1.7 1.1 ± 0.5 0.14 AP 2.8 ± 1.6 2.6 ± 1.6 0.80 SI 6.0 ± 1.7 5.4 ± 1.6 0.39 3D 7.2 ± 2.0 6.2 ± 1.9 0.17 Table 1. Image Quality Scores Table 2. Quantitative Analysis Table 3. Tumor Volume and Motion Fig. 5. Inter-observer variation in contouring tumors Supported in part by Philips Healthcare, Inc. and NIH Grant No. R01CA172638 *Contact: Wei Lu, Ph.D., luw@mskcc.org We can determine optimal delay time Tdelay 4D-CT Acquisition Contrast Injection LO 4D-CTScanLength Organ Tpeak Tdelay = LO/V- Tpeak ContrastEnhancementCurve Time(s) Enhancement (HU) a c b d e Time when the organ is scanned over (Lo/V) Time when organ reaches peak enhancement Tpeak Synchronize Using a test injection enhancement curve {Xue et al., 2012. Med. Phy. 39: 3903-3903}. ROI in aorta {Bae 2010. Radiology 256: 32-61} Enhancement (HU) Time (Sec) 0 5 10 15 20 25 30 35 45 105 100 95 90 85 80 75 70 65 60 55 Typical transit time Injection duration Typical arrival time 𝑇𝑝𝑒𝑎𝑘 = TID + 15 s + Tarr − 20 s Tarr = 24.2 s Tpeak Pancreas Scores ranged from 1 to 5, with 1 being “very poor” and 5 being “excellent.”, and *Significant at 0.05. *Significant at 0.05. *Significant at 0.05. Fig.1. Regions adjacent to the tumor–pancreas boundary were selected to measure contrast. Fig. 4. Determine the delay time. Fig. 3. Estimate time to peak enhancement 78.0% 73.7% 66.0%66.5% 72.7% 55.6% 72.2% 72.5% 61.9% 0.0% 10.0% 20.0% 30.0% 40.0% 50.0% 60.0% 70.0% 80.0% 90.0% Sensitivity Specificity Jaccard CE 3D-CT 4D-CT CE 4D-CT