Downloaded 32 times
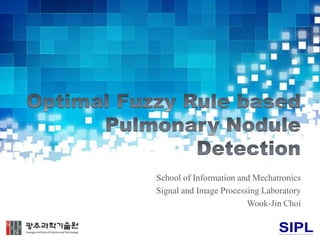
![CAD systems Lung segmentation Nodule Candidate Detection False Positive Reduction
Suzuki et al.(2003)[26] Thresholding Multiple thresholding MTANN
Rubin et al.(2005)[27] Thresholding Surface normal overlap
Lantern transform and rule-ba
sed classifier
Dehmeshki et al.(2007)[28] Adaptive thresholding Shape-based GATM Rule-based filtering
Suarez-Cuenca et al.(2009)[29]
Thresholding and 3-D connec
ted component labeling
3-D iris filtering
Multiple rule-based LDA classi
fier
Golosio et al.(2009)[30] Isosurface-triangulation Multiple thresholding Neural network
Ye et al.(2009)[31]
3-D adaptive fuzzy segmenta
tion
Shape based detection
Rule-based filtering and weig
hted SVM classifier
Sousa et al.(2010)[32] Region growing Structure extraction SVM classifier
Messay et al.(2010)[33]
Thresholding and 3-D connec
ted component labeling
Multiple thresholding and mo
rphological opening
Fisher linear discriminant and
quadratic classifier
Riccardi et al.(2011)[34] Iterative thresholding
3-D fast radial filtering and sc
ale space analysis
Zernike MIP classification bas
ed on SVM
Cascio et al.(2012)[35] Region growing Mass-spring model
Double-threshold cut and neu
ral network
9](https://image.slidesharecdn.com/optimalfuzzyrulebasedpulmonarynoduledetection-141002000225-phpapp02/85/Optimal-fuzzy-rule-based-pulmonary-nodule-detection-9-320.jpg)
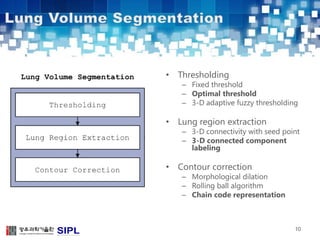
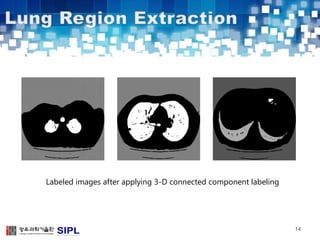
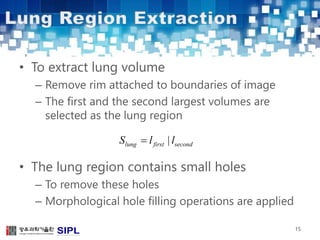
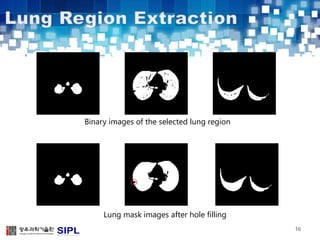
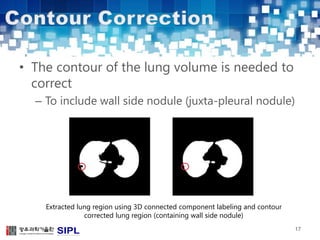
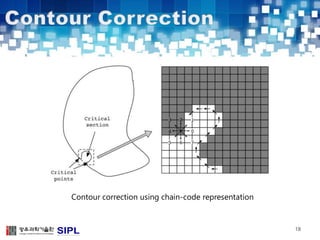
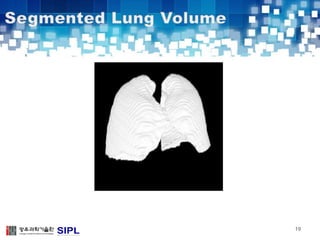
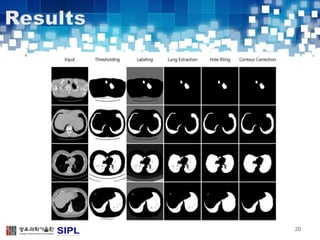
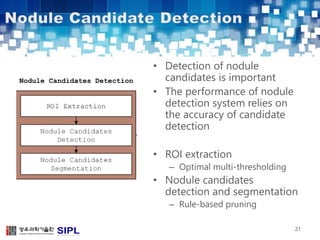
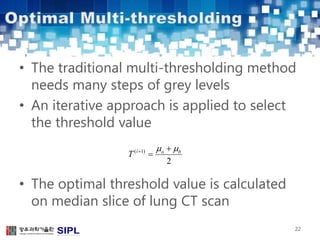
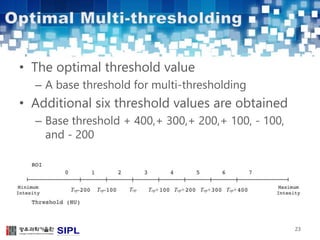
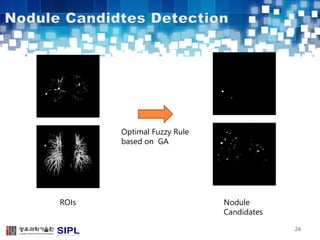
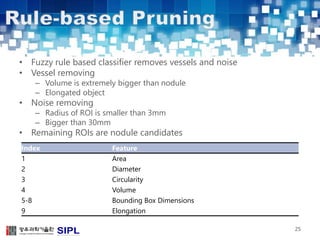
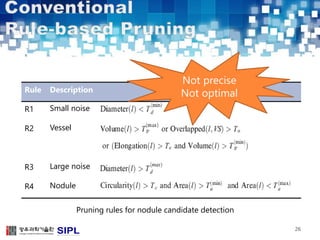
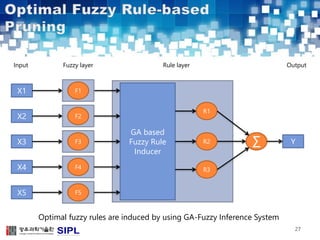
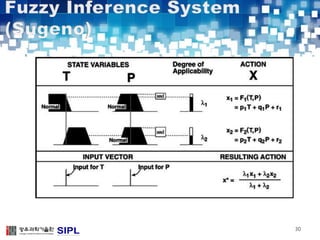
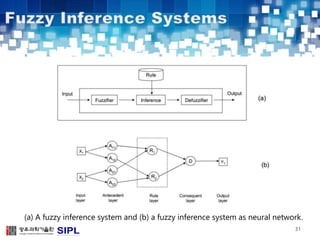
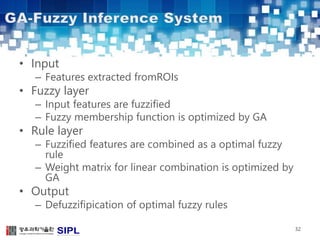
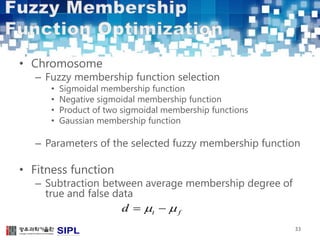
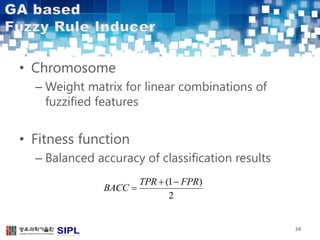
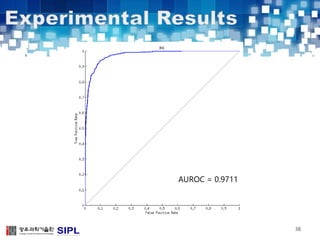
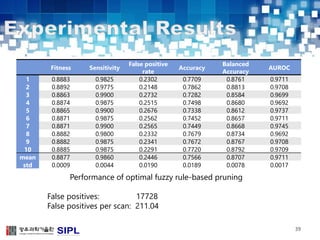


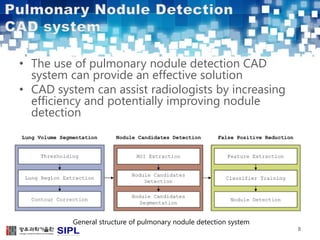
The document describes a lung cancer detection system that uses CT scans. It discusses (1) segmenting the lungs from CT images using adaptive thresholding and connected component analysis, (2) detecting nodule candidate regions using multi-thresholding and rule-based pruning, and (3) optimizing the rule-based pruning using a genetic algorithm trained fuzzy inference system to reduce false positives while maintaining high sensitivity. Experimental results on a publicly available lung image database show the optimized fuzzy system achieved better performance than a conventional rule-based approach.