폐 CT영상에서 VoxelClassification을
이용한 폐 결절 검출
광주과학기술원 기전공학부
신호 및 영상처리 연구실
최욱진 최태선
2.
목차
• 서론
• 관련연구
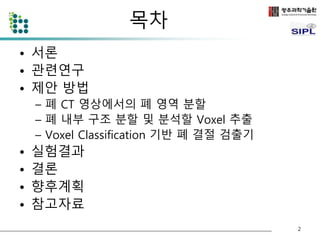
• 제안 방법
– 폐 CT 영상에서의 폐 영역 분할
– 폐 내부 구조 분할 및 분석할 Voxel 추출
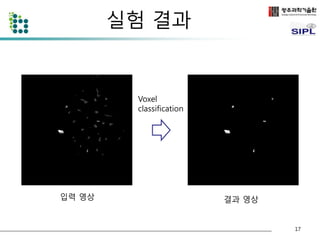
– Voxel Classification 기반 폐 결절 검출기
• 실험결과
• 결론
• 향후계획
• 참고자료
2
3.
서론
• 폐암은 치사율이 높지만 조기에 발견하여 치료할 경우 5년 생존율
이 50%까지 상승하는것으로 알려져 있다.
• 폐 암의 주요 소견인 폐 결절의 검출이 중요하다.
• 폐 결절의 조기검출을 위해 CT 영상을 사용하여 폐 결절을 검출 하
는 방법이 제안되었다.
• 폐 CT의 경우 환자당 100장 이상의 영상이 생성됨
– 분석하는데 많은 시간이 소요되며 피로 누적으로 인한 오류발생이 우려
된다.
• 폐 결절 검출을 자동화하기 위한 Computer-Aided Detection (CAD)
시스템의 연구가 활발하다.
Reference [1~4]
3
4.
관련 연구
•Template matching methods
– Genetic Algorithm Template Matching [5]
– 3D Template Matching [6]
• Model based methods
– Patient-specific models [7]
– Surface normal overlap model [8]
• Machine learning techniques
– Neural network [9]
– Genetic Programming [10]
• Digital filtering
– Quantized convergence index filter [11]
– Iris filter [12]
• Statistical analysis [13]
4
폐 CT 영상에서의폐 영역 분할
• 폐 영역을 분리하기 위해 폐 영상의 optimal threshold [4] 값 T를 구
한다.
• T값을 이용하여 폐 영역의 밝은 부분(몸통 부분 - 검은색)과 어두운
부분(폐 내부 및 외부 - 흰색)으로 이진화 한다.
6
원본 CT 영상과 T값을 이용하여 이진화된 영상
7.
폐 CT 영상에서의폐 영역 분할
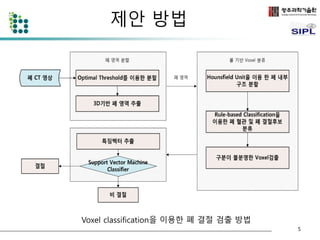
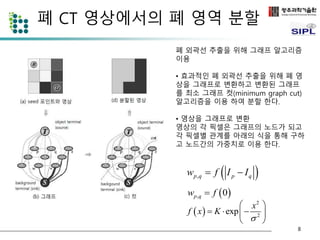
seed 포인트를 추출 한 것(흰색-
object, 검은색- background, 회색
-분할대상)
• Optimal threshold T를 이용하여 생성
한 이진영상에서 3D region growing
과 dilation 연산을 이용하여 폐 영역
추출
• 추출된 폐 영역에서 seed포인트를 추
출
– 추출된 폐 영역에서 T - 100 보다 작은 영역
은 명확하게 폐 영역 (object)
– 추출된 폐 영역에서 T + 100 보다 큰 영역은
영역은 배경 (background)
• 추출된 폐 영역에서 T – 100 보다 크고
T + 100 보다 작은영역은 그래프 컷을
이용하여 폐 영역과 배경으로 분할
7
8.
폐 CT 영상에서의폐 영역 분할
wp,q f 0
폐 외곽선 추출을 위해 그래프 알고리즘
이용
• 효과적인 폐 외곽선 추출을 위해 폐 영
상을 그래프로 변환하고 변환된 그래프
를 최소 그래프 컷(minimum graph cut)
알고리즘을 이용 하여 분할 한다.
• 영상을 그래프로 변환
영상의 각 픽셀은 그래프의 노드가 되고
각 픽셀별 관계를 아래의 식을 통해 구하
고 노드간의 가중치로 이용 한다.
p,q p q w f I I
2
x
2 exp
f x K
, 0 p q w f
8
9.
폐 CT 영상에서의폐 영역 분할
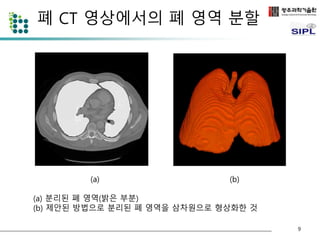
(a) (b)
(a) 분리된 폐 영역(밝은 부분)
(b) 제안된 방법으로 분리된 폐 영역을 삼차원으로 형상화한 것
9
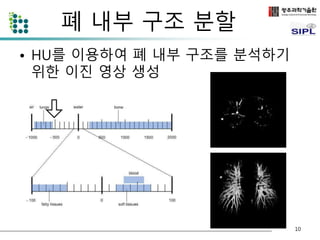
폐 내부 구조분할
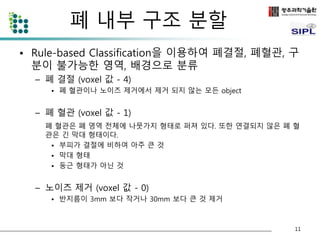
• Rule-based Classification을 이용하여 폐결절, 폐혈관, 구
분이 불가능한 영역, 배경으로 분류
– 폐 결절 (voxel 값 - 4)
• 폐 혈관이나 노이즈 제거에서 제거 되지 않는 모든 object
– 폐 혈관 (voxel 값 - 1)
폐 혈관은 폐 영역 전체에 나뭇가지 형태로 퍼져 있다. 또한 연결되지 않은 폐 혈
관은 긴 막대 형태이다.
• 부피가 결절에 비하여 아주 큰 것
• 막대 형태
• 둥근 형태가 아닌 것
– 노이즈 제거 (voxel 값 - 0)
• 반지름이 3mm 보다 작거나 30mm 보다 큰 것 제거
11
12.
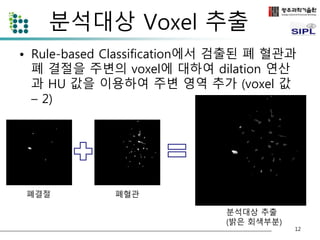
분석대상 Voxel 추출
• Rule-based Classification에서 검출된 폐 혈관과
폐 결절을 주변의 voxel에 대하여 dilation 연산
과 HU 값을 이용하여 주변 영역 추가 (voxel 값
– 2)
12
폐결절 폐혈관
분석대상 추출
(밝은 회색부분)
13.
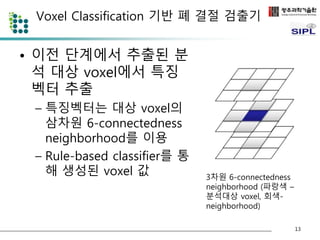
Voxel Classification 기반폐 결절 검출기
• 이전 단계에서 추출된 분
석 대상 voxel에서 특징
벡터 추출
– 특징벡터는 대상 voxel의
삼차원 6-connectedness
neighborhood를 이용
– Rule-based classifier를 통
해 생성된 voxel 값
13
3차원 6-connectedness
neighborhood (파랑색 –
분석대상 voxel, 회색-
neighborhood)
14.
Voxel Classification 기반폐 결절 검출기
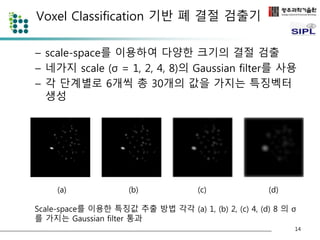
– scale-space를 이용하여 다양한 크기의 결절 검출
– 네가지 scale (σ = 1, 2, 4, 8)의 Gaussian filter를 사용
– 각 단계별로 6개씩 총 30개의 값을 가지는 특징벡터
생성
14
(a) (b) (c) (d)
Scale-space를 이용한 특징값 추출 방법 각각 (a) 1, (b) 2, (c) 4, (d) 8 의 σ
를 가지는 Gaussian filter 통과
15.
Voxel Classification 기반폐 결절 검출기
• 추출된 특징벡터를 support vector
machine (SVM) classifier를 이용하여 폐결
절 voxel과 비결절 voxel로 분류
– 폐결절 과 비결절(배경, 폐혈관, 기타) 두 가지
class로 분류
– Kernel function: radial basis fucntion, σ =
0.1, 0.125, 0.15, 0.175
– 7-fold cross-validation을 이용하여 검출기 성
능 검증
15
16.
실험결과
• LungImage Database Consortium (LIDC) 데이터베이스
[14]
– 제안된 알고리즘의 검증과 평가를 위하여 LIDC 데이터베이스를
사용하였다.
– LIDC는 미국 NIH에서 CT를 이용한 폐 결절 검출 CAD 시스템의
발전을 촉진하기 위하여 개발된 공개 폐 결절 데이터베이스이다.
– 본 데이터베이스는 총 84개의 CT scan으로 구성되어 있으며 각
각의 CT scan은 100-400개의 Digital Imaging and
Communication (DICOM) 영상과 전문의들의 폐 결절 검출 의견
이 저장되어 있는 XML파일로 이루어져 있다.
• 본 논문에서는 76개의 결절이 포함된 10개의 영상을 사
용하였다. 사용된 영상은 총 2509개의 영상으로 구성되
어 있으며 영상의 pixel 크기는 0.65 ~ 0.75 mm 이다.
16
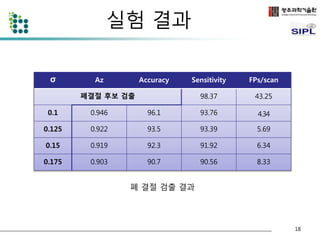
실험 결과
σAz Accuracy Sensitivity FPs/scan
폐결절 후보 검출 98.37 43.25
0.1 0.946 96.1 93.76 4.34
0.125 0.922 93.5 93.39 5.69
0.15 0.919 92.3 91.92 6.34
0.175 0.903 90.7 90.56 8.33
폐 결절 검출 결과
18
19.
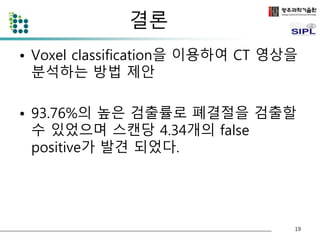
결론
• Voxelclassification을 이용하여 CT 영상을
분석하는 방법 제안
• 93.76%의 높은 검출률로 폐결절을 검출할
수 있었으며 스캔당 4.34개의 false
positive가 발견 되었다.
19
20.
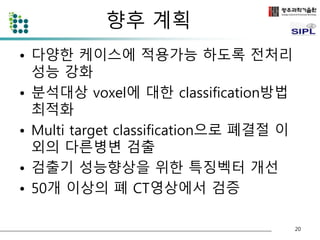
향후 계획
•다양한 케이스에 적용가능 하도록 전처리
성능 강화
• 분석대상 voxel에 대한 classification방법
최적화
• Multi target classification으로 폐결절 이
외의 다른병변 검출
• 검출기 성능향상을 위한 특징벡터 개선
• 50개 이상의 폐 CT영상에서 검증
20
21.
참고자료
• [1]Ahmedin Jemal, Rebecca Siegel, ElizabethWard, Yongping Hao, Jiaquan Xu, and Michael J
Thun, “Cancerstatistics, 2009,” CA Cancer J Clin, vol. 59, no. 4, pp. 225–49, Jan 2009.
• [2] K-W Jung, Y-J Won, S Park, H-J Kong, J Sung, H-R Shin, E-Cl Park, and J S Lee, “Cancer
statistics in korea: incidence, mortality and survival in 2005,” J Korean Med Sci, vol. 24, no. 6,
pp. 995–1003, Dec 2009.
• [3] Qiang Li, “Recent progress in computer-aided diagnosis of lung nodules on thin-section
ct.,” Comput Med Imaging Graph, vol. 31, no. 4-5, pp. 248–257, 2007.
• [4] S G Armato, M L Giger, C J Moran, J T Blackburn, K Doi, and H MacMahon, “Computerized
detection of pulmonary nodules on ct scans,” Radiographics, vol. 19, no. 5, pp. 1303–11, Jan
1999.
• [5] Jamshid Dehmeshki, Xujiong Ye, Xinyu Lin, Manlio Valdivieso, and Hamdan Amin,
“Automated detection of lung nodules in ct images using shape-based genetic algorithm.,”
Comput Med Imaging Graph, vol. 31, no. 6, pp. 408–417, Sep 2007.
• [6] Onur Osman, Serhat Ozekes, and Osman N Ucan, “Lung nodule diagnosis using 3d
template matching.,” Comput Biol Med, vol. 37, no. 8, pp. 1167–1172, Aug 2007.
• [7] M Brown, M McNitt-Gray, J Goldin, R Suh, J Sayre, and D Aberle, “Patient-specific models
for lung nodule detection and surveillance in ct images,” IEEE TMI, vol. 20, no. 12, pp. 1242 –
1250, Dec 2001.
• [8] D Paik, C Beaulieu, G Rubin, B Acar, R Jeffrey, J Yee, J Dey, and S Napel, “Surface normal
overlap: a computer-aided detection algorithm with application to colonic polyps and lung
nodules in helical ct,” IEEE TMI, vol. 23, no. 6, pp. 661 – 675, Jun 2004.
21
22.
참고자료
• [9]K Suzuki, SG Armato III, F Li, S Sone, and K Doi, “Massive training artificial neural network
(mtann) for reduction of false positives in computerized detection of lung nodules in low-dose
computed tomography,” Medical physics, vol. 30, pp. 1602, 2003.
• [10] Wook-Jin. Choi, Tae-Sun. Choi, “Genetic Programming-based Feature Transform and
Classification for the Automatic Detection of Pulmonary Nodules on Computed Tomography
Images”, Information Sciences(2012), doi: http://dx.doi.org/10.1016/j.ins.2012.05.008
• [11] Sumiaki Matsumoto, Harold L Kundel, James C Gee, Warren B Gefter, and Hiroto Hatabu,
“Pulmonary nodule detection in ct images with quantized convergence index filter.,” Med
Image Anal, vol. 10, no. 3, pp. 343–352, Jun 2006.
• [12] JJ Su´arez-Cuenca, PG Tahoces, M Souto, MJ Lado, M Remy-Jardin, J Remy, and J Jos´e
Vidal, “Application of the iris filter for automatic detection of pulmonary nodules on
computed tomography images,” Computers in Biology and Medicine, 2009.
• [13] A El-Baz, G Gimel’farb, R Falk, and M Abo El-Ghar, “Automatic analysis of 3d low dose ct
images for early diagnosis of lung cancer,” Pattern Recognition, vol. 42, no. 6, pp. 1041–1051,
Jan 2009.
• [14] Yuri Boykov and Gareth Funka-Lea, “Graph Cuts and Efficient N-D Image Segmentation”,
International Journal of Computer Vision, vol. 70, no. 2, pp. 109-131, November 2006.
• [15] S G Armato, G McLennan, M F McNitt-Gray, C R Meyer, D Yankelevitz, D R Aberle, C I
Henschke, E A Hoffman, E A Kazerooni, H MacMahon, A P Reeves, B Y Croft, L P Clarke, and
Lung Image Database Consortium Research Group, “Lung image database consortium:
developing a resource for the medical imaging research community.,” Radiology, vol. 232, no.
3, pp. 739–748, Sep 2004.
22
#5 GATM based algorithm performed quite good results.
Lee et al.[2] proposed a template-matching technique based on GATM for detecting nodules existing within the lung area. Seventy-one nodules out of 98 were correctly etected
with the number of FPs at approximately 1.1 per sectional image.
#7 First of all, the lung region extraction should be performed before any other part of nodule detection.
To extract lung region, we propose a segmentation method based on adaptive thresholding and voxel labelling.
Because lung region is dark, we convert the image to a binary with less than the selected threshold as foreground.
#12 In this part, We can remove the vessels and noise in the lung volume using rule based classifier.
We extracted 3D geometric features from every ROI.
The features are volume, elongation factor, compactness and approximated radius.
The vessel is classified by volume elongation factor and compactness.
The vessel is connected every slice so its volume is extremely bigger than nodule.
Moreover, it is longer than nodule and not compact object.
The noise is removed if radius of ROI is smaller than 3mm or bigger than 30mm.
Fig. 3b shows a detected nodule candidates.
![서론
• 폐 암은 치사율이 높지만 조기에 발견하여 치료할 경우 5년 생존율
이 50%까지 상승하는것으로 알려져 있다.
• 폐 암의 주요 소견인 폐 결절의 검출이 중요하다.
• 폐 결절의 조기검출을 위해 CT 영상을 사용하여 폐 결절을 검출 하
는 방법이 제안되었다.
• 폐 CT의 경우 환자당 100장 이상의 영상이 생성됨
– 분석하는데 많은 시간이 소요되며 피로 누적으로 인한 오류발생이 우려
된다.
• 폐 결절 검출을 자동화하기 위한 Computer-Aided Detection (CAD)
시스템의 연구가 활발하다.
Reference [1~4]
3](https://image.slidesharecdn.com/ctvoxelclassification-141002000957-phpapp01/85/CT-voxel-classification-3-320.jpg)
![관련 연구
• Template matching methods
– Genetic Algorithm Template Matching [5]
– 3D Template Matching [6]
• Model based methods
– Patient-specific models [7]
– Surface normal overlap model [8]
• Machine learning techniques
– Neural network [9]
– Genetic Programming [10]
• Digital filtering
– Quantized convergence index filter [11]
– Iris filter [12]
• Statistical analysis [13]
4](https://image.slidesharecdn.com/ctvoxelclassification-141002000957-phpapp01/85/CT-voxel-classification-4-320.jpg)
![폐 CT 영상에서의 폐 영역 분할
• 폐 영역을 분리하기 위해 폐 영상의 optimal threshold [4] 값 T를 구
한다.
• T값을 이용하여 폐 영역의 밝은 부분(몸통 부분 - 검은색)과 어두운
부분(폐 내부 및 외부 - 흰색)으로 이진화 한다.
6
원본 CT 영상과 T값을 이용하여 이진화된 영상](https://image.slidesharecdn.com/ctvoxelclassification-141002000957-phpapp01/85/CT-voxel-classification-6-320.jpg)
![실험결과
• Lung Image Database Consortium (LIDC) 데이터베이스
[14]
– 제안된 알고리즘의 검증과 평가를 위하여 LIDC 데이터베이스를
사용하였다.
– LIDC는 미국 NIH에서 CT를 이용한 폐 결절 검출 CAD 시스템의
발전을 촉진하기 위하여 개발된 공개 폐 결절 데이터베이스이다.
– 본 데이터베이스는 총 84개의 CT scan으로 구성되어 있으며 각
각의 CT scan은 100-400개의 Digital Imaging and
Communication (DICOM) 영상과 전문의들의 폐 결절 검출 의견
이 저장되어 있는 XML파일로 이루어져 있다.
• 본 논문에서는 76개의 결절이 포함된 10개의 영상을 사
용하였다. 사용된 영상은 총 2509개의 영상으로 구성되
어 있으며 영상의 pixel 크기는 0.65 ~ 0.75 mm 이다.
16](https://image.slidesharecdn.com/ctvoxelclassification-141002000957-phpapp01/85/CT-voxel-classification-16-320.jpg)
![참고자료
• [1] Ahmedin Jemal, Rebecca Siegel, ElizabethWard, Yongping Hao, Jiaquan Xu, and Michael J
Thun, “Cancerstatistics, 2009,” CA Cancer J Clin, vol. 59, no. 4, pp. 225–49, Jan 2009.
• [2] K-W Jung, Y-J Won, S Park, H-J Kong, J Sung, H-R Shin, E-Cl Park, and J S Lee, “Cancer
statistics in korea: incidence, mortality and survival in 2005,” J Korean Med Sci, vol. 24, no. 6,
pp. 995–1003, Dec 2009.
• [3] Qiang Li, “Recent progress in computer-aided diagnosis of lung nodules on thin-section
ct.,” Comput Med Imaging Graph, vol. 31, no. 4-5, pp. 248–257, 2007.
• [4] S G Armato, M L Giger, C J Moran, J T Blackburn, K Doi, and H MacMahon, “Computerized
detection of pulmonary nodules on ct scans,” Radiographics, vol. 19, no. 5, pp. 1303–11, Jan
1999.
• [5] Jamshid Dehmeshki, Xujiong Ye, Xinyu Lin, Manlio Valdivieso, and Hamdan Amin,
“Automated detection of lung nodules in ct images using shape-based genetic algorithm.,”
Comput Med Imaging Graph, vol. 31, no. 6, pp. 408–417, Sep 2007.
• [6] Onur Osman, Serhat Ozekes, and Osman N Ucan, “Lung nodule diagnosis using 3d
template matching.,” Comput Biol Med, vol. 37, no. 8, pp. 1167–1172, Aug 2007.
• [7] M Brown, M McNitt-Gray, J Goldin, R Suh, J Sayre, and D Aberle, “Patient-specific models
for lung nodule detection and surveillance in ct images,” IEEE TMI, vol. 20, no. 12, pp. 1242 –
1250, Dec 2001.
• [8] D Paik, C Beaulieu, G Rubin, B Acar, R Jeffrey, J Yee, J Dey, and S Napel, “Surface normal
overlap: a computer-aided detection algorithm with application to colonic polyps and lung
nodules in helical ct,” IEEE TMI, vol. 23, no. 6, pp. 661 – 675, Jun 2004.
21](https://image.slidesharecdn.com/ctvoxelclassification-141002000957-phpapp01/85/CT-voxel-classification-21-320.jpg)
![참고자료
• [9] K Suzuki, SG Armato III, F Li, S Sone, and K Doi, “Massive training artificial neural network
(mtann) for reduction of false positives in computerized detection of lung nodules in low-dose
computed tomography,” Medical physics, vol. 30, pp. 1602, 2003.
• [10] Wook-Jin. Choi, Tae-Sun. Choi, “Genetic Programming-based Feature Transform and
Classification for the Automatic Detection of Pulmonary Nodules on Computed Tomography
Images”, Information Sciences(2012), doi: http://dx.doi.org/10.1016/j.ins.2012.05.008
• [11] Sumiaki Matsumoto, Harold L Kundel, James C Gee, Warren B Gefter, and Hiroto Hatabu,
“Pulmonary nodule detection in ct images with quantized convergence index filter.,” Med
Image Anal, vol. 10, no. 3, pp. 343–352, Jun 2006.
• [12] JJ Su´arez-Cuenca, PG Tahoces, M Souto, MJ Lado, M Remy-Jardin, J Remy, and J Jos´e
Vidal, “Application of the iris filter for automatic detection of pulmonary nodules on
computed tomography images,” Computers in Biology and Medicine, 2009.
• [13] A El-Baz, G Gimel’farb, R Falk, and M Abo El-Ghar, “Automatic analysis of 3d low dose ct
images for early diagnosis of lung cancer,” Pattern Recognition, vol. 42, no. 6, pp. 1041–1051,
Jan 2009.
• [14] Yuri Boykov and Gareth Funka-Lea, “Graph Cuts and Efficient N-D Image Segmentation”,
International Journal of Computer Vision, vol. 70, no. 2, pp. 109-131, November 2006.
• [15] S G Armato, G McLennan, M F McNitt-Gray, C R Meyer, D Yankelevitz, D R Aberle, C I
Henschke, E A Hoffman, E A Kazerooni, H MacMahon, A P Reeves, B Y Croft, L P Clarke, and
Lung Image Database Consortium Research Group, “Lung image database consortium:
developing a resource for the medical imaging research community.,” Radiology, vol. 232, no.
3, pp. 739–748, Sep 2004.
22](https://image.slidesharecdn.com/ctvoxelclassification-141002000957-phpapp01/85/CT-voxel-classification-22-320.jpg)


![[213] 의료 ai를 위해 세상에 없는 양질의 data 만드는 도구 제작하기](https://cdn.slidesharecdn.com/ss_thumbnails/213aidata-171016104902-thumbnail.jpg?width=640&height=640&fit=bounds)

![[2023] Cut and Learn for Unsupervised Object Detection and Instance Segmentation](https://cdn.slidesharecdn.com/ss_thumbnails/cutler2-230408040939-266c2db0-thumbnail.jpg?width=640&height=640&fit=bounds)


