Download as PDF, PPTX


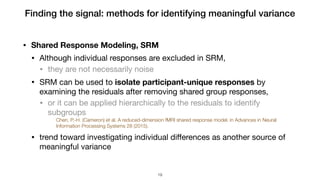
![Box 1. Shared response model (SRM)
• simplest use of SRM
• extracting a shared response across an anatomical ROI
• [note: FreeSurfer]
• ex)
• which short segment of a movie is being watched can be classified with many times greater accuracy from fMRI data after
functional versus anatomical alignment
Chen, P.-H. (Cameron) et al. A reduced-dimension fMRI shared response model. in Advances in Neural Information Processing Systems 28 (2015).
Guntupalli, J.S. et al. A model of representational spaces in human cortex. Cereb. Cortex 26, 2919–2934 (2016).
• text annotations of movie segments based on fMRI are consistently better, across ROIs and analysis parameters, after SRM
Vodrahalli, K. et al. Mapping between natural movie fMRI responses and word-sequence representations. (2016).
• Applying SRM to a large swath of the brain means that all voxels within the region contribute to the final derived metric
• conflict with the goal of associating spatially local activity with specific cognitive functions
• SRM can be applied in small overlapping searchlights
• SRM is computed using a subset of the available fMRI data, with the number of features, k, determined using cross-validation.
• SRM highlights the sources of variance elicited by the stimuli or trials that are shared across participants in the training data
• Test data are then projected into the shared response space
• test data could be of the same type as the training data,
for example, allowing for decoding of new movie segments
• SRM replacing standard alignment in the preprocessing pipeline
• One limitation when using SRM for preprocessing is
that additional data must be collected for training,
reducing the amount of data
!18](https://image.slidesharecdn.com/computationalapproachestofmrianalysis-190131015539/85/Computational-approaches-to-fMRI-analysis-18-320.jpg)

This document discusses computational approaches to analyzing functional magnetic resonance imaging (fMRI) data. It provides an overview of advanced fMRI analysis techniques including multivariate pattern analysis, model-based analysis, real-time analysis, and approaches for scaling up analyses to large datasets. Specific methods covered include shared response modeling to identify shared variance across participants, topographic factor analysis to impose spatial structure on brain patterns, and functional connectivity analysis. The document notes challenges in analyzing the high-dimensional fMRI data and emphasizes the importance of constraining models and finding meaningful sources of variance.


![제 23회 보아즈(BOAZ) 빅데이터 컨퍼런스 - [MBOAX] : ABSA를 활용한 소비자 반응 분석 기반 운영 효율화 대시보드 설계](https://cdn.slidesharecdn.com/ss_thumbnails/3-1boaz23rdconferencemboax-260203102709-9d519923-thumbnail.jpg?width=640&height=640&fit=bounds)