Download to read offline

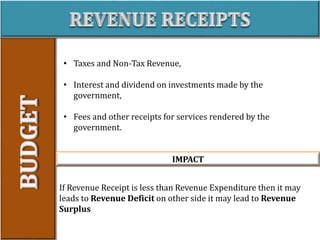
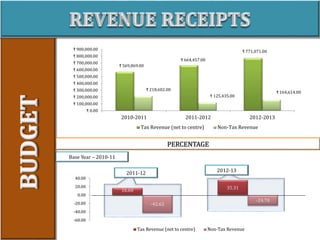
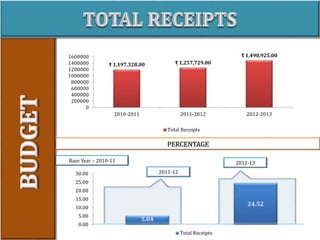
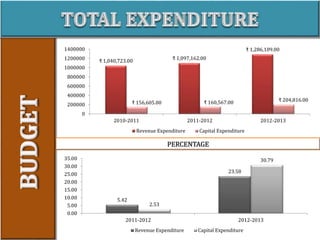
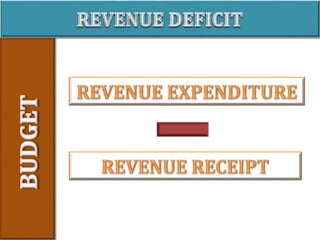
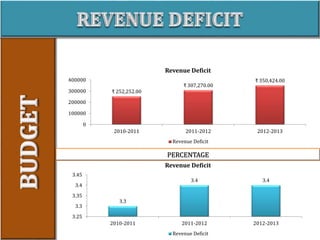
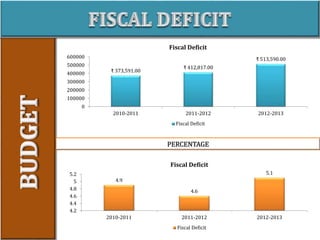
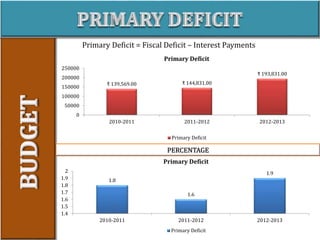


This document analyzes government revenue and expenditure figures from 2010-2011 to 2012-2013. It shows that total revenue receipts increased from 2010-2011 to 2012-2013 but revenue expenditure also increased, leading to a higher revenue deficit. The fiscal deficit and primary deficit also increased over this period.