
Recommended
Recommended
More Related Content
What's hot
What's hot (20)
Similar to India Fiscal Deficit Overview Quarter One Report
Similar to India Fiscal Deficit Overview Quarter One Report (20)
Recently uploaded
Recently uploaded (20)
India Fiscal Deficit Overview Quarter One Report
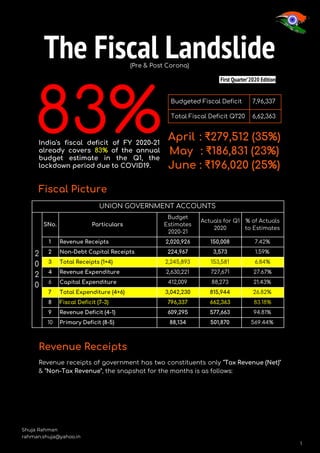
- 1. 1 The Fiscal Landslide (Pre & Post Corona) First Quarter’2020 Edition India's fiscal deficit of FY 2020-21 already covers 83% of the annual budget estimate in the Q1, the lockdown period due to COVID19. Budgeted Fiscal Deficit 7,96,337 Total Fiscal Deficit Q1’20 6,62,363 April : ₹279,512 (35%) May : ₹186,831 (23%) June : ₹196,020 (25%) Fiscal Picture UNION GOVERNMENT ACCOUNTS 2 0 2 0 SNo. Particulars Budget Estimates 2020-21 Actuals for Q1 2020 % of Actuals to Estimates 1 Revenue Receipts 2,020,926 150,008 7.42% 2 Non-Debt Capital Receipts 224,967 3,573 1.59% 3 Total Receipts (1+4) 2,245,893 153,581 6.84% 4 Revenue Expenditure 2,630,221 727,671 27.67% 6 Capital Expenditure 412,009 88,273 21.43% 7 Total Expenditure (4+6) 3,042,230 815,944 26.82% 8 Fiscal Deficit (7-3) 796,337 662,363 83.18% 9 Revenue Deficit (4-1) 609,295 577,663 94.81% 10 Primary Deficit (8-5) 88,134 501,870 569.44% Revenue Receipts Revenue receipts of government has two constituents only “Tax Revenue (Net)” & “Non-Tax Revenue”, the snapshot for the months is as follows: Shuja Rahman rahman.shuja@yahoo.in 1
- 2. 2 1. April’20: The current standing revenue for the month fell by 249% Y-o-Y basis of the whole, the constituents tax (net) & non-tax revenue individually registered a fall of INR 50,225cr & INR 17,522cr. 2. May’20: The current standing revenue for the month fell by 179% Y-o-Y basis of the whole, the constituents tax (net) & non-tax revenue individually registered a fall of INR 31,265cr & INR 84cr. 3. June’20: The rebound stage of revenue as it increases as compared to the previous months but still a fall of 34% Y-o-Y basis is witnessed for the month. The respective fall for the tax (net) & non-tax is of INR 35,099cr & INR 683cr. These are the major sources from which the government acquires its necessary funds to spend on multiple projects or on daily capital requirement The chart below reflects the yearly growth/fall in government revenue as discussed above since 2016 to present a comparable volume. SNo. Particulars April 2020 May 2020 June 2020 Total 1 Revenue Receipts 27,183 17,484 105,341 150,008 2 Tax Revenue (Net) 21,412 12,438 100,972 134,822 3 Non-Tax Revenue 5,771 5,046 4,369 15,186 Shuja Rahman rahman.shuja@yahoo.in 2
- 3. 3 Total Receipts “Total Receipts” of government has two constituents as well, but they comprise of first the above discussed topic “Revenue Receipts” & second “Non-Debt Capital Receipts”, these are capital raised by divestments or sale of shares held by government, the snapshot for the months is as follows: 1. April’20: The current standing total revenue for the month fell by 254% Y-o-Y basis of the whole, the constituents revenue receipts & non-debt capital receipts individually registered a fall of INR 67,747cr & INR 2,336cr. (Chart A) 2. May’20: The current standing total revenue for the month fell by 174% Y-o-Y basis of the whole, the constituents revenue receipts & non-debt capital receipts individually registered a fall & increase of INR 31,349cr & INR 100cr. (Chart B) 3. June’20: The standing total revenue falls the lowest, as we witness a trend of fally on Y-o-Y to decrease as compared to the previous two months, but still a fall is registered of 32% amounting to INR 34,737cr. Bifurcation of the total fall consists of fall in revenue receipts of INR 35,782 & non-debt capital an increase of INR 1,045cr. (Chart C) Chart A Chart B Chart C Shuja Rahman rahman.shuja@yahoo.in 3
- 4. 4 Total Expenditure V/s Total Receipts A snapshot of expenditure done in exchange of receipts earned for the months of April-June’20. This would give a clear picture of the fiscal deficit throughout the years, and growth/fall of the expenditure with the receipts for the respective year keeping the year 2020 results in a focal point of comparison. April A P R I L SNo. Particulars 2015 2016 2017 2018 2019 2020 1 Revenue Receipts 25,313 22,075 35,081 70,657 94,930 27,183 2 Non-Debt Capital Receipts 1,781 2,584 1,448 793 2,701 365 3 Total Receipts (1+2) 27,094 24,659 36,529 71,450 97,631 27,548 Growth % -9.87% 32.49% 48.87% 26.82% -254.40% 4 Revenue Expenditure 128,408 141,150 213,464 176,714 224,091 278,754 6 Capital Expenditure 26,209 20,835 28,687 46,703 30,588 28,306 7 Total Expenditure (4+6) 154,617 161,985 242,151 223,417 254,679 307,060 Growth % 4.55% 33.11% -8.39% 12.28% 17.06% 8 Fiscal Deficit (7-3) 127,523 137,326 205,622 151,967 157,048 279,512 9 Revenue Deficit (4-1) 103,095 119,075 178,383 106,057 129,161 251,571 10 Primary Deficit (8-5) 110,529 121,470 186,200 136,349 137,491 252,816 The above graph reflects the variation over the years in form of receipts & expenditure, it’s quite notable that in April’20 (Covid lockdown phase) the expenditure has risen by 17% Y-o-Y basis, whereas the receipt on the other hand have faced a steep fall by 254% Y-o-Y , this reflects the herculean burden on government to fulfill a country’s demand of adequate money to burn to keep the wheel running. The fiscal deficit for the said period is INR 2,79,512 cr, which covers up 35% of the total budget fiscal deficit estimate for the year. Shuja Rahman rahman.shuja@yahoo.in 4
- 5. 5 May M A Y SNo. Particulars 2015 2016 2017 2018 2019 2020 1 Revenue Receipts 27,048 43,616 47,931 55,800 48,833 17,484 2 Non-Debt Capital Receipts 65 785 1,205 211 366 466 3 Total Receipts (1+2) 27,113 44,401 49,136 56,011 49,199 17,950 Growth % 38.94% 9.64% 12.27% -13.85% -174.09% 4 Revenue Expenditure 96,680 123,665 193,026 232,449 241,193 177,881 6 Capital Expenditure 11,534 12,396 23,849 17,088 17,115 26,900 7 Total Expenditure (4+6) 108,214 136,061 216,875 249,537 258,308 204,781 Growth % 20.47% 37.26% 13.09% 3.40% -26.14% 8 Fiscal Deficit (7-3) 81,101 91,660 167,739 193,526 209,109 186,831 9 Revenue Deficit (4-1) 69,632 80,049 145,095 176,649 192,360 160,397 10 Primary Deficit (8-5) 49,648 52,802 118,147 135,538 153,862 135,262 In case of May’20 (Covid lockdown phase) the expenditure has fallen by 26% Y-o-Y basis, whereas the receipt on the other hand has still faced a steep fall by 174% Y-o-Y. Comparing the data of May’20 from April’20 itself, it’s clearly visible that the expenditure of the government has subsequently fallen for the month of May’20. The receipt on the other hand shows a lesser decreased percent of 174% (May) as compared to 254% (April), but in figures the picture is different as the income in April is INR 27,548 cr whereas in May it is INR 17,950 cr, there’s a subsequent fall in receipt as well on month basis . The fiscal deficit for the said period is INR 1,86,831 cr, which covers up 23% of the total budget fiscal deficit estimate for the year. Shuja Rahman rahman.shuja@yahoo.in 5
- 6. 6 June J U N E SNo. Particulars 2015 2016 2017 2018 2019 2020 1 Revenue Receipts 88,843 115,096 116,290 141,314 141,123 105,341 2 Non-Debt Capital Receipts 1,248 1,353 7,091 9,839 1,697 2,742 3 Total Receipts (1+2) 90,091 116,449 123,381 151,153 142,820 108,083 Growth % 22.63% 5.62% 18.37% -5.83% -32.14% 4 Revenue Expenditure 147,296 198,021 175,913 211,496 193,421 271,036 6 Capital Expenditure 20,866 15,765 15,792 23,197 15,297 33,067 7 Total Expenditure (4+6) 168,162 213,786 191,705 234,693 208,718 304,103 Growth % 21.34% -11.52% 18.32% -12.45% 31.37% 8 Fiscal Deficit (7-3) 78,071 97,337 68,324 83,540 65,898 196,020 9 Revenue Deficit (4-1) 58,453 82,925 59,623 70,182 52,298 165,695 10 Primary Deficit (8-5) 31,025 43,249 3,928 12,231 -1,053 113,792 June turned out to be the rebound month of the receipts in form of taxes and other sources of income of the union accounts, as the receipt income reflects registered a fall of 35% Y-o-Y basis only. Compared to 254% & 174%, it is actually a recovery parallel running along the upliftment of covid lockdown, as the upliftment caused the economy to run back its normal course of activities and get itself to be comfortable with the virus and working along with it. The risk attached to this receipt gain is extremely high as India is the third highly COVID infected country as per the current count. The cumulative cover-up of fiscal deficit compared to the budget estimates of 2020-21 as covered in the first section stands with these three months actual data stands at 83%. Shuja Rahman rahman.shuja@yahoo.in 6
- 7. 7 What if? The big question what if we never had a COVID situation, this is an estimate of how the accounts should have been as compared to the actual results till June’20: 2 0 2 0 SNo. Particulars What should have happened if no COVID situation existed* Actuals for Q1 2020 1 Revenue Receipts 505,232 150,008 2 Non-Debt Capital Receipts 56,242 3,573 3 Total Receipts (1+2) 561,473 153,581 4 Revenue Expenditure 657,555 727,671 5 Capital Expenditure 103,002 88,273 6 Total Expenditure (4+5) 760,558 815,944 7 Fiscal Deficit (6-3) 199,084 662,363 8 Revenue Deficit (4-1) 152,324 577,663 9 Primary Deficit (7-5) 22,034 501,870 The imagination runs wild to a picture where the budgeted fiscal deficit would have been only INR 199,084cr for the Q1 FY 2020-21, but the reality is different, with the surpassing mark of 17 lakhs COVID infected. The dynamics of accounts and growth prospects has completely changed axis causing a call for revision of the annual estimate in the possible next upcoming months! (*This is a hypothetical situation basis calculation based on the union yearly budget simply divided by four to get an estimated figure of a quarter.) Shuja Rahman rahman.shuja@yahoo.in 7
- 8. 8 Conclusion I. Fiscal Deficit Situation As per the current speed of exhausting up the limit of fiscal deficit (83%) it’s clear that it’s an alarming situation, if this speed continues then new provisions would be required to re-write the budget estimates to cover-up the yearly fiscal deficit. II. Indirect Tax Influence Exposed This whole COVID situation has exposed the effect & value of indirect tax in Indian economy. The whole situation occurred in the start of the financial year 2020-21, as the tax collections for the examined period fell at multiple levels reflecting the control of government on the entities, as well as the sectors India is majorly dealing in and how much they would contribute in case of physical movement boundations. As this period is not relatively relevant to collection of Direct Tax, hence only indirect tax has been considered. III. What’s next: “Unlock India” with a rebound on receipts? Well, keeping the “Unlock of the economy” in consideration, it would not be wrong to claim change in the receipt level, but subsequently receipts will attract expenditure as well because of the demand of the resources by the masses. Hence, we may see a spike in receipt but it would be higher in the expenditure section on comparison. Data Source: http://cga.nic.in For more detailed tables visit this article google sheet: shorturl.at/twyIS In case of any suggestion or remark do mail me, it’s mentioned below. Thanks! Shuja Rahman rahman.shuja@yahoo.in 8