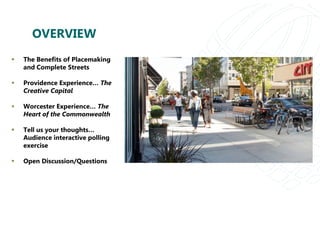
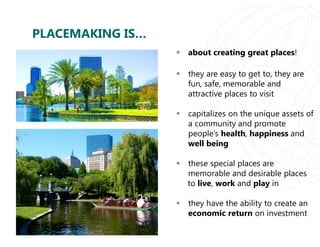
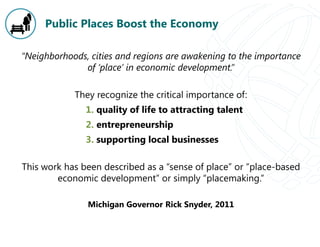
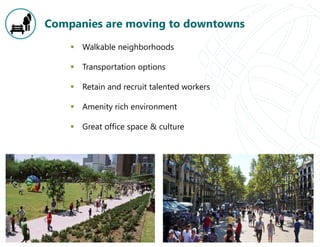
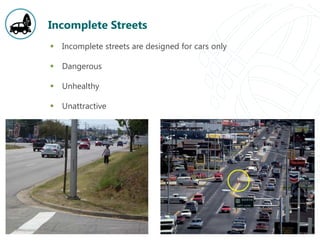
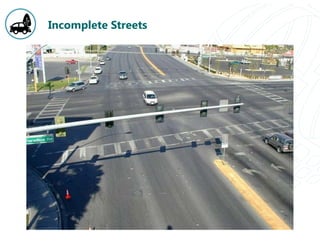
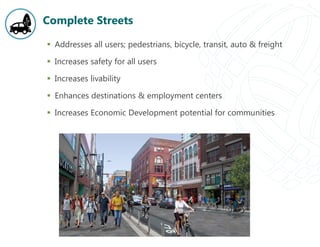
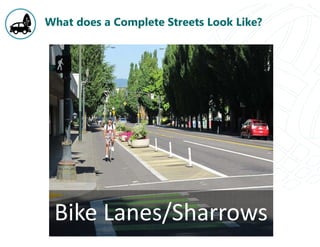
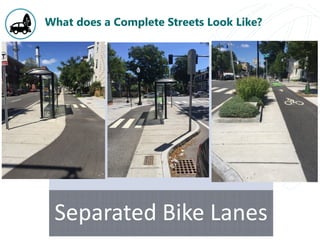
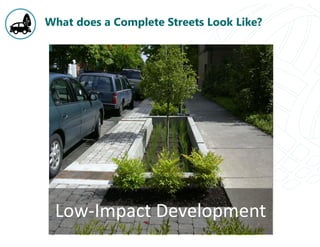
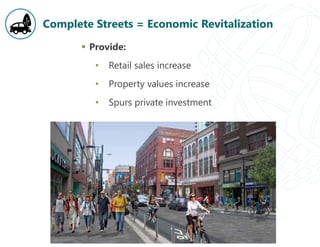
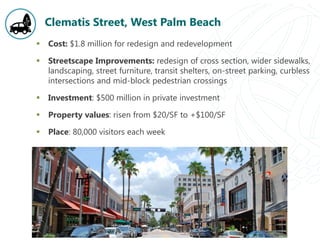
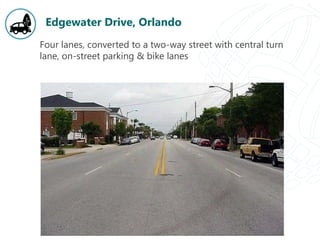
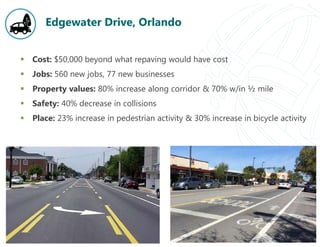
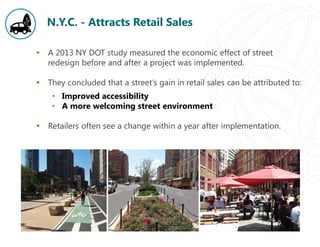
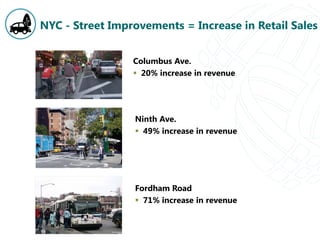
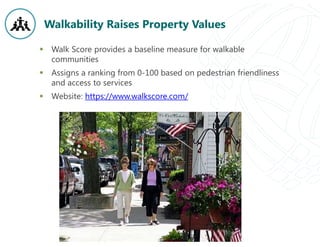
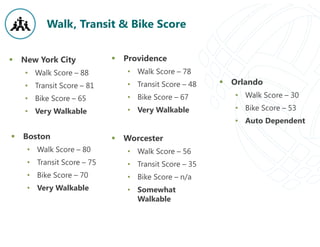
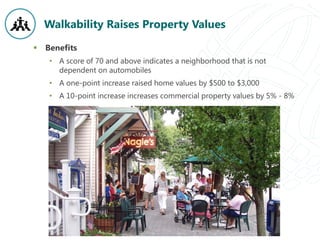
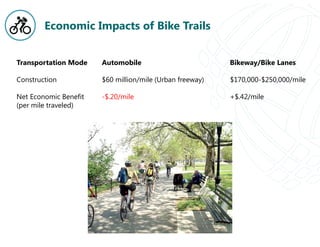
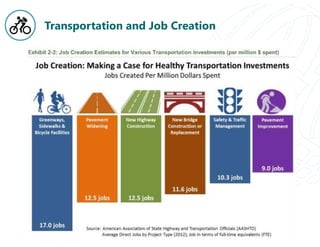
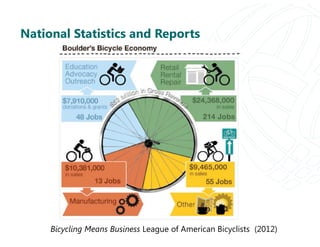
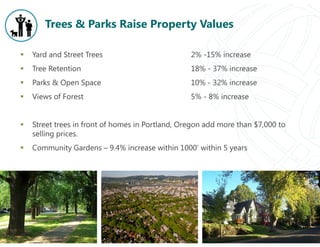
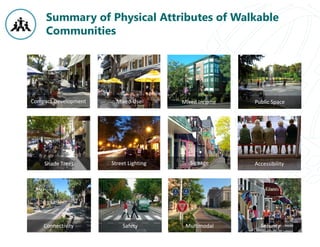
Placemaking through Complete Streets…the
economic bang for your
SNEAPA – October 21, 2016
Joe Wanat, VHB
Martina Haggerty, City of Providence
Steve Rolle, City of Worcester
OVERVIEW
 The Benefits of Placemaking
and Complete Streets
 Providence Experience… The
Creative Capital
 Worcester Experience… The
Heart of the Commonwealth
 Tell us your thoughts…
Audience interactive polling
exercise
 Open Discussion/Questions
The Benefits of Placemaking and Complete Streets
PLACEMAKING IS…
 about creating great places!
 they are easy to get to, they are
fun, safe, memorable and
attractive places to visit
 capitalizes on the unique assets of
a community and promote
people’s health, happiness and
well being
 these special places are
memorable and desirable places
to live, work and play in
 they have the ability to create an
economic return on investment
‘What Makes People Happy with their Communities?’
The top 3 drivers indicating how emotionally connected
someone is to their community.
The Gallup and Knight Foundation surveyed 26 U.S. cities/43,000 people and asked: 
Social Offerings Aesthetics Openness
Fewer millennials are getting a driver’s
license
Examples of Successful Public Places
Orlando
Examples of Successful Public Places
Winter Garden
Examples of Successful Public Places
Indianapolis
Examples of Successful Public Places
New York City
Examples of Successful Public Places
Washington DC
Public Places Boost the Economy
“Neighborhoods, cities and regions are awakening to the importance
of ‘place’ in economic development.”
They recognize the critical importance of:
1. quality of life to attracting talent
2. entrepreneurship
3. supporting local businesses
This work has been described as a “sense of place” or “place-based
economic development” or simply “placemaking.”
Michigan Governor Rick Snyder, 2011
Companies are moving to downtowns
 Walkable neighborhoods
 Transportation options
 Retain and recruit talented workers
 Amenity rich environment
 Great office space & culture
Incomplete Streets
 Incomplete streets are designed for cars only
 Dangerous
 Unhealthy
 Unattractive
Incomplete Streets
Complete Streets
 Addresses all users; pedestrians, bicycle, transit, auto & freight
 Increases safety for all users
 Increases livability
 Enhances destinations & employment centers
 Increases Economic Development potential for communities
What does a Complete Streets Look Like?
Sidewalks
What does a Complete Streets Look Like?
Street & Patio Furniture
What does a Complete Streets Look Like?
Pedestrian Signage
What does a Complete Streets Look Like?
Enhanced Pedestrian Crossing
What does a Complete Streets Look Like?
Bike Lanes/Sharrows
What does a Complete Streets Look Like?
Separated Bike Lanes
What does a Complete Streets Look Like?
Low‐Impact Development
Complete Streets = Economic Revitalization
 Provide:
• Retail sales increase
• Property values increase
• Spurs private investment
Lancaster Boulevard, CA
Nine block, five-lane road w/ travel speeds up to 50 mph
Lancaster Boulevard, CA
 Cost: $11.6 million street renovation project
 Streetscape Improvements: narrow travel lanes, wider sidewalks,
pedestrian-plaza, street trees, gateways and public art
 Development: 110,000 SF commercial space & over 800 low-
income apartments
Lancaster Boulevard, CA
 Jobs: 800
 Sales tax revenue: 26%
 Safety: collisions down by 50%
 Investment: $400 million in economic output
Clematis Street, West Palm Beach
Three lanes, converted to a two-way street with on-street parking
Clematis Street, West Palm Beach
 Cost: $1.8 million for redesign and redevelopment
 Streetscape Improvements: redesign of cross section, wider sidewalks,
landscaping, street furniture, transit shelters, on-street parking, curbless
intersections and mid-block pedestrian crossings
 Investment: $500 million in private investment
 Property values: risen from $20/SF to +$100/SF
 Place: 80,000 visitors each week
Edgewater Drive, Orlando
Four lanes, converted to a two-way street with central turn
lane, on-street parking & bike lanes
Edgewater Drive, Orlando
 Cost: $50,000 beyond what repaving would have cost
 Jobs: 560 new jobs, 77 new businesses
 Property values: 80% increase along corridor & 70% w/in ½ mile
 Safety: 40% decrease in collisions
 Place: 23% increase in pedestrian activity & 30% increase in bicycle activity
N.Y.C. - Attracts Retail Sales
 A 2013 NY DOT study measured the economic effect of street
redesign before and after a project was implemented.
 They concluded that a street’s gain in retail sales can be attributed to:
• Improved accessibility
• A more welcoming street environment
 Retailers often see a change within a year after implementation.
NYC - Street Improvements = Increase in Retail Sales
Columbus Ave.
 20% increase in revenue
Ninth Ave.
 49% increase in revenue
Fordham Road
 71% increase in revenue
Walkability Raises Property Values
 Walk Score provides a baseline measure for walkable
communities
 Assigns a ranking from 0-100 based on pedestrian friendliness
and access to services
 Website: https://www.walkscore.com/
Walk, Transit & Bike Score
 New York City
• Walk Score – 88
• Transit Score – 81
• Bike Score – 65
• Very Walkable
 Boston
• Walk Score – 80
• Transit Score – 75
• Bike Score – 70
• Very Walkable
 Orlando
• Walk Score – 30
• Bike Score – 53
• Auto Dependent
 Providence
• Walk Score – 78
• Transit Score – 48
• Bike Score – 67
• Very Walkable
 Worcester
• Walk Score – 56
• Transit Score – 35
• Bike Score – n/a
• Somewhat
Walkable
Walkability Raises Property Values
 Benefits
• A score of 70 and above indicates a neighborhood that is not
dependent on automobiles
• A one-point increase raised home values by $500 to $3,000
• A 10-point increase increases commercial property values by 5% - 8%
Orange County Trails
 Jobs: 516
 Revenue: $42 million annually
West Orange Trail
 Revenue: $5 million
 Revenue attributed to trail users: 25%
Monon Trail, Indianapolis
“It may not have sand and crashing waves, but the Monon Trail is the
equivalent of beachfront property in the Indianapolis area.”
-Bill Ruthhard, Indianapolis Star
 Cost: $7 million for first segment
 Improvements: Converted rail bed to multi-use trail
 Users: 1.2 million in first year
 Property Value: 11% increase within ½-mile
 Marion County Trails: $140 million in total property value increase
Indianapolis Cultural Trail, Indianapolis
 Cost: $63 million to redesign and rebuild
 Streetscape Improvements: multi-use trail, landscaping, signage,
specialty paving, street furniture, green infrastructure
 Jobs: 11,000
 Investment: + $800 million in total economic impact
 Property Value: w/in 1 block of trail increased 148% or $1 B
 Place: Community reinvestment & increased property value
American Tobacco Trail in North Carolina
 Cost: $11.2 million
 Improvements: 22 miles and new bridge built connect two trails
 Gross business revenue: $4.9 million
 Jobs: 43 jobs
 Average Spending of Trail Users: $16
 Trail Use: 133% increase
Why We Measure Economic Impacts
Influence lawmakers and transportation officials to:
 Increase funding for bicycle and pedestrian projects
 Inform project prioritization
 Measure transportation plan performance in favor of all
modes
Affect local development through:
 Complete street ordinances and policies
 Local land plans supporting mixed use and walkable
communities
 Partnerships with local businesses to provide
accommodations
Economic Impacts of Bike Trails
Transportation Mode Automobile Bikeway/Bike Lanes
Construction $60 million/mile (Urban freeway) $170,000-$250,000/mile
Net Economic Benefit -$.20/mile +$.42/mile
(per mile traveled)
Transportation and Job Creation
National Statistics and Reports
Bicycling Means Business League of American Bicyclists (2012)
National Statistics and Reports
Outdoor Industry Foundation (2005)
 Yard and Street Trees 2% -15% increase
 Tree Retention 18% - 37% increase
 Parks & Open Space 10% - 32% increase
 Views of Forest 5% - 8% increase
 Street trees in front of homes in Portland, Oregon add more than $7,000 to
selling prices.
 Community Gardens – 9.4% increase within 1000’ within 5 years
Trees & Parks Raise Property Values
Summary of Physical Attributes of Walkable
Communities
Compact Development Mixed Use Mixed Income Public Space
Shade Trees Street Lighting  Signage Accessibility
Connectivity Safety Multimodal Security
Providence Experience… The Creative Capital
Worcester Experience… The Heart of the
Commonwealth
Audience interactive polling
Placemaking through Complete Streets…the
economic bang for your
SNEAPA – October 21, 2016

Placemaking through complete streets

  • 1.
    Placemaking through CompleteStreets…the economic bang for your SNEAPA – October 21, 2016 Joe Wanat, VHB Martina Haggerty, City of Providence Steve Rolle, City of Worcester
  • 2.
    OVERVIEW  The Benefitsof Placemaking and Complete Streets  Providence Experience… The Creative Capital  Worcester Experience… The Heart of the Commonwealth  Tell us your thoughts… Audience interactive polling exercise  Open Discussion/Questions
  • 3.
    The Benefits ofPlacemaking and Complete Streets
  • 4.
    PLACEMAKING IS…  aboutcreating great places!  they are easy to get to, they are fun, safe, memorable and attractive places to visit  capitalizes on the unique assets of a community and promote people’s health, happiness and well being  these special places are memorable and desirable places to live, work and play in  they have the ability to create an economic return on investment
  • 5.
    ‘What Makes PeopleHappy with their Communities?’ The top 3 drivers indicating how emotionally connected someone is to their community. The Gallup and Knight Foundation surveyed 26 U.S. cities/43,000 people and asked:  Social Offerings Aesthetics Openness
  • 6.
    Fewer millennials aregetting a driver’s license
  • 7.
    Examples of SuccessfulPublic Places Orlando
  • 8.
    Examples of SuccessfulPublic Places Winter Garden
  • 9.
    Examples of SuccessfulPublic Places Indianapolis
  • 10.
    Examples of SuccessfulPublic Places New York City
  • 11.
    Examples of SuccessfulPublic Places Washington DC
  • 12.
    Public Places Boostthe Economy “Neighborhoods, cities and regions are awakening to the importance of ‘place’ in economic development.” They recognize the critical importance of: 1. quality of life to attracting talent 2. entrepreneurship 3. supporting local businesses This work has been described as a “sense of place” or “place-based economic development” or simply “placemaking.” Michigan Governor Rick Snyder, 2011
  • 13.
    Companies are movingto downtowns  Walkable neighborhoods  Transportation options  Retain and recruit talented workers  Amenity rich environment  Great office space & culture
  • 14.
    Incomplete Streets  Incompletestreets are designed for cars only  Dangerous  Unhealthy  Unattractive
  • 15.
  • 16.
    Complete Streets  Addressesall users; pedestrians, bicycle, transit, auto & freight  Increases safety for all users  Increases livability  Enhances destinations & employment centers  Increases Economic Development potential for communities
  • 17.
    What does aComplete Streets Look Like? Sidewalks
  • 18.
    What does aComplete Streets Look Like? Street & Patio Furniture
  • 19.
    What does aComplete Streets Look Like? Pedestrian Signage
  • 20.
    What does aComplete Streets Look Like? Enhanced Pedestrian Crossing
  • 21.
    What does aComplete Streets Look Like? Bike Lanes/Sharrows
  • 22.
    What does aComplete Streets Look Like? Separated Bike Lanes
  • 23.
    What does aComplete Streets Look Like? Low‐Impact Development
  • 24.
    Complete Streets =Economic Revitalization  Provide: • Retail sales increase • Property values increase • Spurs private investment
  • 25.
    Lancaster Boulevard, CA Nineblock, five-lane road w/ travel speeds up to 50 mph
  • 26.
    Lancaster Boulevard, CA Cost: $11.6 million street renovation project  Streetscape Improvements: narrow travel lanes, wider sidewalks, pedestrian-plaza, street trees, gateways and public art  Development: 110,000 SF commercial space & over 800 low- income apartments
  • 27.
    Lancaster Boulevard, CA Jobs: 800  Sales tax revenue: 26%  Safety: collisions down by 50%  Investment: $400 million in economic output
  • 28.
    Clematis Street, WestPalm Beach Three lanes, converted to a two-way street with on-street parking
  • 29.
    Clematis Street, WestPalm Beach  Cost: $1.8 million for redesign and redevelopment  Streetscape Improvements: redesign of cross section, wider sidewalks, landscaping, street furniture, transit shelters, on-street parking, curbless intersections and mid-block pedestrian crossings  Investment: $500 million in private investment  Property values: risen from $20/SF to +$100/SF  Place: 80,000 visitors each week
  • 30.
    Edgewater Drive, Orlando Fourlanes, converted to a two-way street with central turn lane, on-street parking & bike lanes
  • 31.
    Edgewater Drive, Orlando Cost: $50,000 beyond what repaving would have cost  Jobs: 560 new jobs, 77 new businesses  Property values: 80% increase along corridor & 70% w/in ½ mile  Safety: 40% decrease in collisions  Place: 23% increase in pedestrian activity & 30% increase in bicycle activity
  • 32.
    N.Y.C. - AttractsRetail Sales  A 2013 NY DOT study measured the economic effect of street redesign before and after a project was implemented.  They concluded that a street’s gain in retail sales can be attributed to: • Improved accessibility • A more welcoming street environment  Retailers often see a change within a year after implementation.
  • 33.
    NYC - StreetImprovements = Increase in Retail Sales Columbus Ave.  20% increase in revenue Ninth Ave.  49% increase in revenue Fordham Road  71% increase in revenue
  • 34.
    Walkability Raises PropertyValues  Walk Score provides a baseline measure for walkable communities  Assigns a ranking from 0-100 based on pedestrian friendliness and access to services  Website: https://www.walkscore.com/
  • 35.
    Walk, Transit &Bike Score  New York City • Walk Score – 88 • Transit Score – 81 • Bike Score – 65 • Very Walkable  Boston • Walk Score – 80 • Transit Score – 75 • Bike Score – 70 • Very Walkable  Orlando • Walk Score – 30 • Bike Score – 53 • Auto Dependent  Providence • Walk Score – 78 • Transit Score – 48 • Bike Score – 67 • Very Walkable  Worcester • Walk Score – 56 • Transit Score – 35 • Bike Score – n/a • Somewhat Walkable
  • 36.
    Walkability Raises PropertyValues  Benefits • A score of 70 and above indicates a neighborhood that is not dependent on automobiles • A one-point increase raised home values by $500 to $3,000 • A 10-point increase increases commercial property values by 5% - 8%
  • 37.
    Orange County Trails Jobs: 516  Revenue: $42 million annually West Orange Trail  Revenue: $5 million  Revenue attributed to trail users: 25%
  • 38.
    Monon Trail, Indianapolis “Itmay not have sand and crashing waves, but the Monon Trail is the equivalent of beachfront property in the Indianapolis area.” -Bill Ruthhard, Indianapolis Star  Cost: $7 million for first segment  Improvements: Converted rail bed to multi-use trail  Users: 1.2 million in first year  Property Value: 11% increase within ½-mile  Marion County Trails: $140 million in total property value increase
  • 39.
    Indianapolis Cultural Trail,Indianapolis  Cost: $63 million to redesign and rebuild  Streetscape Improvements: multi-use trail, landscaping, signage, specialty paving, street furniture, green infrastructure  Jobs: 11,000  Investment: + $800 million in total economic impact  Property Value: w/in 1 block of trail increased 148% or $1 B  Place: Community reinvestment & increased property value
  • 40.
    American Tobacco Trailin North Carolina  Cost: $11.2 million  Improvements: 22 miles and new bridge built connect two trails  Gross business revenue: $4.9 million  Jobs: 43 jobs  Average Spending of Trail Users: $16  Trail Use: 133% increase
  • 41.
    Why We MeasureEconomic Impacts Influence lawmakers and transportation officials to:  Increase funding for bicycle and pedestrian projects  Inform project prioritization  Measure transportation plan performance in favor of all modes Affect local development through:  Complete street ordinances and policies  Local land plans supporting mixed use and walkable communities  Partnerships with local businesses to provide accommodations
  • 42.
    Economic Impacts ofBike Trails Transportation Mode Automobile Bikeway/Bike Lanes Construction $60 million/mile (Urban freeway) $170,000-$250,000/mile Net Economic Benefit -$.20/mile +$.42/mile (per mile traveled)
  • 43.
  • 44.
    National Statistics andReports Bicycling Means Business League of American Bicyclists (2012)
  • 45.
    National Statistics andReports Outdoor Industry Foundation (2005)
  • 46.
     Yard andStreet Trees 2% -15% increase  Tree Retention 18% - 37% increase  Parks & Open Space 10% - 32% increase  Views of Forest 5% - 8% increase  Street trees in front of homes in Portland, Oregon add more than $7,000 to selling prices.  Community Gardens – 9.4% increase within 1000’ within 5 years Trees & Parks Raise Property Values
  • 47.
    Summary of PhysicalAttributes of Walkable Communities Compact Development Mixed Use Mixed Income Public Space Shade Trees Street Lighting  Signage Accessibility Connectivity Safety Multimodal Security
  • 48.
  • 49.
    Worcester Experience… TheHeart of the Commonwealth
  • 50.
  • 51.
    Placemaking through CompleteStreets…the economic bang for your SNEAPA – October 21, 2016