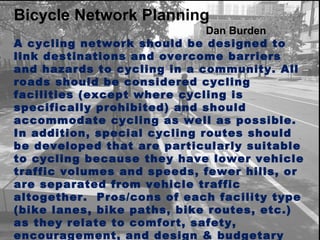
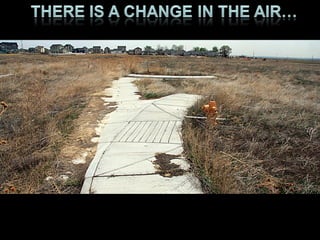
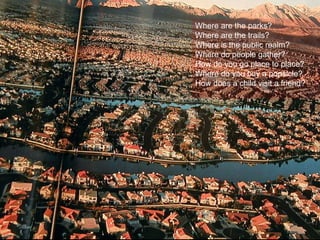
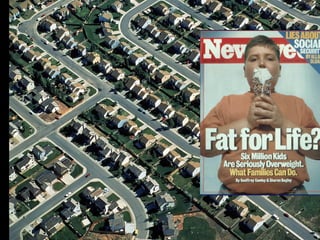
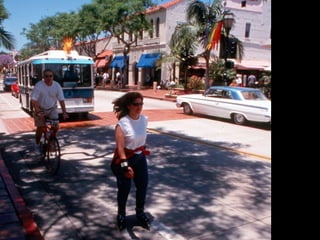
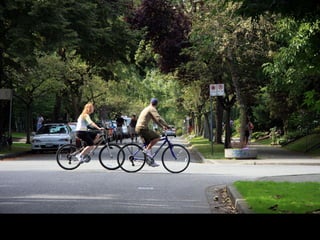
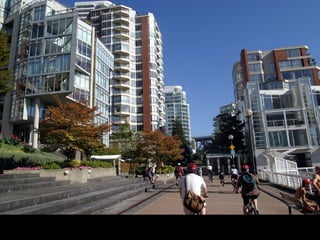
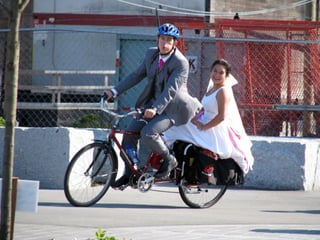
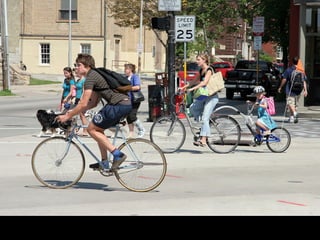
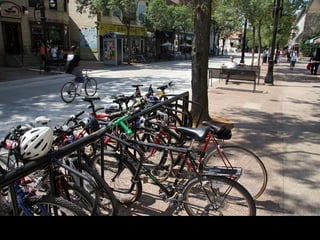
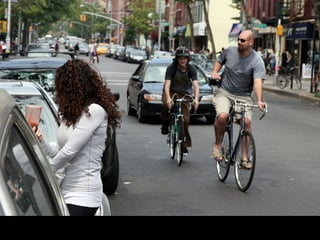
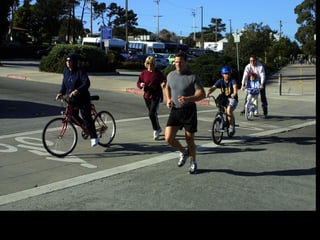
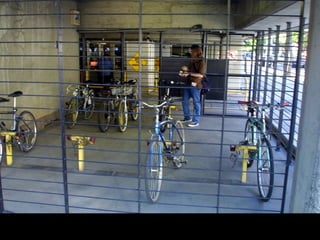
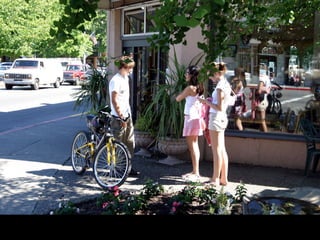
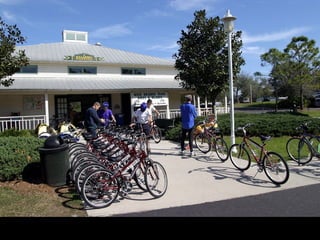
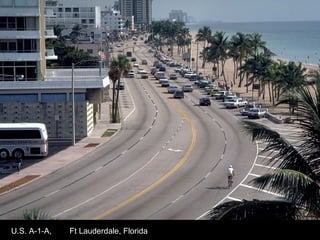
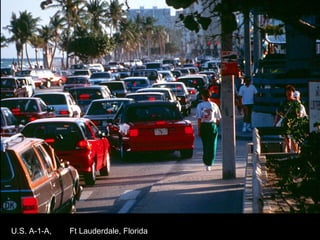
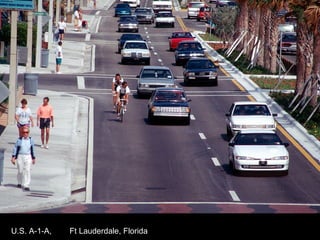
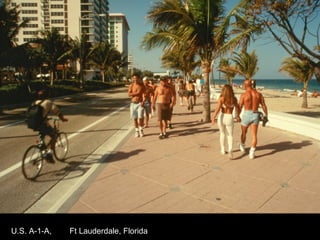
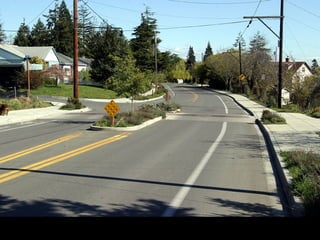
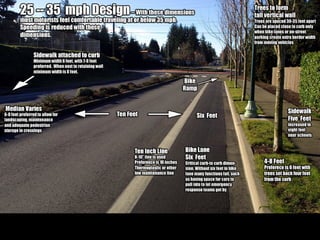
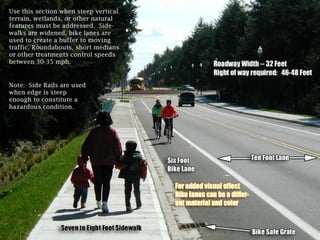
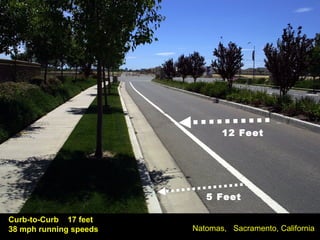
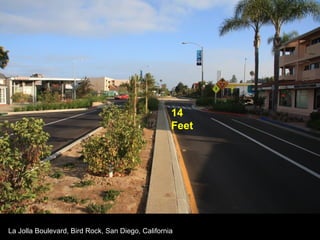
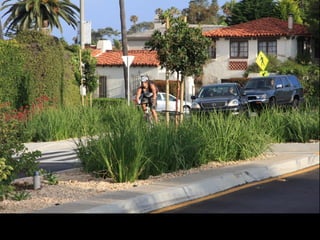
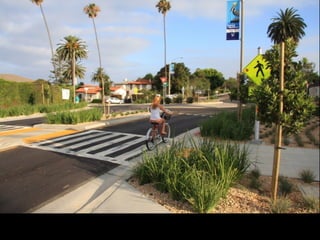
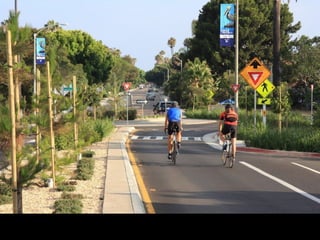
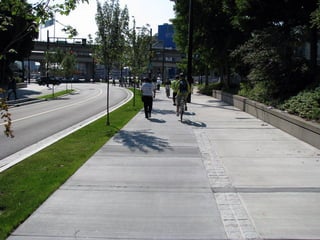
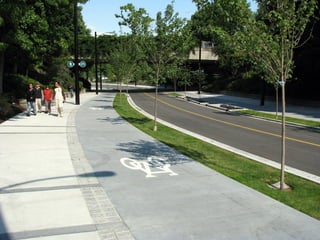
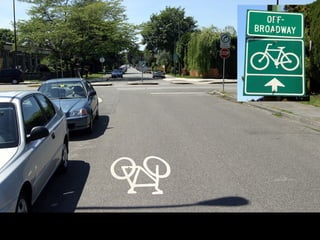
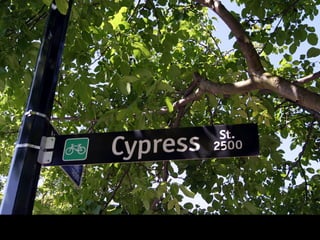
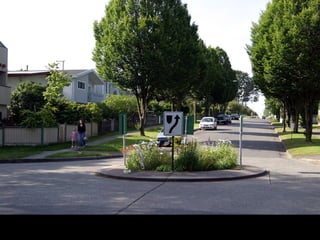
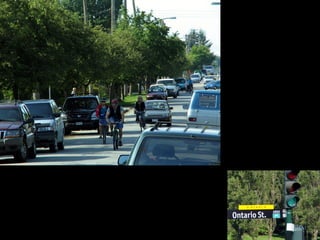
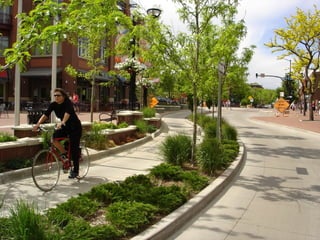
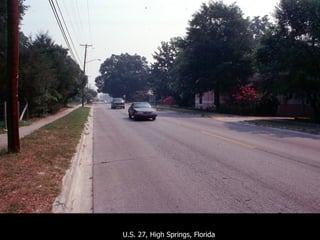
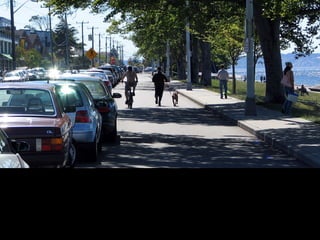
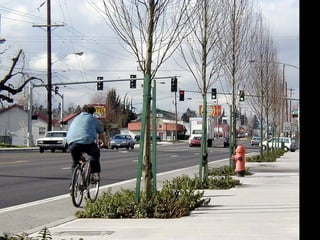
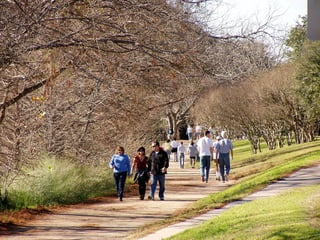
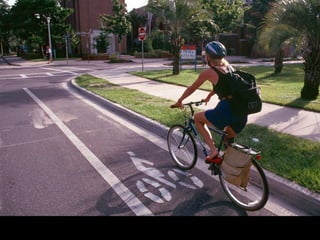
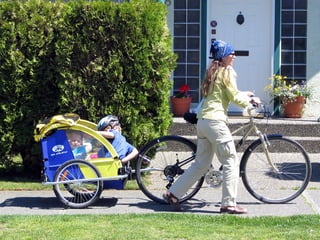
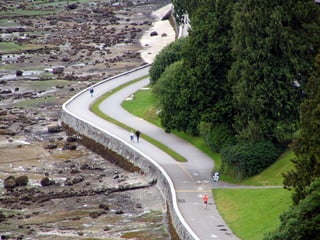
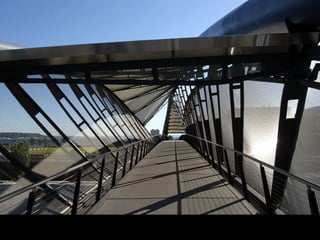
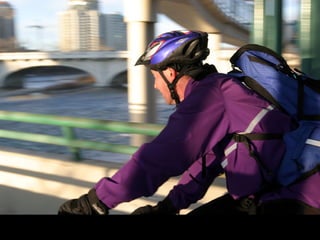
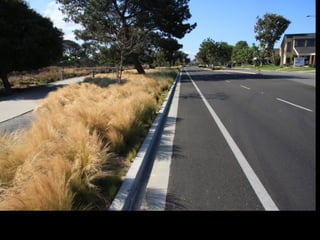
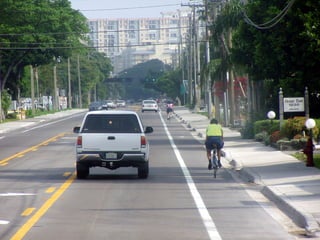
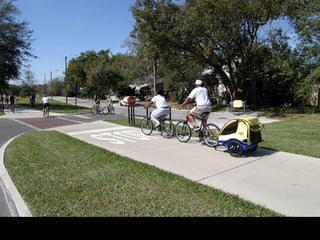
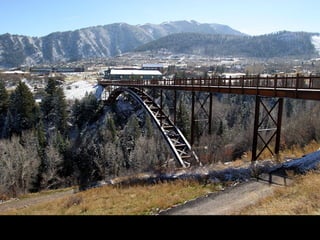
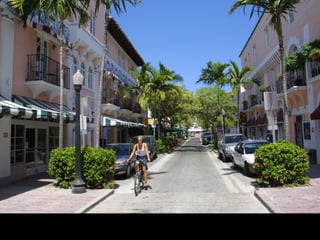
The future is coming… Stand   by:
Bicycle Network Planning Dan Burden  A cycling network should be designed to link destinations and overcome barriers and hazards to cycling in a community. All roads should be considered cycling facilities (except where cycling is specifically prohibited) and should accommodate cycling as well as possible. In addition, special cycling routes should be developed that are particularly suitable to cycling because they have lower vehicle traffic volumes and speeds, fewer hills, or are separated from vehicle traffic altogether.  Pros/cons of each facility type (bike lanes, bike paths, bike routes, etc.) as they relate to comfort, safety, encouragement, and design & budgetary constraints.
 
 
2001 National Geographic Magazine Article on Sprawl Photo by:  Newsday Levittown New York Where are the parks? Where are the trails? Where is the public realm? Where do people gather? How do you go place to place? Where do you buy a popsicle? How does a child visit a friend?
 
Surgeon General’s Report 21% US citizens ages 9-17 have a diagnosable mental or addictive disorder associated with at least minimum impairment
Depressive Disorders 19 million American adults Leading cause of disability in the USA  Treatment: Medication Social Contact, including therapy And…..
Vehicle miles traveled (VMT) around the U.S. have increased by  70 percent  over the last 20 years ,  compared with a  two percent  increase in new highway construction.   The U.S. General Accounting Office predicts that road congestion in the U.S. will  triple in 15 years  even if capacity is increased by 20 percent.   Traffic is growing about five times faster than the growth in population.  (Data compiled for a report to the U.S. Department of Transportation in 2006 written by Stephen Polzin, (transportation researcher at the University of South Florida in Tampa.) Why we cannot build our way out of traffic Roads built Traffic Growth
What is a sustainable number?
Sustainable Transportation is about meeting present transportation needs without compromising the ability of future generations to meet their needs.”  The concept of sustainable transportation is a reaction to things that have gone radically and visibly wrong with current transportation and land use policy, practice and performance over the last half of the twentieth century. In particular unsustainable transportation consumes more energy and creates pollution and declining service levels despite increasing investments.  It delivers poor service for specific social and economic groups. It reduces happiness. It raises the cost of personal transportation to 20% of a family budget and takes time away from family time and ties.  Indirectly, it increases health care to 15-20%
Conventional Approach System Management More Pavement More Lanes More Roads ITS More Cars More Car-Carrying Capacity
Lateral Approach Increase Quality of Travel User View and Comfort Context-Sensitive Design Traffic Calming Personal Security Move Less People, Fewer Miles Intensify land use densities Promote Mixed Use Development Transit Supportive Development Demand Management – Pricing,  e-commerce, telecommuting, etc… Lane Limits Change Standards Shift Policy Conventional Approach System Management More Pavement More Lanes More Roads ITS More Cars Transit Bicycling Walking HOV/HOT Lanes Move People, Not Cars A Balanced Transportation Approach More Car- Carrying Capacity
A recent study in Seattle found that each quartile increase in residential density corresponded with a 23 per cent increase in the odds of walking or bicycling for non-work travel. (King County ORTP, 2005). Seattle, Washington Seattle starts a new pedestrian or cycling project each six hours … (over 500 per year). Seattle responds to citizen complaints within 48 hours. Always!


Vancouver now has so much density that there is no comparison until you travel to Asia …  to Beijing, Hong Kong, or Tokyo. As Vancouver has built itself into the one city in the “Most Livable City in the World” …Vehicle Miles Per  Day (VPD) is declining. Registered car ownership is  also declining. Virtually all growth occurred in brown fields, industrial yards, old rail yards.  Virtually all former single family homes are still  in place.  Loved, cared for, and worth a heck of a lot of money.


Complete Streets,  Green Streets,  Context Sensitive Design  LEED for Neighborhood  Design Healthy Streets Terms Describing Streets of the Future
The streets of our cities and towns ought to be for everyone, whether young or old, motorist or bicyclist, walker or wheelchair user, bus rider or shopkeeper. But too many of our streets are designed only for speeding cars, or worse, creeping traffic jams. They’re unsafe for people on foot or bike — and unpleasant for everybody.
The Pedestrian and Bicyclist in America has been marginalized and compromised to Death The discussion we need cannot center on whether this will or will not be a “Complete Street” but rather if we should be building this system in the first place.
Smart Streets   form highly-connected networks of complete streets.  Street connectivity and sidewalk completeness are correlated with lower average vehicle use per person as well as dispersed vehicle loads that can decrease congestion.
Smart Streets   are right sized for their place an mission, and not built to a model that does not take in the values of the people who will live there. Narrow streets help to create comfortable settings for walking, gathering, and lingering, especially in neighborhoods and shopping districts. They often work within a larger network that provides a framework of higher-speed streets that offer connectivity to regional destinations.  With regard to ecological aims, right-sizing means limiting impervious surfaces and potentially “freeing” right of way space that can do double duty by functioning to buffer roadside activity and travel lanes while also introducing ecological functions in the street space.
Smart Streets   are designed and managed with speeds and intersections appropriate to context. To advance walkability and compact development patterns, smart growth street designs manage speed and intersection operations to advance overall community objectives.
 
 
U.S. A-1-A,  Ft Lauderdale, Florida
 
 
Capacity of Streets Reframing Key Transportation Conventions DESIGN TRAFFIC -  Interpreting the Results
Where would you rather walk?  Where would you rather bike?  Which is the safest place to bike? Where would you rather drive?  Where would you rather live?  Which is the safest place to drive?
 
Pedestrian LOQ A C B B D Bicyclist LOQ  C
Lake Oswego,  Oregon What would the quality of this walking experience be without this on-street parking and tree canopy .
Space permitting, use with bike lanes (6’ parking, 7’ bike lanes) Six Feet Wide Seven Feet Wide Del Mar, California 10 foot lanes
Davidson, North Carolina Four Feet Six Feet Two Feet Ten Feet
Healthy Streets for Healthy People   January, 2005 Dan Burden, Glatting Jackson and Walkable Communities, Inc.
Bridgeport Way  University Place, Washington
 
MAIN STREET DEVELOPMENT 30 mph  speed zone 25 mph  speed zone 45 mph  speed zone
 
You Know When You Have Left Claremont Claremont, California
Proposed x-section alternatives on Foothill Blvd – S side 18’ 11.5’ travel ½ section curb to median south (school) side median/CTL travel planting 11’ 11.5’ travel Soft surface trail and bike lane median/CTL 13’ travel soft-surface trail shy zone new curb 6’ bike 11’ 11.5’ travel Sidewalk and bike lane median/CTL travel Sidewalk shy zone new curb 6’ bike 11’ 11.5’ travel Sidewalk, landscape buffer, and bike lane median/CTL travel Sidewalk shy zone new curb 6’ bike
11.5’ 18’ travel ½ section median to curb north (commercial) side median/CTL 13’ sidewalk travel Proposed x-section alternatives on Foothill Blvd – N side 11.5’ 11’ travel Bike lane and wider sidewalk median/CTL 15’ sidewalk area travel 6’ bike 11.5’ 11’ travel Bike lane & wider sidewalk with parking bays median/CTL 15’ parking travel 6’ bike walking 11.5’ 11’ travel Bike lane & wider sidewalk with textured parking bays median/CTL 15’ parking travel 6’ bike walking


12 Feet 5 Feet Natomas,  Sacramento, California Curb-to-Curb  17 feet  38 mph running speeds
Grandview Drive , University Place, WA  (33 mph  Average Speed)
University Place, Washington
University Place, Washington 10  Feet


Delft, UT Campus Holland.  Example of Alternative of off-street trail system/walkway


Connectivity


Meriam Park, Chico, California
Connectivity Requirements Compact Area Type for Network Additions Link-Node Ratio of 1.6 or greater One external connection as well as an additional external connection and stub-out per 50 links or fraction thereof Virginia DOT


Holcomb Bridge Rd. Alpharetta Hwy. Crossville Rd. Crabapple Rd. Old Ala Rd. Hembree Rd. Azalea Pine Grove Rd. Marietta Hwy. Woodstock Rd. Riverside Rd. Hardscrabble Rd. Houze Rd. Roswell, Georgia 3,260 miles of roads 400 N
Holcomb Bridge Rd. Alpharetta Hwy. Crossville Rd. Crabapple Rd. Old Ala Rd. Hembree Rd. Azalea Pine Grove Rd. Marietta Hwy. Woodstock Rd. Riverside Rd. Hardscrabble Rd. Houze Rd. Roswell, Georgia 3,260 miles of roads 760 miles connect Only 22% of roads are doing the heavy lifting 400 N


Design for a mix of land uses: Centers include denser housing, a square, civic uses, and neighborhood- oriented retail. Civic Buildings Neighborhood Centers Parks and Open Spaces
Land Use Pattern Affects Travel  Higher Density can reduce Vehicle Trips Source:  John Holtzclaw, PhD, Sierra Club Vehicle Trips Walking Trips Significant reduction in VMT as we go from 3-4 units/acre to over 20 units/acre 2-3 du/a 6-7 du/a 7-10 du/a 11-18 du/a 20 du/a
11-12 du/a net 8-10 du/a net
Road Diets
 
 
La Jolla Boulevard, Bird Rock, San Diego, California  (Five to two lane conversion, before).  Four signals and one four-way stop being removed. Back-in Angled parking to be added. (23,000 ADT) 78 Feet
La Jolla Boulevard, Bird Rock, San Diego, California
La Jolla Boulevard, Bird Rock, San Diego, California 14 Feet


U.S. 27, High Springs, Florida


San Diego, California


Dan Burden Presentation

  • 1.
    The future iscoming… Stand by:
  • 2.
    Bicycle Network PlanningDan Burden A cycling network should be designed to link destinations and overcome barriers and hazards to cycling in a community. All roads should be considered cycling facilities (except where cycling is specifically prohibited) and should accommodate cycling as well as possible. In addition, special cycling routes should be developed that are particularly suitable to cycling because they have lower vehicle traffic volumes and speeds, fewer hills, or are separated from vehicle traffic altogether. Pros/cons of each facility type (bike lanes, bike paths, bike routes, etc.) as they relate to comfort, safety, encouragement, and design & budgetary constraints.
  • 3.
  • 4.
  • 5.
    2001 National GeographicMagazine Article on Sprawl Photo by: Newsday Levittown New York Where are the parks? Where are the trails? Where is the public realm? Where do people gather? How do you go place to place? Where do you buy a popsicle? How does a child visit a friend?
  • 6.
  • 7.
    Surgeon General’s Report21% US citizens ages 9-17 have a diagnosable mental or addictive disorder associated with at least minimum impairment
  • 8.
    Depressive Disorders 19million American adults Leading cause of disability in the USA Treatment: Medication Social Contact, including therapy And…..
  • 9.
    Vehicle miles traveled(VMT) around the U.S. have increased by 70 percent over the last 20 years , compared with a two percent increase in new highway construction. The U.S. General Accounting Office predicts that road congestion in the U.S. will triple in 15 years even if capacity is increased by 20 percent. Traffic is growing about five times faster than the growth in population. (Data compiled for a report to the U.S. Department of Transportation in 2006 written by Stephen Polzin, (transportation researcher at the University of South Florida in Tampa.) Why we cannot build our way out of traffic Roads built Traffic Growth
  • 10.
    What is asustainable number?
  • 11.
    Sustainable Transportation isabout meeting present transportation needs without compromising the ability of future generations to meet their needs.” The concept of sustainable transportation is a reaction to things that have gone radically and visibly wrong with current transportation and land use policy, practice and performance over the last half of the twentieth century. In particular unsustainable transportation consumes more energy and creates pollution and declining service levels despite increasing investments. It delivers poor service for specific social and economic groups. It reduces happiness. It raises the cost of personal transportation to 20% of a family budget and takes time away from family time and ties. Indirectly, it increases health care to 15-20%
  • 12.
    Conventional Approach SystemManagement More Pavement More Lanes More Roads ITS More Cars More Car-Carrying Capacity
  • 13.
    Lateral Approach IncreaseQuality of Travel User View and Comfort Context-Sensitive Design Traffic Calming Personal Security Move Less People, Fewer Miles Intensify land use densities Promote Mixed Use Development Transit Supportive Development Demand Management – Pricing, e-commerce, telecommuting, etc… Lane Limits Change Standards Shift Policy Conventional Approach System Management More Pavement More Lanes More Roads ITS More Cars Transit Bicycling Walking HOV/HOT Lanes Move People, Not Cars A Balanced Transportation Approach More Car- Carrying Capacity
  • 14.
    A recent studyin Seattle found that each quartile increase in residential density corresponded with a 23 per cent increase in the odds of walking or bicycling for non-work travel. (King County ORTP, 2005). Seattle, Washington Seattle starts a new pedestrian or cycling project each six hours … (over 500 per year). Seattle responds to citizen complaints within 48 hours. Always!
  • 15.
  • 16.
  • 17.
  • 18.
  • 19.
  • 20.
  • 21.
    Vancouver now hasso much density that there is no comparison until you travel to Asia … to Beijing, Hong Kong, or Tokyo. As Vancouver has built itself into the one city in the “Most Livable City in the World” …Vehicle Miles Per Day (VPD) is declining. Registered car ownership is also declining. Virtually all growth occurred in brown fields, industrial yards, old rail yards. Virtually all former single family homes are still in place. Loved, cared for, and worth a heck of a lot of money.
  • 22.
  • 23.
  • 24.
  • 25.
  • 26.
  • 27.
  • 28.
  • 29.
  • 30.
  • 31.
  • 32.
  • 33.
  • 34.
  • 35.
  • 36.
    Complete Streets, Green Streets, Context Sensitive Design LEED for Neighborhood Design Healthy Streets Terms Describing Streets of the Future
  • 37.
    The streets ofour cities and towns ought to be for everyone, whether young or old, motorist or bicyclist, walker or wheelchair user, bus rider or shopkeeper. But too many of our streets are designed only for speeding cars, or worse, creeping traffic jams. They’re unsafe for people on foot or bike — and unpleasant for everybody.
  • 38.
    The Pedestrian andBicyclist in America has been marginalized and compromised to Death The discussion we need cannot center on whether this will or will not be a “Complete Street” but rather if we should be building this system in the first place.
  • 39.
    Smart Streets form highly-connected networks of complete streets. Street connectivity and sidewalk completeness are correlated with lower average vehicle use per person as well as dispersed vehicle loads that can decrease congestion.
  • 40.
    Smart Streets are right sized for their place an mission, and not built to a model that does not take in the values of the people who will live there. Narrow streets help to create comfortable settings for walking, gathering, and lingering, especially in neighborhoods and shopping districts. They often work within a larger network that provides a framework of higher-speed streets that offer connectivity to regional destinations. With regard to ecological aims, right-sizing means limiting impervious surfaces and potentially “freeing” right of way space that can do double duty by functioning to buffer roadside activity and travel lanes while also introducing ecological functions in the street space.
  • 41.
    Smart Streets are designed and managed with speeds and intersections appropriate to context. To advance walkability and compact development patterns, smart growth street designs manage speed and intersection operations to advance overall community objectives.
  • 42.
  • 43.
  • 44.
    U.S. A-1-A, Ft Lauderdale, Florida
  • 45.
    U.S. A-1-A, Ft Lauderdale, Florida
  • 46.
    U.S. A-1-A, Ft Lauderdale, Florida
  • 47.
    U.S. A-1-A, Ft Lauderdale, Florida
  • 48.
  • 49.
  • 50.
    Capacity of StreetsReframing Key Transportation Conventions DESIGN TRAFFIC - Interpreting the Results
  • 51.
    Where would yourather walk? Where would you rather bike? Which is the safest place to bike? Where would you rather drive? Where would you rather live? Which is the safest place to drive?
  • 52.
  • 53.
    Pedestrian LOQ AC B B D Bicyclist LOQ C
  • 54.
    Lake Oswego, Oregon What would the quality of this walking experience be without this on-street parking and tree canopy .
  • 55.
    Space permitting, usewith bike lanes (6’ parking, 7’ bike lanes) Six Feet Wide Seven Feet Wide Del Mar, California 10 foot lanes
  • 56.
    Davidson, North CarolinaFour Feet Six Feet Two Feet Ten Feet
  • 57.
    Healthy Streets forHealthy People January, 2005 Dan Burden, Glatting Jackson and Walkable Communities, Inc.
  • 58.
    Bridgeport Way University Place, Washington
  • 59.
  • 60.
    MAIN STREET DEVELOPMENT30 mph speed zone 25 mph speed zone 45 mph speed zone
  • 61.
  • 62.
    You Know WhenYou Have Left Claremont Claremont, California
  • 63.
    Proposed x-section alternativeson Foothill Blvd – S side 18’ 11.5’ travel ½ section curb to median south (school) side median/CTL travel planting 11’ 11.5’ travel Soft surface trail and bike lane median/CTL 13’ travel soft-surface trail shy zone new curb 6’ bike 11’ 11.5’ travel Sidewalk and bike lane median/CTL travel Sidewalk shy zone new curb 6’ bike 11’ 11.5’ travel Sidewalk, landscape buffer, and bike lane median/CTL travel Sidewalk shy zone new curb 6’ bike
  • 64.
    11.5’ 18’ travel½ section median to curb north (commercial) side median/CTL 13’ sidewalk travel Proposed x-section alternatives on Foothill Blvd – N side 11.5’ 11’ travel Bike lane and wider sidewalk median/CTL 15’ sidewalk area travel 6’ bike 11.5’ 11’ travel Bike lane & wider sidewalk with parking bays median/CTL 15’ parking travel 6’ bike walking 11.5’ 11’ travel Bike lane & wider sidewalk with textured parking bays median/CTL 15’ parking travel 6’ bike walking
  • 65.
  • 66.
  • 67.
  • 68.
    12 Feet 5Feet Natomas, Sacramento, California Curb-to-Curb 17 feet 38 mph running speeds
  • 69.
    Grandview Drive ,University Place, WA (33 mph Average Speed)
  • 70.
  • 71.
  • 72.
  • 73.
  • 74.
  • 75.
  • 76.
    Delft, UT CampusHolland. Example of Alternative of off-street trail system/walkway
  • 77.
  • 78.
  • 79.
  • 80.
  • 81.
  • 82.
  • 83.
  • 84.
  • 85.
  • 86.
  • 87.
  • 88.
  • 89.
  • 90.
  • 91.
  • 92.
    Connectivity Requirements CompactArea Type for Network Additions Link-Node Ratio of 1.6 or greater One external connection as well as an additional external connection and stub-out per 50 links or fraction thereof Virginia DOT
  • 93.
  • 94.
  • 95.
  • 96.
  • 97.
  • 98.
  • 99.
  • 100.
  • 101.
    Holcomb Bridge Rd.Alpharetta Hwy. Crossville Rd. Crabapple Rd. Old Ala Rd. Hembree Rd. Azalea Pine Grove Rd. Marietta Hwy. Woodstock Rd. Riverside Rd. Hardscrabble Rd. Houze Rd. Roswell, Georgia 3,260 miles of roads 400 N
  • 102.
    Holcomb Bridge Rd.Alpharetta Hwy. Crossville Rd. Crabapple Rd. Old Ala Rd. Hembree Rd. Azalea Pine Grove Rd. Marietta Hwy. Woodstock Rd. Riverside Rd. Hardscrabble Rd. Houze Rd. Roswell, Georgia 3,260 miles of roads 760 miles connect Only 22% of roads are doing the heavy lifting 400 N
  • 103.
  • 104.
  • 105.
  • 106.
  • 107.
  • 108.
  • 109.
    Design for amix of land uses: Centers include denser housing, a square, civic uses, and neighborhood- oriented retail. Civic Buildings Neighborhood Centers Parks and Open Spaces
  • 110.
    Land Use PatternAffects Travel Higher Density can reduce Vehicle Trips Source: John Holtzclaw, PhD, Sierra Club Vehicle Trips Walking Trips Significant reduction in VMT as we go from 3-4 units/acre to over 20 units/acre 2-3 du/a 6-7 du/a 7-10 du/a 11-18 du/a 20 du/a
  • 111.
    11-12 du/a net8-10 du/a net
  • 112.
  • 113.
  • 114.
  • 115.
    La Jolla Boulevard,Bird Rock, San Diego, California (Five to two lane conversion, before). Four signals and one four-way stop being removed. Back-in Angled parking to be added. (23,000 ADT) 78 Feet
  • 116.
    La Jolla Boulevard,Bird Rock, San Diego, California
  • 117.
    La Jolla Boulevard,Bird Rock, San Diego, California 14 Feet
  • 118.
  • 119.
  • 120.
  • 121.
  • 122.
  • 123.
  • 124.
  • 125.
  • 126.
  • 127.
  • 128.
  • 129.
  • 130.
  • 131.
  • 132.
  • 133.
  • 134.
  • 135.
  • 136.
  • 137.
  • 138.
  • 139.
  • 140.
  • 141.
  • 142.
  • 143.
  • 144.
  • 145.
    U.S. 27, HighSprings, Florida
  • 146.
    U.S. 27, HighSprings, Florida
  • 147.
  • 148.
  • 149.
  • 150.
  • 151.
  • 152.
  • 153.
  • 154.
  • 155.
  • 156.
  • 157.
  • 158.
  • 159.
  • 160.
  • 161.
  • 162.
  • 163.
  • 164.
  • 165.
  • 166.
  • 167.
  • 168.
  • 169.
  • 170.
  • 171.
  • 172.
  • 173.
  • 174.
  • 175.
  • 176.
  • 177.
  • 178.
  • 179.
  • 180.