Download as PDF, PPTX
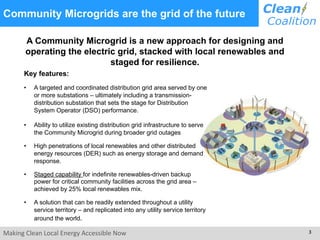
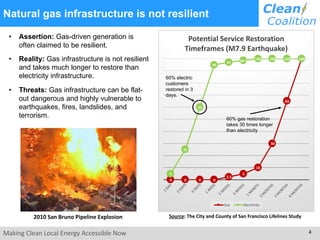
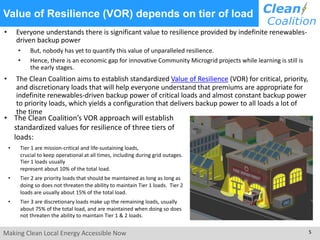
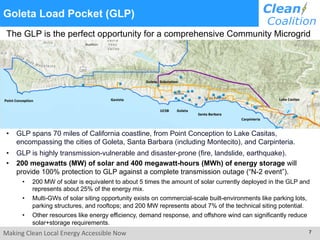
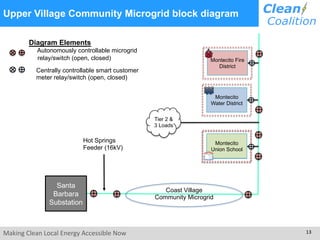
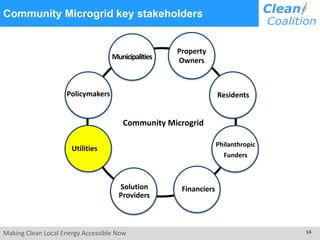
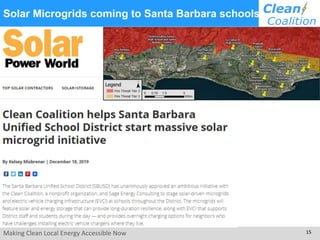

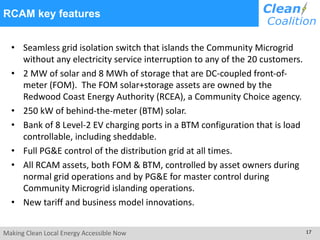
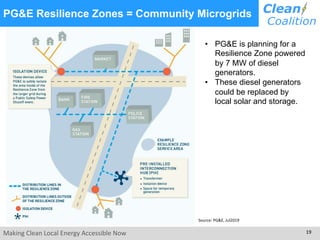
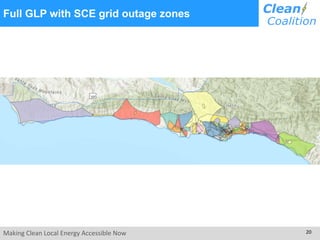
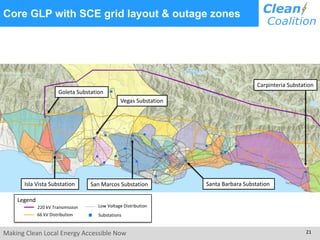
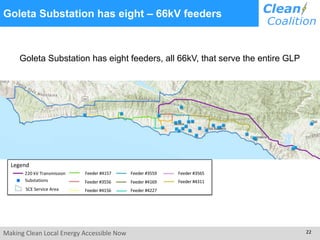
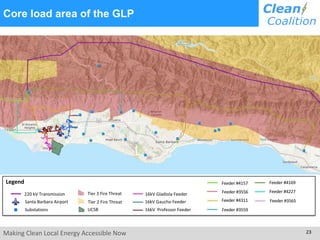
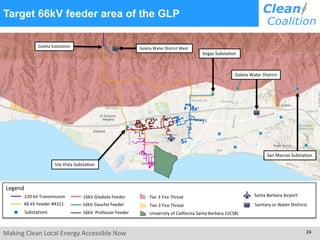
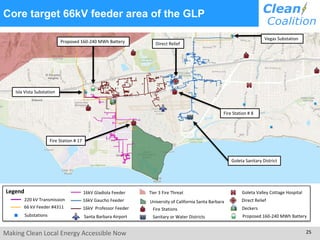


The document outlines the Clean Coalition's mission to promote community microgrids powered by local renewable energy, emphasizing resilience without dependency on traditional gas infrastructure. It discusses the development and benefits of these microgrids in disaster-prone areas like the Goleta Load Pocket, detailing their capacity to provide backup power and reduce reliance on gas peaker plants. Additionally, it presents a valuation framework for resilience, categorizing critical loads and their importance during grid outages.


