Download to read offline

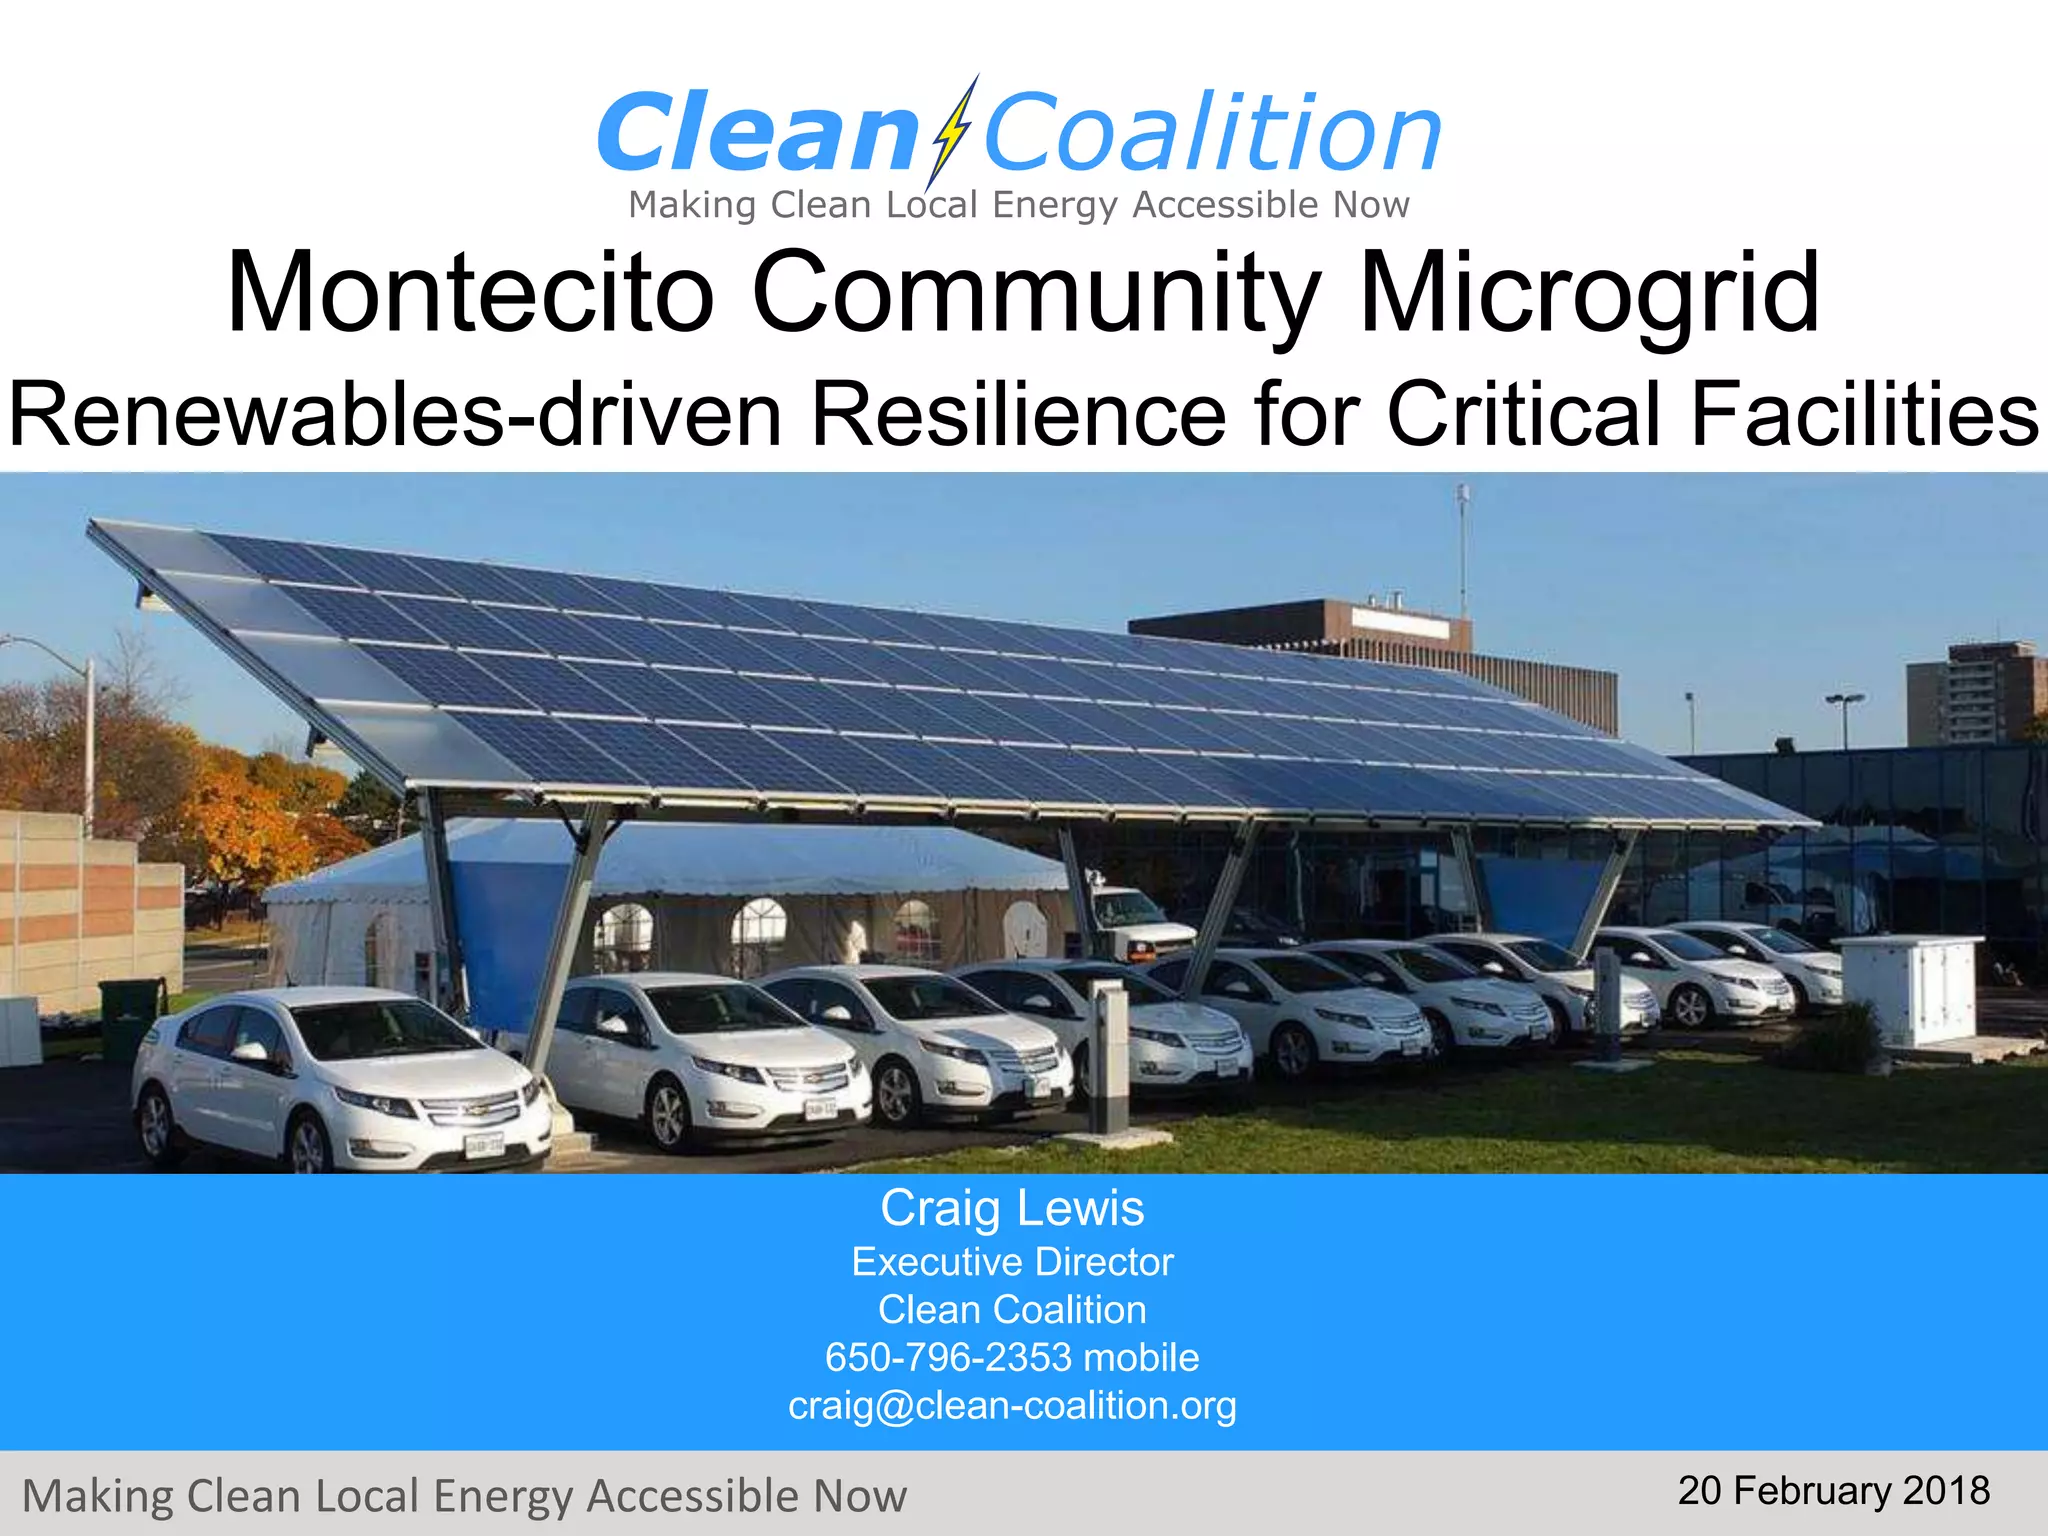
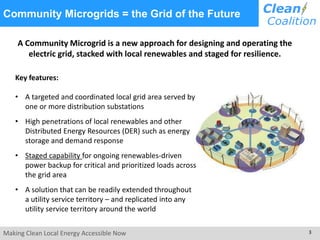
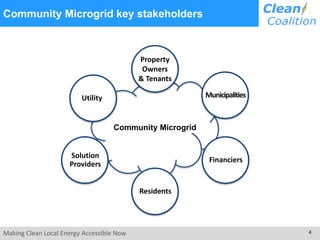
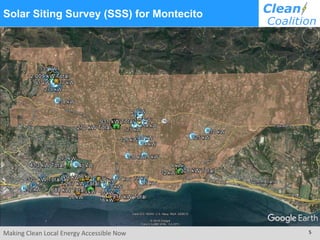
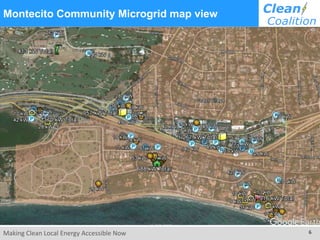
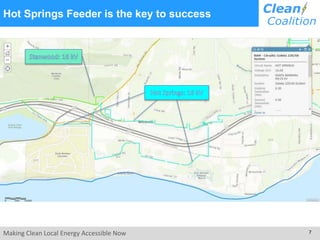
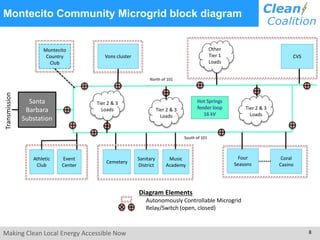
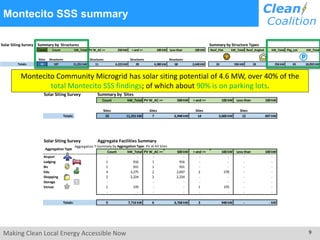
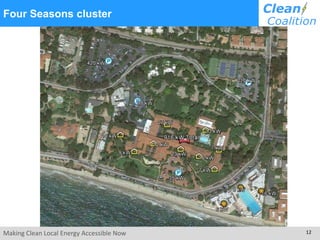
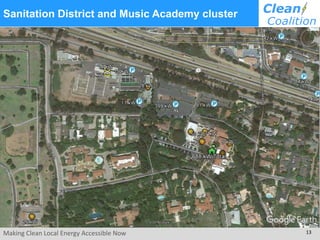
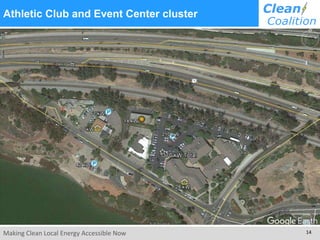
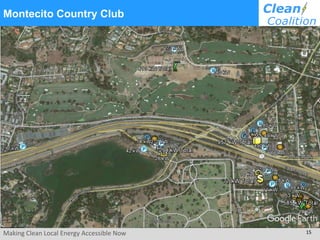
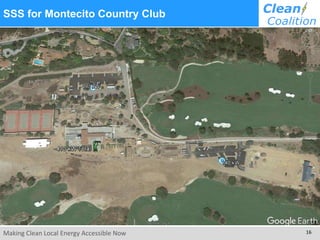
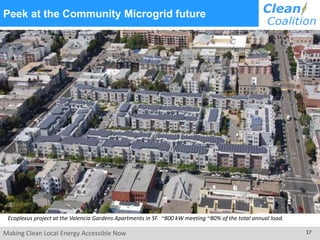
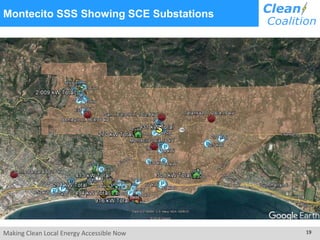

The document discusses the Montecito Community Microgrid initiative aimed at enhancing local energy resilience through the utilization of renewable energy sources. It outlines the microgrid's features, key stakeholders, and potential solar siting opportunities, revealing a solar capacity of 4.6 MW primarily from parking lots. Additionally, the document includes technical details regarding local substations and their generation capacities.


![Concept of the Hagersvalle Energy ParkF[1]](https://cdn.slidesharecdn.com/ss_thumbnails/d44b81a5-7281-44ad-a763-c17f403f6add-150504103541-conversion-gate01-thumbnail.jpg?width=640&height=640&fit=bounds)