Download to read offline


![Making Clean Local Energy Accessible Now 32
Site Name
Meters or
Buildings Critical Loads
NEM Solar
[kW AC]
FIT Solar
[kW AC]
Total
Solar [kW
AC] Battery [kW]
Battery
[kWh]
EVCI
(Level 2)
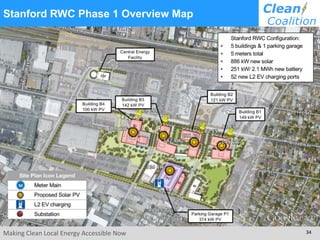
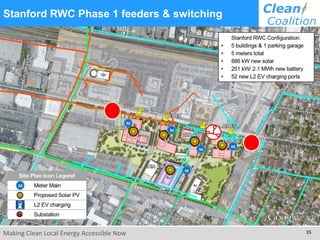
Stanford Redwood
City
Phase 1
P1, B1-B4
Campus emergency
response
886 0 886 251 2,100 52
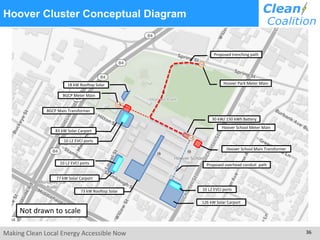
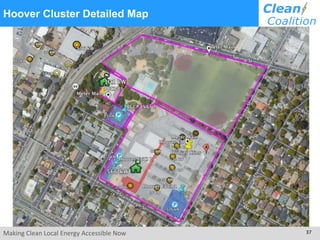
Hoover Cluster
Hoover School Shelter & food service 73 203 276 29 150 20
Boys & Girls Club Shelter & food service 11 90 101 0 0 10
Hoover Park Equipment staging 0 0 0 0 0 0
Redwood City
Corporate Yard
Redwood City
Corporate Yard
Road and public
facility maintenance
and repair
136 352 488 58 360 *4
San Mateo County
Corporate Yard
(SMC Yard)
SMC Yard Meter 1
Road and public
facility maintenance
and repair
65 0 65 58 240 0
SMC Yard Meter 2 33 121 154 0 0 *4
SMC Yard Meter 3 0 79 79 0 0 0
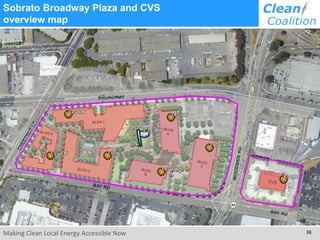
Sobrato Broadway
Plaza
Sobrato Broadway
Plaza (multiple
meters)
Low income housing 0 1,197 1,197 TBD TBD TBD
Sobrato CVS Pharmacy & grocery 0 83 83 TBD TBD TBD
New Deployments TOTAL 1,204 2,125 3,329 396 2,850 82
Deployment Summary
With net metering, only 1.2 MW can be deployed.
With a new FIT program, an additional 2.1 MW of local, renewable generation could
be deployed in a disadvantaged community.](https://image.slidesharecdn.com/community-microgrids-optimizing-economics-environment-resilience-01cl-16-may-2018-180604184858/85/Community-Microgrids-Optimizing-economics-environment-resilience-5-17-18-32-320.jpg)
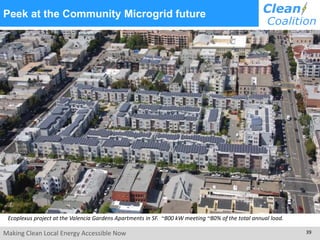


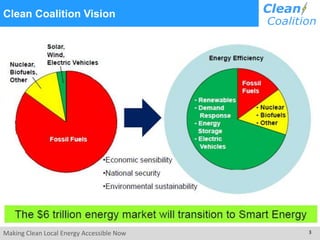
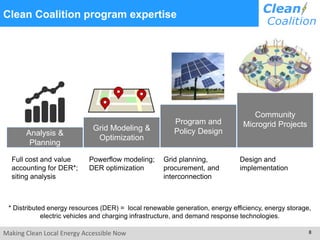
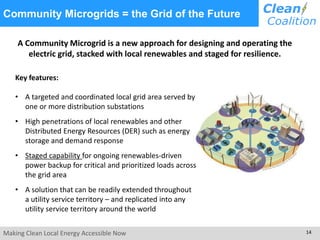
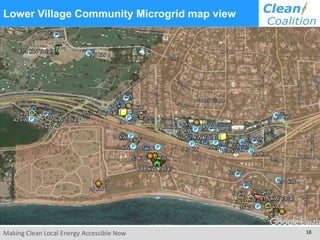
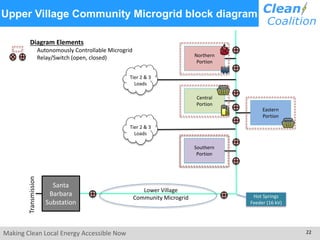
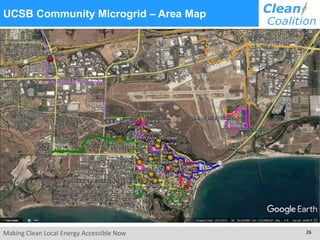
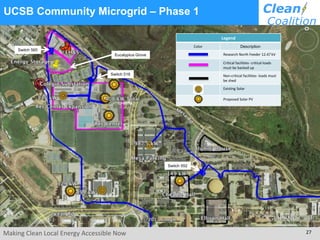
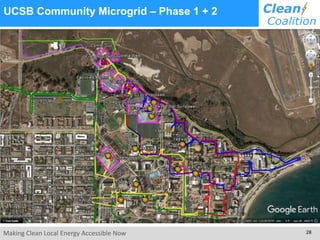
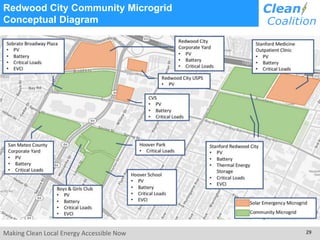
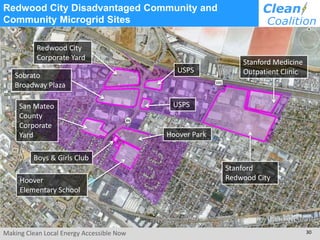
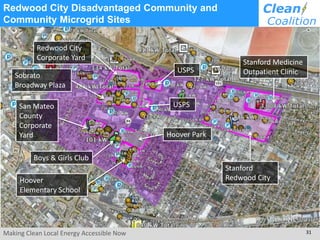
The document outlines the Clean Coalition's mission to promote local renewable energy through community microgrids by 2025 aiming for 25% of US electricity from such sources. It details initiatives for optimizing distributed energy resources (DER), strategies for project execution, and examples of successful implementations in different communities. Additionally, funding strategies and deployment models are discussed, emphasizing the importance of local energy solutions for resilience and sustainability.